TREND LINE BREAKOUT AND RETEST FOR BULLISH MOVE ALERT!Hey Trader
Congratulation all trader for new ATH 3038
THERE is OB in H1 and market is near to break trend line zone and goes for sell for hunting some liquidity from 3015 area.
Now trend is BUll so we just scalp in sell for long term GOLD bull move is going to the moon and month prediction is 3200.
TARGET AREA FOR BULL 3039 AND 3060.
follow risk management
Bullishpattern

BTC ANALYSIS🚀#BTC Analysis :
🔮As we can see in the chart of #BTC that there is a crucial support and resistance zone. Now trading at a crucial resistance zone. We could expect a bullish move from this level
⚡️What to do ?
👀Keep an eye on #BTC price action. We can trade according to the chart and make some profits⚡️⚡️
#BTC #Cryptocurrency #TechnicalAnalysis #DYOR

EUR/USD Bullish Continuation Setup📈 Trend Analysis:
The price is trading within a rising channel, suggesting an overall bullish trend.
The market recently pulled back to a key support level, presenting a potential buy opportunity.
🔍 Key Levels:
Buy Zone: Around 1.08680 - 1.08966, marking strong support.
Target: 1.10140, aligning with the upper trendline resistance.
📌 Trade Plan:
Look for buy entries near the lower boundary of the ascending channel.
Confirmation through bullish candlestick patterns (e.g., engulfing, pin bar) strengthens the setup.
⚠ Risk Management:
Stop loss: Below the 1.08680 support level.
Take profit: Gradually scale out at 1.10140 resistance.

ADBE to $465 - Chance for a BounceNASDAQ:ADBE ADBE, as well as other tech stocks, was beaten hard over the last couple of months. The earnings recently did not provide any relief for the chart either, although the figures were not particularly bad. In particular, the possible prospect of finally being able to expand and monetize Adobe's own AI “Firefly” continues to offer good opportunities.
With a PE of now under 20, Adobe has become quite favorable as a company that continues to grow well in the SaaS sector. It has also reached several technical support zones. We are at the lower edge of a very large bull flag that has been in place since the beginning of 2024. Horizontal support at $385 is also supportive. We have 3 large daily gaps in the chart above us and a bullish wedge within the flag. This is a good place to start buying for a possible bounce towards $465.
However, one must bear in mind that the overall market remains bearish. Purchases should therefore be closely hedged and not be too large. However, it would be wrong not to use this opportunity to enter the market.
Target Zones
$465.00
Support Zones
$385.00
$360.00

#DYMUSDT is showing signs of growth📉 Long BYBIT:DYMUSDT.P от $0,4575
🛡 Stop loss $0,4350
🕒 1H Timeframe
⚡️ Overview:
➡️ The main POC (Point of Control) is at 0,4149, indicating the area with the highest trading volume.
➡️ The 0,4572 level acts as a local support, as the price previously bounced from this zone.
🎯 TP Targets:
💎 TP 1: $0,4720
💎 TP 2: $0,4850
💎 TP 2: $0,4970
📢 Monitor key levels before entering the trade!
📢 If 0,4572 is broken downward, the trade may be invalidated.
BYBIT:DYMUSDT.P is showing signs of growth — expecting further upside movement!

Gold (XAU/USD) – Bullish Reversal & Breakout PatternChart Pattern Analysis
The 15-minute chart of Gold (XAU/USD) showcases a classic support-resistance structure, along with a potential bullish reversal pattern forming. The price is currently reacting to key levels, and the setup suggests an impending move toward higher price targets.
Key Chart Patterns Identified:
🔹 Support & Resistance Flip:
The price initially struggled at resistance (~$3,038 - $3,045) before experiencing a pullback.
It found strong support (~$3,027 - $3,030), confirming a potential retest zone for a bullish reversal.
🔹 Double Bottom Reversal Pattern:
The price bounced twice from the support zone, forming a possible double-bottom pattern – a classic bullish reversal sign.
If the price successfully holds this level, a breakout above the previous high (ATH - $3,045) is expected.
🔹 Break & Retest Structure:
A bullish breakout from resistance could trigger a rally toward the next target zone ($3,056 - $3,060).
A possible higher low formation suggests market accumulation before an upward continuation.
Trade Plan – How to Approach This Setup
📌 Entry Confirmation:
Look for a bullish candle formation at support (~$3,027 - $3,030).
A strong breakout and retest above ATH ($3,045) would provide further confirmation.
📌 Stop-Loss Placement:
Below support ($3,027) to limit downside risk.
If price breaks below this zone, the bullish scenario gets invalidated.
📌 Take-Profit Targets:
1️⃣ First Target: $3,045 (ATH breakout confirmation)
2️⃣ Final Target: $3,056 - $3,060 (Major Resistance & TP Zone)
Potential Market Scenarios:
✅ Bullish Breakout:
If price breaks & retests resistance ($3,045), a rally toward $3,060 is likely.
❌ Bearish Breakdown:
If price fails to hold support ($3,027), a drop to $3,020 - $3,015 could occur.
🚀 Final Thoughts:
This setup presents a high-probability bullish opportunity, but confirmation is key! Wait for price action signals before entering.
📊 Do you agree with this analysis? Drop your thoughts in the comments! 🔥

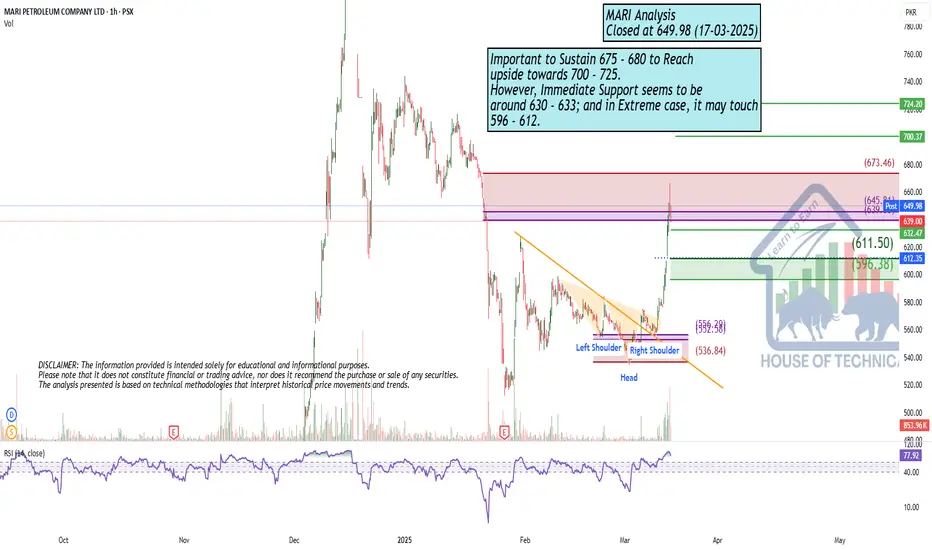
Still BullishImportant to Sustain 675 - 680 to Reach
upside towards 700 - 725.
However, Immediate Support seems to be
around 630 - 633; and in Extreme case, it may touch
596 - 612.
$BANANA @BananaGunBot ─ Possibly beginning of Accumulation Range🍌 $BANANA @BananaGunBot 🍌
Could this possibly be the beginning of an Accumulation Range?
As usual, my base case is Wyckoff Accumulation Schematic #1.
Time and more data will tell—adding $BANANA to the watchlist.
Clues to Support an Idea:
1️⃣ Prolonged downtrend
2️⃣ Preliminary Support (PS) – Surge in selling volume followed by above-average buying volume
3️⃣ Selling Climax (SC) – Huge increase in selling volume
4️⃣ Automatic Rally (AR) – Short-lived spike in buying volume

EUR/GBP Technical Analysis - 4H Chart
📌 Pair: EUR/GBP
📈 Current Price: 0.84092
Key Levels:
🔹 Support Zone: 0.83766 - A key area where price has previously bounced.
🔹 Resistance Zone: 0.84400 - A strong resistance level where price has faced rejection.
🔹 Target Level: 0.85004 - Potential bullish target if price breaks above resistance.
Market Structure & Trade Idea:
EUR/GBP has shown strong bullish momentum, breaking above the support zone (0.83766).
Currently, price is testing the resistance level. A slight pullback toward support could provide a new buying opportunity.
A break above resistance would confirm bullish continuation toward 0.85004.
Trading Plan:
✅ Bullish Scenario: Wait for a pullback to 0.83766 before entering long, targeting 0.85004.
✅ Bearish Scenario: If price breaks below 0.83766, a deeper retracement to 0.82652 may follow.
🔍 Watch for:
Breakout confirmation above resistance.
Strong rejection from support before entering a trade.

$XRP #XRPArmy @Ripple ─ Wyckoff Re-Accumulation Schematic #2CRYPTOCAP:XRP My preferred🔺bullish scenario is Wyckoff Re-Accumulation Schematic #2 🔺
Also the volume pattern is looking spot on. 👀

Bearish Divergence on Weekly TF but... there is a Breakout..Bearish Divergence on Weekly TF.
However, Breakout on Daily TF from 452 - 453.
Weekly Closing above this level would
be a positive sign.
Upside Targets can be around 495 - 500
& if this level is Sustained, with Good
Volumes , we may witness 540 - 550.
Should not break 400, otherwise, we may see
heavy Selling pressure.

Bullish on All Time Frames.Bullish on All Time Frames.
Breakout above 46.50.
Already re-tested the Previous Breakout
around 38.
Immediate Support is around 42.50 - 44
Immediate Targets can be around 49 - 50
However, It has the potential to touch 59 - 60.
It should not Break 40 now.

#1000XUSDT is setting up for a breakout📉 Long BYBIT:1000XUSDT.P from $0,05470
🛡 Stop loss $0,05297
1h Timeframe
⚡ Plan:
➡️ POC is 0,04229
➡️ Waiting for consolidation near resistance and increased buying activity before the breakout.
➡️ Expecting an impulsive upward move as buy orders accumulate.
🎯 TP Targets:
💎 TP 1: $0,05640
💎 TP 2: $0,05775
🚀 BYBIT:1000XUSDT.P is setting up for a breakout—preparing for an upward move!

Ethereum at a Turning Point: History Repeating?Ethereum is currently at a decisive moment, sitting at a major support level that has historically played a crucial role in determining the market’s direction. The parallels to 2021 are striking. Back then, ETH experienced a deep correction of over 60 percent after reaching its cycle high. However, once it found support in a key liquidity zone, it staged an explosive rally, gaining over 175 percent in just a few months. Now, in 2025, we are seeing an almost identical setup. ETH has once again corrected significantly from its recent highs, dropping nearly 58 percent, and is now testing the same kind of structural support that previously acted as a springboard for a new bull run.
The technicals indicate that this support level is not just any ordinary price zone. It coincides with the 200-week exponential moving average, a historically strong dynamic support level that has often marked the bottom of major corrections. Additionally, this region aligns with a previously established demand zone that saw significant buying interest in the past. The fact that ETH is testing this support right before a major macroeconomic event makes this moment even more critical. On March 19, the Federal Reserve is set to announce its latest interest rate decision, which could have a direct impact on liquidity conditions across all markets, including crypto.
If Ethereum manages to hold this level and bounce, the upside potential could be significant. The first major resistance to overcome would be around 3929, a level that previously acted as a rejection zone during the last cycle. A breakout above that level could open the door for a move towards 4875, which represents a key structural resistance and would put ETH back in a strong bullish trend. A repeat of the 2021 pattern could mean that ETH is on the verge of another parabolic move.
However, the bearish scenario cannot be ignored. If this support fails and ETH breaks below this critical zone, it would be a major warning sign. A breakdown could trigger further downside pressure, potentially leading to a deeper correction and confirming a bearish trend. This could mean that Ethereum enters an extended bear market, with the next significant support levels much lower. The rejection at resistance, followed by a lower high, would suggest that sellers remain in control, and without strong bullish catalysts, a further decline would be the path of least resistance.
Beyond technicals, fundamentals are playing an equally important role. The crypto market has been increasingly correlated with traditional finance, and with the Federal Reserve’s decision just days away, investors are watching closely. If the Fed signals continued monetary tightening or delays interest rate cuts, risk assets like Ethereum could face further downside. On the other hand, a more dovish stance from the Fed could inject fresh liquidity into the market, acting as a catalyst for ETH to reclaim higher levels.
Sentiment in the crypto space is also crucial. On-chain data suggests that long-term holders are still accumulating, which indicates confidence in Ethereum’s long-term value. However, short-term traders remain cautious due to the uncertain macro environment. Open interest in ETH futures has seen a decline, suggesting that many traders are waiting for confirmation before making big moves. This means that volatility could spike significantly once a clear direction is established.
Overall, Ethereum is at a critical juncture. The historical comparison to 2021 suggests that this could be the start of a major recovery, but whether or not history repeats itself depends largely on external factors like the Federal Reserve’s decision and broader market sentiment. If this support holds, ETH could be at the beginning of another strong bull cycle. If it fails, the bearish alternative could become the dominant narrative. The next few days will be crucial in determining which path Ethereum takes.

BreakoutBreakout on Daily TF.
Good Buying Range: 98 - 99
It has the potential to touch
110 - 113 initially.

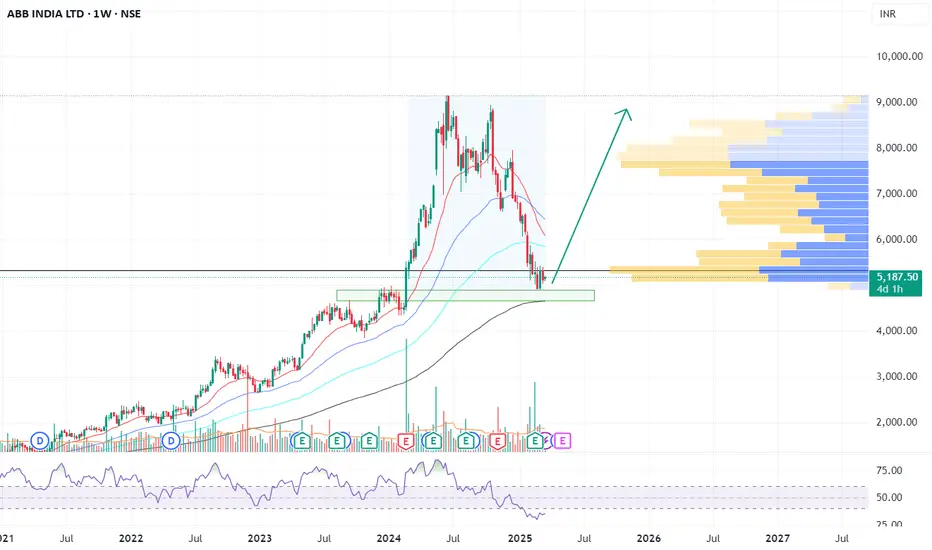
ABB India Ltd. (NSE: ABB) - Technical Analysis & Market OutlookABB India Ltd. (NSE: ABB) - Technical Analysis & Market Outlook
Overview:
ABB India Ltd. has demonstrated significant price action over the past few years, with a strong uptrend followed by a corrective phase. The current price action suggests a potential reversal from key support levels, presenting an opportunity for long-term investors and swing traders.
Key Observations:
Support Zone: The stock is currently testing a major support level around ₹5000 - ₹5200 , which aligns with a previous accumulation zone and historical resistance-turned-support.
200-Week Moving Average: Price action is hovering near the 200-week moving average, which has historically acted as a strong dynamic support.
RSI & Momentum: The Relative Strength Index (RSI) has moved into oversold territory and is now showing early signs of a potential reversal.
Volume Profile Analysis: The highest volume concentration is observed around the ₹6000-₹7000 range, indicating a major supply zone where price may retest if a reversal occurs.
Price Structure: The formation suggests a higher low structure , which is a positive sign for bullish continuation.
Potential Trade Setup:
Entry : Around the current levels of ₹5100-₹5200 with confirmation of bullish momentum.
Stop-Loss : Below ₹4800, as a break of this level may invalidate the bullish thesis.
Target 1 : ₹7000 (previous consolidation zone & high-volume area)
Target 2 : ₹9000 (previous swing high & psychological resistance)
Conclusion:
ABB India Ltd. is currently at a critical juncture, with strong confluence of technical factors supporting a potential upside move. Traders should monitor price action closely for confirmation before entering. If the support holds, the stock has a high probability of reversing towards higher levels.
Disclaimer: This analysis is for educational purposes only and should not be considered as financial advice. Conduct your own research before making any trading decisions.
BNB/USDT: BREAKOUT SETUP!!🚀 Hey Traders! Ready to Ride the BNB Breakout? 👋
If you’re hyped for this setup, smash that 👍 and hit Follow for elite trade ideas that actually deliver! 💹🔥
🔥 BNB Breakout Alert – Big Move Incoming! 🔥
BNB is looking strong and bullish, breaking out from a bull flag formation on the 4H timeframe. If it holds above the flag, we could see a massive 40% surge! 📈
💰 Trade Setup:
📍 Entry Range: $588 - $600
🎯 Targets: $628 / $688 / $746 / $794 / $844
🛑 Stop-Loss: $566
⚡ Leverage: Low (Max 5x)
🔎 Strategy: Enter with low leverage now, add more on dips, and ride the momentum to higher levels!
💬 What’s Your Take?
Are you bullish on BNB’s breakout potential? Share your analysis, predictions, or strategies in the comments! Let’s secure those gains and ride this wave together! 💰🚀🔥

#AI16ZUSDT is setting up for a breakout📉 Long BYBIT:AI16ZUSDT.P from $0,2037
🛡 Stop loss $0,1985
1h Timeframe
⚡ Plan:
➡️ Waiting for consolidation near resistance and increased buying activity before the breakout.
➡️ Expecting an impulsive upward move as buy orders accumulate.
🎯 TP Targets:
💎 TP 1: $0,2072
💎 TP 2: $0,2100
💎 TP 3: $0,2125
🚀 BYBIT:AI16ZUSDT.P is setting up for a breakout — preparing for an upward move!

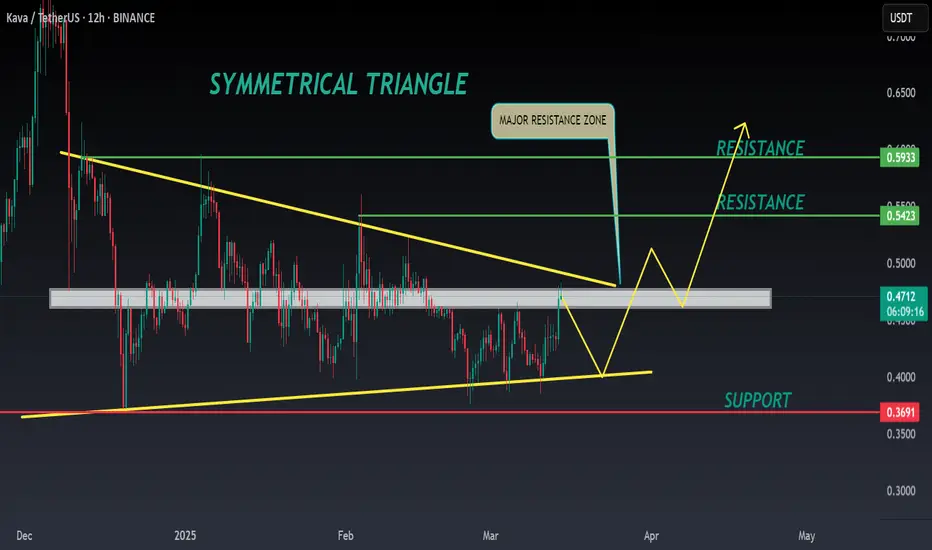
KAVA ANALYSIS🔮 #KAVA Analysis
💲💲 #KAVA is trading in a Symmetrical Triangle Pattern. If the price of #KAVA breaks and sustain the higher price then will see a pump. Also there is an instant strong support zone. We may see a retest towards the support zone first and then a reversal📈
⁉️ What to do?
- We have marked crucial levels in the chart . We can trade according to the chart and make some profits. 🚀
#KAVA #Cryptocurrency #Support #Resistance #DYOR
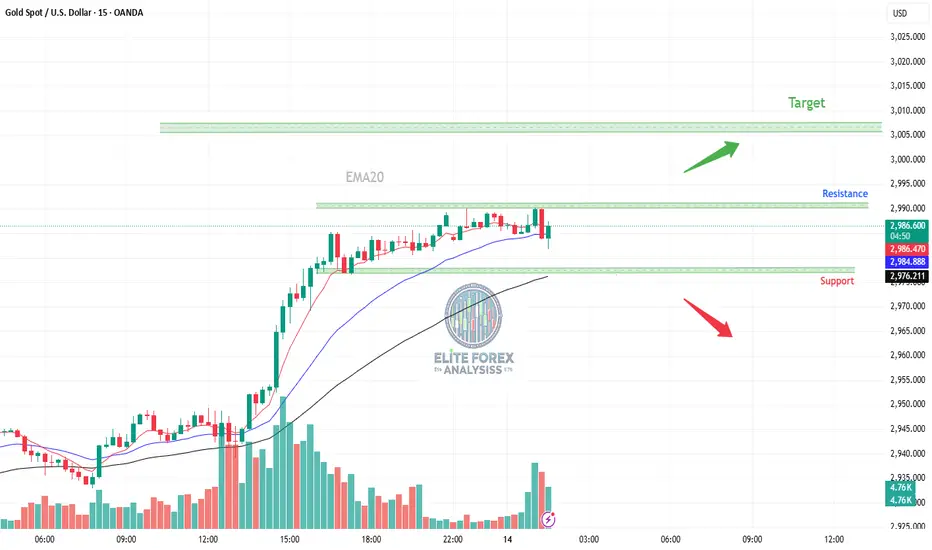
Gold (XAU/USD) Trade Plan**Gold (XAU/USD) Trade Plan** 🏆
📌 **Key Levels:**
- **Support:** $2978
- **Resistance:** $2991
📈 **Bullish Scenario (Breakout Above $2991)**
- **Buy Entry:** After a strong breakout with confirmation.
- **Take Profits:**
- **TP1:** $2996
- **TP2:** $3001
- **TP3:** $3005
- **Indicator Confirmation:** EMA 20 for trend strength.
📉 **Bearish Scenario (Support Break at $2978)**
- **Potential Retracement or Reversal:** If price breaks below $2978, it may trigger a downtrend.
- **Risk Management:** Use stop-loss and position sizing to manage risk.
🔍 **Watch for Volume & Candle Patterns for Confirmation!** 🚀
EURUSD MY VIEW DAILY TIME FRAMEThe Structure looks good to us, waiting for this instrument to correct and then give us these opportunities as shown on this instrument (Price Chart).
Note: Its my view only and its for educational purpose only. Only who has got knowledge about this strategy, will understand what to be done on this setup. its purely based on my technical analysis only (strategies). we don't focus on the short term moves, we look for only for Bullish or Bearish Impulsive moves on the setups after a good price action is formed as per the strategy. we never get into corrective moves. because it will test our patience and also it will be a bullish or a bearish trap. and try trade the big moves.
We do not get into bullish or bearish traps. We anticipate and get into only big bullish or bearish moves (Impulsive Moves). Just ride the Bullish or Bearish Impulsive Move. Learn & Know the Complete Market Cycle.
Buy Low and Sell High Concept. Buy at Cheaper Price and Sell at Expensive Price.
Please keep your comments useful & respectful.
Keep it simple, keep it Unique.
Thanks for your support
Tradelikemee Academy
Saanjayy KG

Bearish Divergence on Monthly TF but Bounce ExpectedBearish Divergence on Monthly TF.
Very important Support lies around
160 - 162; and a Bounce is Expected if this level
is Sustained on Monthly Support.
Bullish Divergence on Short TF; so a bounce can be seen
up to 177 & then 194 (if 177 is Sustained)

Bullish week!!! Happy long week!!
It's looking like a bullish week a great setup yesterday. And few more sniping and will see and
Entry:148.191
SL:148.054
TP:148.790
