Double BottomDouble bottom with Bullish Divergence
Immediate Targets around 43 - 45
Support is around 39 - 39.50
Should not Break 37.50
Bullishpattern

Bitcoin going to move to 320K?As the market is cooling down after the Trump rally there is only bearish sentiment left. People calling for ''the liquidation of M. Saylor'', ''the bearmarket'', ''BTC to 0!''
In the chart above we can witness an almost textbook version of a MASSIVE cup and handle pattern. It broke out of the neckline on nov 4th last year and is now on it's path to retest it.
Should it hold i expect the bullrun to continue soon. So see this post as a light at the end of the tunnel.
Target: 320K
Stoploss: sub 70K (there is resistance at 70/66K area)
Rustle

Recently made LL on Shorter TF, but..Recently made LL on Shorter TF,
but also it is a Support level with Double Bottom.
Hidden Bullish Divergence on Daily TF.
Immediate Support lies around 86 - 89
& Immediate Resistance is around 91 - 92.
Sustaining 91 - 92 on Weekly TF, would
lead it towards 98 - 99.
Ultimate Target (if 109-110) is Sustained,
is around 128 - 130.
Should not break 81 now.

Will this bottoming pattern return you 300%?Dearest reader, superrare has been showing tremendous strength during the recent downtrend by which RARE captured my eye. A whopping 4000% increase in volume in just one day might be a sign for things to come.
Looking at the above chart a couple of things stand out. Looking at the current bars pattern is looks eerily similar to the one from August 2024 (blue arrows).
I expect resistanceline A to be hit in the near future, from current price this would be 100% gain. If broken the sky is the limit but be aware of resistanceline B. If that is broken... expect massive gains!
Target: 0.35$
Stoploss: 0.046$
Rustle

Bullish Divergence on Monthly TF.Bullish Divergence on Monthly TF.
However, a Very Strong Resistance is around
44 - 45.
39.50 - 40 may act as a Daily Support Level but
it resisted twice from 42.
34.50 - 36.50 seems to be a Strong Support which
is also a Confluence area of 2 Important Tools.

HL Confirmed on Weekly.HL Confirmed on Weekly TF around 92.
Bullish Divergence on Daily TF.
Crossing 107 with Good Volumes
may lead it towards 112 & then 120+

Breakout ExpectedSymmetrical Triangle Formation.
Breakout Expected around 116000;
Targeting 126000 if 118700 - 119000 is sustained.
Important Support Levels:
S1 around 111500
S2 around 108500 - 110200
Immediate Important Resistance is around 119000

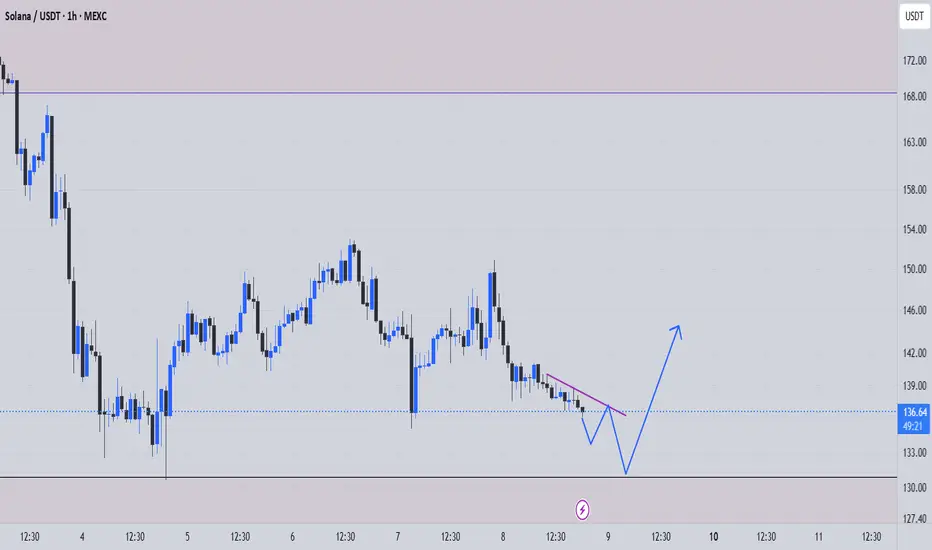
sol buy midterm"🌟 Welcome to Golden Candle! 🌟
We're a team of 📈 passionate traders 📉 who love sharing our 🔍 technical analysis insights 🔎 with the TradingView community. 🌎
Our goal is to provide 💡 valuable perspectives 💡 on market trends and patterns, but 🚫 please note that our analyses are not intended as buy or sell recommendations. 🚫
Instead, they reflect our own 💭 personal attitudes and thoughts. 💭
Follow along and 📚 learn 📚 from our analyses! 📊💡"
DGB ANALYSIS🔮 #DGB Analysis - Breakout 🚀🚀
💲💲 In daily time-frame,Falling Wedge Pattern is forming and a good breakout is done. And a small retest is done, now we would see a good reversal move in #DGB ✅ 💯🚀
💸Current Price -- $0.00955
📈Target Price -- $0.001544
⁉️ What to do?
- We have marked crucial levels in the chart . We can trade according to the chart and make some profits. 🚀💸
#DGB #Cryptocurrency #Breakout #DYOR

Bitcoin Butterfly Harmonic Pattern – Multi-Fibonacci Confluence!A potential Bullish Butterfly Harmonic Pattern is developing, with point D yet to be completed. If price action reaches the harmonic completion zone, it could present a high-probability long opportunity near a stacked Fibonacci confluence zone.
The D-leg aligns beautifully with the 0.382 Fibonacci retracement of the entire 5-wave Elliott structure from the macro low at $15,476 to the all-time high of $109,588. A level that has acted as key support in the past. Multiple additional Fibonacci confirmations further strengthen this potential bullish reversal zone.
Pattern Breakdown – Bullish Butterfly Formation
The Butterfly Harmonic Pattern is a structured reversal setup, often forming at market extremes before trend shifts.
1️⃣ XA Leg – The initial impulse.
2️⃣ AB Leg – A retracement of 0.786 – 0.886 Fibonacci of XA.
3️⃣ BC Leg – A counter-trend move retracing 0.382 – 0.886 of AB.
4️⃣ CD Leg – The final move, typically extending 1.618 – 2.618 Fibonacci of XA.
📍 In this developing setup:
✅ B-point retraces 0.806 of XA → Butterfly pattern remains valid.
✅ C-point retraces 0.838 of AB → Strengthening structural alignment.
✅ D-leg projection target 1.695 XA extension, converging with multiple key Fibonacci levels.
Fibonacci Confluence – Strong Potential Reversal Zone ($73,783.52 - $73,157)
As price moves toward potential point D, multiple Fibonacci levels create a high-probability reversal area:
0.382 Fibonacci retracement of the entire 5-wave Elliott structure ($73,637.22)
Negative -0.236 Fibonacci retracement at $73,251.43
Negative -0.618 Fibonacci retracement at $73,157
Trend-based Fibonacci Extension 1:1 at $73,783.52
📍 Potential Reversal Zone: Between $73,783.52 and $73,157
Trade Setup – Waiting for Confirmation
Since point D has not completed yet, we should wait for bullish confirmation signals in the reversal zone before entering.
Entry Zone (if price reaches D): Between $73,783.52 and $73,157
Stop Loss: Below $73,157 (D-point invalidation)
Take Profit: B-point resistance
Risk-to-Reward (R:R): 3:1 if TP at B-point
⚠️ Key Reminder:
🚨 The pattern is not confirmed yet. A reaction in the potential reversal zone (e.g., bullish divergences, strong buying pressure, or reversal candlesticks) would strengthen the case for a long position.
Are you watching this level for a potential reaction? Will point D complete? Let’s discuss in the comments! 🚀🔥

TSLA’s Failed Breakout: Reversal or Deeper Drop Ahead?Tesla (TSLA) Market Outlook & Long-Term Investment Report
Tesla (TSLA) has positioned itself as more than just an electric vehicle (EV) manufacturer. With its advancements in robotics, artificial intelligence (AI), autonomous driving, and energy solutions, Tesla is becoming a major player in multiple high-growth industries. While recent price action has shown volatility, long-term investors see buying opportunities at key support levels.
Technical Analysis & Key Levels
1. High-Timeframe Context (HTF)
- HTF Resistance: $415.71 – Tesla attempted to break above this level but faced rejection, leading to a sharp pullback.
- Major Support & Resistance Zone – A critical level where Tesla has previously consolidated and reacted strongly.
- Liquidity Zones (LQZs):
- Daily LQZ (~$238.18) – A key demand area where buyers could step in.
- Weekly LQZ (~$182.44 - $108.01) – A deeper liquidity zone, potentially offering even better long-term buying opportunities if the downtrend continues.
2. Market Structure & Trend Analysis
- **Failed Breakout:** Price action showed a breakout above resistance, but the failure to hold led to a sharp reversal, indicating a potential liquidity grab.
- **Retest of Support:** The price is currently testing a significant support level, which will determine the next move.
- **Momentum Shift:** The aggressive rejection at HTF resistance suggests sellers are in control in the short term, but this creates long-term entry opportunities.
Long-Term Investment Thesis
Tesla's expansion into AI, robotics, and autonomous technology presents significant long-term growth potential beyond its traditional automotive business. Here are the key areas driving Tesla's future:
1. Robotics & Artificial Intelligence
- **Tesla Optimus Robot:** Tesla’s humanoid robot project is expected to revolutionize industrial automation. It could become a major revenue source as industries move toward AI-driven labor solutions.
- **Neural Networks & AI Advancements:** Tesla’s AI systems, used for Full Self-Driving (FSD), are also being adapted for robotics, increasing its competitive edge.
2. Energy & Infrastructure Expansion
- **Solar & Energy Storage:** Tesla’s **Megapack** and **Powerwall** businesses are growing as renewable energy adoption accelerates.
- **Grid-Scale Energy Solutions:** Tesla’s energy division could play a crucial role in stabilizing power grids worldwide, providing another strong revenue stream.
3. Autonomous Vehicles & FSD
- Tesla’s **Full Self-Driving (FSD)** software could create a high-margin subscription-based revenue model.
- The potential for a **Tesla Robotaxi network** could disrupt the ride-sharing industry and unlock new business models.
4. Synergies with SpaceX & AI Computing
- Tesla benefits indirectly from advancements in **SpaceX** technologies, such as materials science and AI computing.
- The **Dojo supercomputer** is being developed to enhance AI training, which could accelerate Tesla’s robotics and self-driving ambitions.
Investment Strategy & Accumulation Plan
For long-term investors, Tesla's volatility provides attractive buying opportunities. A strategic approach would involve:
1. Key Accumulation Levels
- **Daily LQZ (~$238)** – A strong support zone where Tesla could see renewed buying interest.
- **Weekly LQZ (~$182-$108)** – A deeper level that may offer excellent long-term value if the price declines further.
2. Dollar-Cost Averaging (DCA) Strategy
- Instead of trying to time the absolute bottom, investors can **ladder buy-ins** at different liquidity zones to optimize their cost basis.
- This reduces risk and takes advantage of market dips without excessive exposure.
3. Risk Management & Long-Term Horizon
- Tesla is known for its volatility; maintaining **a long-term vision (5+ years)** is crucial for maximizing gains.
- Investors should be prepared for short-term fluctuations while focusing on Tesla’s multi-industry expansion.
Conclusion
Tesla’s failed breakout and recent pullback present a strategic buying opportunity for long-term investors. With its advancements in robotics, AI, energy, and autonomous technology, Tesla is well-positioned to be a key player in multiple trillion-dollar industries over the next decade. The current price action suggests that accumulation at liquidity zones could provide strong long-term returns.
As the robotics industry grows, Tesla’s potential as a leading producer for industrial automation is increasingly clear. Investors with a bullish long-term outlook may find current and upcoming dips as prime entry points.
Final Thought
**Is Tesla’s current dip a gift for long-term believers?** With its expanding technological footprint, this may be an opportunity to accumulate before the next major growth cycle. 🚀

DXY Weakens, EUR/USD Breaks Out BullishThe DXY has broken its bullish trendline and a key support area. It is now approaching the next support level on the daily timeframe. Similarly, EUR/USD has broken out above its falling wedge pattern, signaling a bullish move for the euro. Consider buying EUR/USD and riding the trend until it reaches the resistance level.

Perfect ABCD Pattern on Weekly TF.Perfect ABCD Pattern on Weekly TF.
161 - 165 is a Good Support now.
Next Important Support level is around 143 - 145.
Company Directors' are themselves buying this
share @ around 171.

AAVE Retests Key Support – Bullish Reversal Ahead?CRYPTOCAP:AAVE is currently retesting a rising support line after breaking through a key resistance zone, which has now turned into support.
This structure suggests that the uptrend remains intact, and the recent dip could be a healthy pullback before a continuation to the upside.
DYOR, NFA

SWING IDEA - SAILSAIL Stock Technical Analysis
Steel Authority of India Limited ( NSE:SAIL ) has been consolidating around the 95 resistance level for over a year. After multiple attempts, the stock finally broke out above this level in January 2024, turning it into a strong support zone.
Following the breakout, SAIL surged to a peak of 175, marking an 85% gain. However, the stock then saw a sharp retracement, correcting by nearly 47% and revisiting the rising trendline support around the 100-105 range. This level, which previously acted as resistance, has now become a critical demand zone.
Currently, SAIL is showing signs of renewed bullish momentum, bouncing off its trendline support and forming a potential reversal. The weekly MACD crossover, observed in the chart, further reinforces a trend reversal signal. Additionally, a short-term upside target of 12% is indicated, while a long-term potential target of 76% upside is visible in the chart, aligning with the previous swing high.
The chart also highlights three take-profit targets:
Target 1: The first profit-taking zone, offering an initial opportunity to secure gains.
Target 2: A mid-level profit-taking zone, aligning with previous consolidation areas.
Target 3: The final take-profit level around 175, marking the prior high and a potential full exit point for long-term investors.
KEY OBSERVATIONS:
One-year resistance of 95 was decisively broken in January 2024
Stock surged 85% to a high of 175 before correcting 47%
100-105 level now acts as a strong rising trendline support
Weekly MACD crossover signals a bullish momentum shift
Three take-profit targets identified, with the final target at 175
Potential upside target of 76% from support levels, aligning with previous highs
RECOMMENDATION:
Based on this technical analysis, holding SAIL for the long term could be a strong strategy. The potential returns include:
12% upside in the short term
76% upside from current levels, targeting previous highs around 175
This analysis presents a compelling buying opportunity in SAIL, fueled by its breakout, support validation, and momentum reversal.
IMPORTANT NOTE:
Investors should be aware that there is a chance the stock may retest the 100-105 support level before resuming its upward trajectory. This potential pullback should be carefully monitored, and investment strategies should be adjusted accordingly.
DISCLAIMER: This analysis is for educational and informational purposes only and should not be considered as financial advice. Technical indicators and historical data are not guarantees of future performance. Investors should conduct thorough research, assess risk tolerance, and consult a financial advisor before making any investment decisions.

XCN has serious breakout potential on the 5th wave count.XCN went on a massive run over the past few months, followed by a significant decline along with the overall crypto market. The chart, however, is telling a story of what could become a massive move to the upside on the 5th wave of the wedge pattern's internal wave count.
I wouldn't count XCN out just yet. I think good things are coming to XCN in the future, even if the 5th wave ends up failing this time around.
Good luck, and always use a stop loss!

ADA/USDT at Decision Point – Major Move Incoming!ADA/USDT is testing a major resistance zone after retesting the 100 EMA and bouncing from the rising support line. The price remains in a long-term symmetrical triangle, with the resistance trendline as a key breakout level.
The Stochastic RSI is recovering from oversold levels, indicating potential bullish momentum. A breakout above resistance could trigger a strong uptrend continuation, while rejection may lead to a pullback toward support.

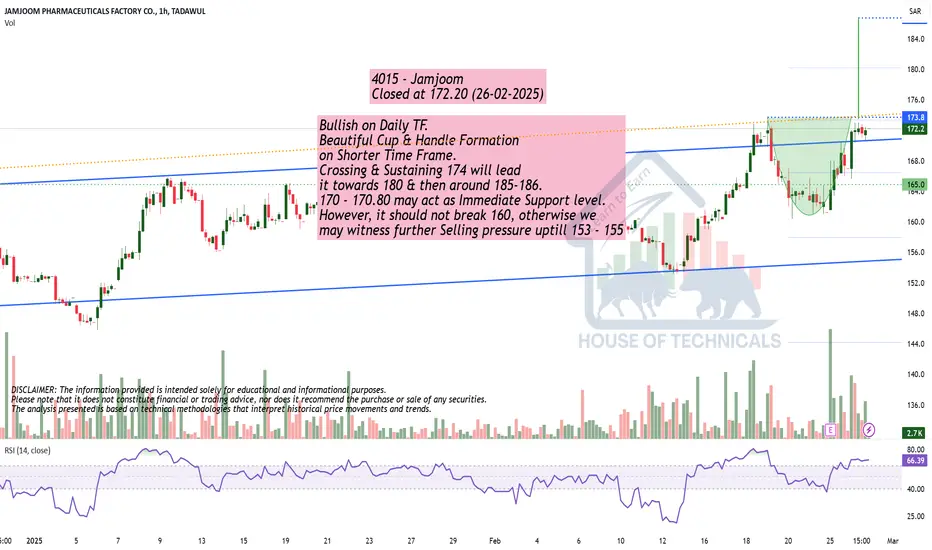
Bullish on Daily TF.Bullish on Daily TF.
Beautiful Cup & Handle Formation
on Shorter Time Frame.
Crossing & Sustaining 174 will lead
it towards 180 & then around 185-186.
170 - 170.80 may act as Immediate Support level.
However, it should not break 160, otherwise we
may witness further Selling pressure uptill 153 - 155
MINA ANALYSIS📊 ##MINA Analysis
✅There is a formation of Descending triangle pattern on weekly chart. Also #MINA is trading around its all time low level. If the price sustains here and give a bullish move then we could expect a bullish move otherwise we would see more dip.
👀Current Price: $0.3220
⚡️What to do ?
👀Keep an eye on ##MINA price action and volume. We can trade according to the chart and make some profits⚡️⚡️
##MINA #Cryptocurrency #TechnicalAnalysis #DYOR

Is Bitcoin Topping Out? Critical Levels to WatchSince the low of $15,476 on November 21, 2022, Bitcoin has surged to an all-time high of $109,588 on January 20, 2025. That’s an incredible +608% increase over 791 days. We also hit the long-anticipated $100K mark. But for almost three months now, Bitcoin has been stuck in a range between $90K and the all-time high, showing some indecision in the market.
Looking Back: Market Structure & Trends
Bitcoin spent over 250 days consolidating between $50K and $70K before finally breaking out in November 2024, right around the U.S. election. That breakout triggered a massive rally, pushing Bitcoin to 100K in just one month. Since then, bulls and bears have been battling it out, trying to establish control over this crucial psychological level.
A look at the pitchfork tool shows that Bitcoin has been rejected at the 0.618, 0.666, and 0.786 levels multiple times while trying to push higher. Recently, we lost the median line of the pitchfork and dropped below 100K, suggesting bullish momentum is fading. The 233 SMA/EMA on the 4-hour TF as well as the 21 EMA/MA on the daily TF has also flipped into resistance, adding to the bearish pressure.
Is February Shaping Up to Be a Bearish Month?
If we compare the current cycle to the 2020 bull market, the price action looks similar, forming a top where Bitcoin struggles to break higher. February could bring a healthy correction before any new leg up.
Key Support Zones & Confluences
Here’s where we could see solid support:
Unfilled CME Gap at $77,930 – Historically, Bitcoin tends to fill these gaps over time
Pitchfork Lower Support Line (~$80K) – If Bitcoin drops, this level aligns with multiple confluences by late February or early March
Fib Speed Fan (0.618 from $50K to ATH) – Perfectly lines up with the pitchfork lower support around $80K
Trend-Based Fibonacci Extension (1.618) – Another confluence at the $79K mark
Fib Retracement (0.5 from $50K to ATH) – Adds more support at $79.3K
Negative Fibonacci Retracement (-0.618) – Lands right at the open gap, reinforcing this zone
Daily 233 EMA/MA – Sitting at $81.3K and $76.4K, further supporting this region
Key Support Zone: $80K - $78K – With all these confluences, this is a strong area for a potential long setup
Additional Support Zone: FWB:88K - $86K – Another important region to watch for a bounce
Resistance Levels & Confluences
Psychological Resistance at 100K – A major battle zone between bulls and bears
Daily 21 EMA/MA (~$99.5K - 101K) – A key resistance level that could cap any upward movement
233 SMA/EMA on the 4H Timeframe – Now acting as resistance, adding pressure to the downside
Potential Trade Setups
Long Setup #1: A potential entry from FWB:88K - $86K
Long Setup #2: $80K - $78K support zone with confirmation could present a high-probability trade
Final Thoughts
Bitcoin is facing strong resistance at 100K, with multiple technical indicators suggesting a possible pullback. While the bigger trend remains bullish, February might bring a correction, providing great long opportunities around the FWB:88K - $86K and $80K - $78K region. Keep an eye on key support zones and look for confirmation signals before jumping into trades.
New Indicator Release
The 4H, Daily, and Weekly support zones seen on the charts are from my new indicator, which I released for free a few days ago. Feel free to check it out and incorporate it into your analysis.

#SHELLUSDT – Bullish Scenario, Expecting a Breakout📈 LONG BYBIT:SHELLUSDT.P from $0.7000
🛡 Stop Loss: $0.6671
⏱ 1H Timeframe
⚡ Trade Plan:
✅ The BYBIT:SHELLUSDT.P price is showing strong momentum after breaking out of a consolidation zone.
✅ The asset has broken above $0.6957 and is holding above this level, signaling a potential continuation of the uptrend.
✅ Increasing volume confirms buyer activity.
🎯 TP Targets:
💎 TP 1: $0.7350
🔥 TP 2: $0.7700
📢 Holding above $0.7000 would confirm further bullish movement.
📢 POC at $0.4671 is far below the current price, indicating a trend shift.
📢 Increasing volume supports the bullish case.
📢 Securing partial profits at TP1 ($0.7350) is a smart risk-management strategy.
🚀 BYBIT:SHELLUSDT.P remains in an uptrend – monitoring for continuation and securing profits at TP levels!

Bitcoin (BTC/USDT) DAILY MAKE IT OR BREAK IT?With volatility increasing, the next move could set the tone for the coming weeks. Will BTC break out and push higher, or face rejection and retrace? Watch closely! 👀
What’s your bias? Bullish or bearish? Let me know in the comments!

Up or DownAs we can see in the chart, on December 24th, Bitcoin's price reached its climax, moving cleanly without further structures to follow. Since then, the price has formed micro-structures and is now attempting to create a much larger one that would allow it to advance—a megaphone pattern (D).
If this megaphone were completed with an upward move today, it could catapult the price above $149K. With each passing day, the potential price target increases. However, to form the full megaphone, a base had to be established, which is what we are seeing now. On December 24th, a structure was formed that facilitates a return to the $107K level and also helps determine the price range where the megaphone's base (C) could be finalized, between $86K and $77.6K.
Today, a bull flag (B) has formed within a falling wedge (A), and the price movements align with this pattern, which aims to return to the apex before continuing the upward move. However, even if the price surges due to the bull flag breakout, I believe it might retrace again to continue building the base of the megaphone, which is quite broad.
