Bearish Reversal Incoming? Key Resistance Holds as Price StallsAfter analyzing multiple timeframes, we observe that the price has surged significantly and is now trading within a key resistance zone. The resistance remains strong, and the RSI across multiple timeframes is in the extreme overbought territory, showing bearish divergences. Additionally, despite the sharp rally, the price has not undergone any meaningful correction.
Considering these factors—strong resistance, the proximity to a weekly trendline, extreme overbought conditions, and bearish divergence—along with the presence of a hanging man candlestick at resistance, a correction is likely. Our correction targets are the 50% and 61.8% Fibonacci retracement levels.
Candlestick Analysis

I am Still Bullish ! For me Price will hold this support for today both ETH and BTC
I am Bullish and long on ETH for the next 48 hours
Weekly will rise later tonight i suppose
Just a thought !

DXY Technical Outlook📊 DXY (US Dollar Index) – Daily Analysis
Market Structure:
📉 DXY remains in a bearish structure on the daily, making lower highs and lower lows.
💥 Price is currently testing the key 102.812 support level.
-Previous Trend: The market had a strong bullish move from around October to late December 2024.
🌎 Ongoing tariff tensions between the US and other countries have increased market volatility.
📈 Bullish Scenario:
✅ If DXY sustains above 102.812, a push towards 104.223 resistance is possible.
🚀 A clean break and retest above 104.223 could open the way for continuation towards 105.67 and 107.170.
📉 Bearish Scenario:
⚠️ If DXY fails to hold above 102.812, expect a drop towards 101.500.
🔄 In this case, 102.812 could flip into new resistance, confirming bearish momentum.
📉 A breakdown below 101.500 would likely expose DXY to the 100.000 psychological support level.
🔻 Tariff-driven risk-off sentiment could accelerate the move lower.
⚠️ Risk Disclaimer:
This analysis is for informational purposes only and does not constitute financial advice or a trading signal. Market conditions can change rapidly, especially with ongoing tariff talks and geopolitical developments. Always confirm market conditions using your own strategy before making any trading decisions.

NASDAQ tanks below key levels amid new Trump tariffs!The market free-falls as Trump's new tariffs send shockwaves through global sentiment.
Sellers are piling in — but it's the fear of economic fallout that's truly fuelling this drop.
The NAS100 has broken through major support zones with strong bearish momentum.
Sellers are clearly in control, and price action shows little sign of slowing down.
Structure around 18,324 failed to hold. Next major support zone: 16,968.5.
Will the bleeding stop there?
⚠️ Reminder:
No one can predict what will happen next.
Markets react to collective psychology, news flow, and big players—not forecasts.
✅ Focus on:
-Key Levels 🔎
-Market Structure 📐
-Risk Management 🛡️
❌ Don’t trade based on emotion or prediction.
🎯 Trade based on probability, not certainty.
👉 Let price confirm your bias — watch for clear breakouts, retests, or rejections before jumping in.
Stay patient, stay disciplined. 📈📉

Clear DayTrading strategy video. The "Inside Bar"🔉Sound on!🔉
📣Make sure to watch fullscreen!📣
Thank you as always for watching my videos. I hope that you learned something very educational! Please feel free to like, share, and comment on this post. Remember only risk what you are willing to lose. Trading is very risky but it can change your life!

Trump Tariffs send global Markets into free fall. Trump Tariff announcements has sent the global markets into free fall. The reaction has sent global markets into knee jerk reaction. Global trade will axis will realign because of these actions of US. As per the analysis of many experts the disadvantages to India are limited. There are opportunities galore in sectors like Pharma and Textile etc. The support levels for Nifty currently are at 22338, 21983, 21289, 20095 and finally 19864. The resistances for Nifty are 23037, 23266 and 23894. Long term Resistance for Nifty remain at 24831 and 25K levels.
Short term outlook for Nifty is weak. In the medium term Nifty can remain range bound and Long term outlook for Nifty still remains strong. Investors with Long term outlook can search for Bottom Fishing opportunities in Blue chip stocks which are available at good prices.
Focus should be on India centric themes where products and companies are less dependent on exports specially to US. Having said that it can be a blessing in disguise for sectors like Pharma and Textile. If Indian leadership can turn this obstacle into oppertunity by taking the right steps it can be a curse in disguise. Investors can also look at collecting some ETFs international as well as local as a long term investment.
In cricket matches sometimes losing a toss can be a blessing in disguise this is something like that.
Disclaimer: The above information is provided for educational purpose, analysis and paper trading only. Please don't treat this as a buy or sell recommendation for the stock or index. The Techno-Funda analysis is based on data that is more than 3 months old. Supports and Resistances are determined by historic past peaks and Valley in the chart. Many other indicators and patterns like EMA, RSI, MACD, Volumes, Fibonacci, parallel channel etc. use historic data which is 3 months or older cyclical points. There is no guarantee they will work in future as markets are highly volatile and swings in prices are also due to macro and micro factors based on actions taken by the company as well as region and global events. Equity investment is subject to risks. I or my clients or family members might have positions in the stocks that we mention in our educational posts. We will not be responsible for any Profit or loss that may occur due to any financial decision taken based on any data provided in this message. Do consult your investment advisor before taking any financial decisions. Stop losses should be an important part of any investment in equity.

Gold Wave Analysis – 4 April 2025
- Gold broke daily up channel
- Likely to fall to support level 3000.00
Gold recently reversed down from the resistance level 3150.00 (which formed the daily Bearish Engulfing) and broke the sharp daily up channel from February.
The breakout of this up channel added to the bearish pressure on Gold – accelerating the active downward correction to the higher-order impulse wave (3) from November.
Gold can be expected to fall to the next round support level 3000.00 (which stopped the previous short-term correction iv).

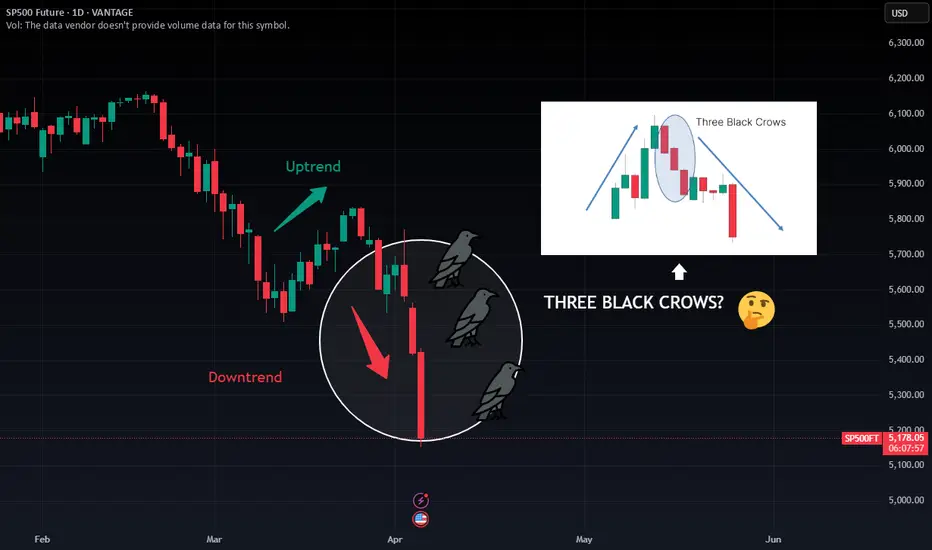
Are These the Three Black Crows Signaling More Pain Ahead? The S&P 500 has just printed three consecutive long-bodied red candles following a brief uptrend. This classic "Three Black Crows" formation could be a powerful bearish reversal signal—one that historically hints at a deeper correction on the horizon.
📊 What does this pattern mean?
Appears after an uptrend or rally.
Consists of 3 bearish candles closing near their lows.
Suggests strong seller control and trend reversal potential.
🔍 Current context:
The S&P is already under heavy pressure from macroeconomic and geopolitical concerns.
This pattern adds further bearish sentiment, especially if we see continued follow-through on volume.
🚨 If confirmed, we could be looking at the continuation of a larger downtrend. But remember: confirmation is key. Watch closely how price reacts in the next 1–2 sessions.
🧠 Do you see this as a real warning—or just a pause before the next leg up?
#SP500 #ThreeBlackCrows #CandlestickPatterns #BearishSignal #TechnicalAnalysis
NZDUSDwait and see , valid rejection set up to buy.
risky cause all demand above mitigate.
DISCLAIMER:
what I share here is just personal research, all based on my hobby and love of speculation intelligence.
The data I share does not come from financial advice.
Use controlled risk, not an invitation to buy and sell certain assets, because it all comes back to each individual.

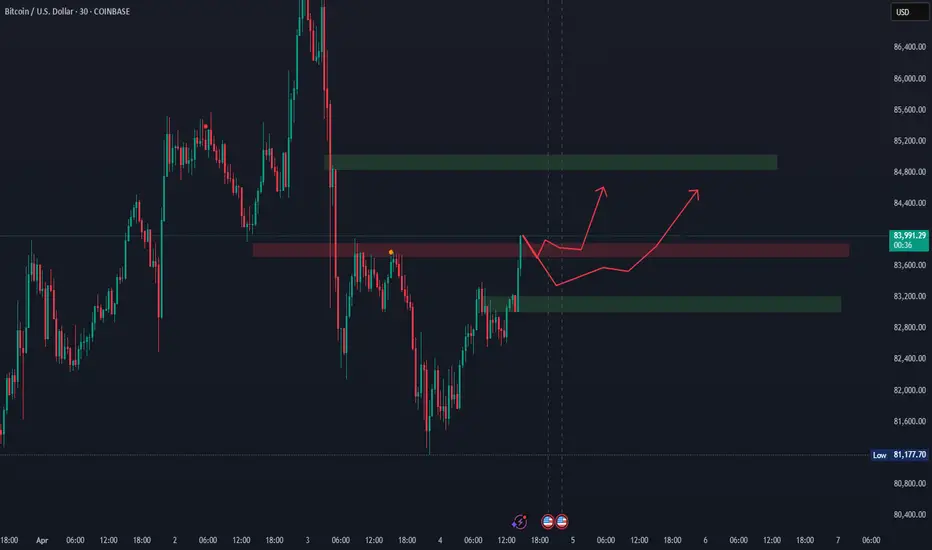
BTC BuysNeed the 30 minute candle to close above 83900, then wait for a retracement for the next candle and enter at the break of the high. Potential target is 84800. Retracement for the move can come up to 83200. If price breaks below that level, then we can exit the trade.
ENA/USDT Price Analysis📌 About ENA Token
ENA is the native token of Ethena, a decentralized synthetic dollar protocol built on Ethereum. Ethena aims to provide a stable, scalable, and censorship-resistant crypto-native alternative to traditional stablecoins. The token is used for governance, staking, and liquidity incentives within the Ethena ecosystem.
📉 ENA/USDT Price Analysis (4H Chart on Binance)
🔎 Market Overview
🔹 Current Price: $0.3194
🔹 Recent High: $0.3420 (Resistance)
🔹 Recent Low: $0.2907 (Support)
🔹 Volume: 3.56M (High volume at recent dip, showing potential buyer interest)
📈 Bullish Factors:
✅ Short-Term Bounce: The price has rebounded from the $0.2907 support level, indicating buyers stepping in.
✅ Moving Average Support: The yellow line (short-term MA) is beginning to turn up, suggesting early bullish momentum.
✅ Key Resistance at $0.3420: If ENA breaks this level, it could move towards $0.3509 - $0.3718.
⚠ Bearish Risks:
❌ Overall Downtrend: ENA is still trading below the blue (medium-term) and green (long-term) moving averages, which could act as resistance.
❌ Lower Highs Pattern: The recent price structure suggests a potential bearish continuation unless it breaks above $0.3420 - $0.3509.
❌ Potential Drop to $0.2907 - $0.2530: If ENA gets rejected at resistance, a lower move to the major support around $0.2907 or even $0.2530 is possible.
📊 Possible Scenarios:
1️⃣ Bullish Case (Breakout Above $0.3420)
If ENA breaks and holds above $0.3420, the next targets are $0.3509, $0.3718, and possibly $0.3942.
A breakout confirmation would signal trend reversal.
2️⃣ Bearish Case (Rejection & Drop to Support)
If ENA fails to break $0.3420, expect a pullback to $0.3106 - $0.3060 first.
If those supports fail, ENA could retest $0.2907 and possibly drop further to $0.2530.
💡 Trading Strategy:
📌 Long Entry: If ENA breaks $0.3420, target $0.3718 - $0.3942.
📌 Short Entry: If rejected below $0.3420, look for shorts targeting $0.3106 - $0.2907.
📌 Stop Loss: Set below $0.2907 for long trades and above $0.3420 for short trades.

DOLLAR INDEX (DXY): Time To RecoverThe Dollar Index appears poised for a retreat after testing a key support area on a 4-hour chart.
A robust bullish engulfing candle indicates strong buying activity in that region.
As a confirmation, I see a cup and handle pattern on that and a breakout of its neckline.
I anticipate a bullish upswing to at least 102.79.

Nasdaq market analysis: 04-APRIL-2025Good morning. Welcome to today's Nasdaq market analysis and educational insights for price action traders.

Gold trading insights: 04-APRIL-2025Gold trading insights: Not signals, but informative zones to aid your decision-making. Please note: These zones are not trading advice. Use them as a starting point for your own analysis.

IAG Additional Price Levels • LSE • Airlines Group Stock • FTSE⚠️ IAG Going to plan, looks like it's a TRUMP DUMP 🤣
Now is the TIME TO HUNT the stocks for your PORTFOLIO.
ℹ️ When TRUMP causes a DUMP I accumulate SIT BACK and just WAIT fornthe PUMP...🚀
These additional price levels will be used as an additional filter to TIME an ENTRY ONLY IF the BIDS come in 🟢SeekingPips🟢 NEEDS to see some VOLUME🚀🚀🚀

FETCH AIsweet spot to buy, but this danger if u in the market use leverage.
better spot market time to dollar cost averaging.

XAUUSD: Buy or Sell?Today's gold market can be said to have the largest intraday volatility since 2025! After experiencing violent fluctuations, the current trend of gold has once again become anxious.
However, from the perspective of range conversion, it is certain that gold is currently operating in a weak position, and after the brutal and violent fluctuations, the market also needs to recuperate. And there will be NFP tomorrow. It is expected that before NFP, it will be difficult for gold to form a new unilateral market again. So in the process of shock, I think both long and short sides have a certain profit space.
First of all, pay attention to the resistance of 3125-3135 area on the top. If gold touches this area during the shock process, we can still short gold;
And the first focus on the 3095-3085 area on the bottom is that if gold touches this area during the shock process, we can still consider going long on gold.
The trading strategy verification accuracy rate is more than 90%; one step ahead, exclusive access to trading strategies and real-time trading settings

Still below 23400 ! As per our plan every rise is being sold till it sustained above 23400 hence we will stand by our analysis of selling the rise and unless it sustains itself above 23400 the trend will not be changed so plan your trades accordingly and keep watching.

Short on BTC4H trend is bearish, 1H trend also bearish
3 potential sell :
1. Break Low 1H candle (BOS) , retest and reject. SL slightly above retest, TP 1:2 RR
2. Pullback on last 1H supply, wait rejection on 1H candle, SL sligtly above rejection, TP on Last low or 1:2 RR
3. Pullback on last 4H supply, wait rejection on 1H candle, SL sligtly above rejection, TP on Last low or 1:2 RR

BTC/USDT 4H Chart Analysis 🚀 BTC/USDT 4H Chart Analysis 🏆
🔍 Market Overview:
Bitcoin (BTC/USDT) is currently testing a key support zone. A confirmed breakdown could open the doors for a bearish move, while a bounce could lead to a recovery attempt.
📌 Key Observations:
🔶 Important Resistance (🟠 82,743.59 USDT)
🚧 This level has acted as a strong resistance zone. A breakout above this could trigger bullish momentum.
🔵 Crucial Support (81,633.22 USDT)
🛡️ Holding above this level is important for buyers to prevent further downside.
❌ If BTC confirms a close below this support, it could signal a continuation of the downtrend.
📊 Moving Averages (7, 25, 99 SMA):
🟡 Short-Term SMA (7): Price is testing this moving average.
🔵 Medium-Term SMA (25): Turning into potential resistance.
🟢 Long-Term SMA (99): Still bullish but flattening out.
⚡ Trade Triggers:
✅ Long Trigger (📈💰) - If BTC breaks above 82,743.59 USDT with volume → 🚀 Buy opportunity!
❌ Short Trigger (📉🔻) - If BTC closes below 81,633.22 USDT, it confirms a bearish breakdown → 🏴☠️ Short setup active!
📢 Trading Strategy:
💎 Bullish Plan: Wait for a breakout above 82,743.59 USDT with strong volume → 🎯 Target: 83,500+ USDT.
⚠️ Bearish Plan: If BTC breaks below 81,633.22 USDT, expect a drop towards 79,986.83 USDT, with a final target at 78,445.12 USDT.
🔥 Final Thoughts:
Bitcoin is at a decision point! 🎯 A breakout could push BTC higher, while a breakdown signals deeper corrections.
📢 Watch volume for confirmation before taking a position! 🚀
🔔 Stay Alert & Manage Risk! 🎯

DXY going downDXY is ready for a leg down, after bear div and topping within projected time on Daily. On 4H it's building up to a nice #SBS shape, where we can expect a move down. 4H time projection says downwards into start of, or mid, February.

NZDJPY: Pullback From Support 🇳🇿🇯🇵
There is a high chance that NZDJPY will pull back from support.
As a confirmation, I see a double bottom pattern on an hourly time frame
and a breakout of its neckline.
Goals: 85.30 / 85.58
❤️Please, support my work with like, thank you!❤️
I am part of Trade Nation's Influencer program and receive a monthly fee for using their TradingView charts in my analysis.

Nasdaq market analysis: 03-APRIL-2025Good morning Dear Traders! Join me for Nasdaq market analysis for the today. Share your charts, ask questions, and let's discuss trading strategies.
