Cardanobtc
ADABTC (Cardano) price channel: 4hr tf analysisThe recent bullish action in Cardano (ADABTC) from ~0.00002389 on March 21, 2018 till present date is captured in this analysis using a price channel. Price move upwards thus appears limited as shown by the upward red arrow as the upper target of the channel is ~ 0.00004324.
Any consideration of a long position (i.e. buy) would require patience for Cardano (ADABTC) to successfully test the bottom of its channel which in this case is ~0.00003617.
A slight break below the channel should meet with Support 1 (i.e. between 0.00003547 and 0.00003380) or Support 2 (i.e. 0.00003088 and 0.00002953) as shown in the chart. A break below support 2 could result in price of Cardano (ADABTC) further declining.
Alternatively, a breakout above the upper line of the channel followed by a consolidation in price = more upside momentum for Cardano (ADABTC).

Cardano Upside potentialCardano (ADABTC) is in consolidation following the rally it made last week.
If the rally continues we can expect price to reach the resistance level around 0.00005.
If price goes down, the next support level is just below 0.000035, which coincides with the ascending trendline.
If the support and trendline are broken, we can expect price to go down to the next support area around 0.00003.
Good Luck,
CryptoTrendline

ADA (Cardano) potential drop and entryOn 4H chart, ADA sorting out bearish divergence and we expect this to be Elliott Wave 4 that ends around 2780 - 2800 satoshi levels.
We are not interested in buying Cardano before that level is reached.
We advise everyone to use laddering and start to ladder your orders in from 2900 till 2780 satoshi levels, then sell in wave 5 landing zone between 3705 and 4060.
2780 satoshi levels is previous resistance point that got broken 5 days ago without even testing it once.
Always remember - previous resistance becomes new support and broken support becomes new resistance!
If you find this idea helpful, leave a like, comment and follow us on Tradingview & Telegram!
Any questions? Want to get these ideas first? Feel free to DM.
Have a nice day!

ADABTC Ascending Triangle + Hidden Bullish DivergenceADABTC on the 1H chart is forming an ascending triangle. Plus, hidden bullish divergence can also be seen on the RSI. Once the price breaks out of the triangle on the upside and volume supports it, theoretically, we can see a price rise equivalent to the opening of the triangle which is about 800 satoshis.
Once the price breaks out of the triangle, we will look at the volume. If the volume increases as well then that would confirm the breakout and then a long trade can be opened with a conservative profit target of 500 satoshis.
Personally, I am feeling bullish on ADA. The coin is in the top ten of CMC and Coingecko. Currently, third highest volume on Binance and highest volume on Bittrex. I have already entered a long trade at 3898 satoshis. I won't mind hodling if the ascending triangle breaks in the wrong direction so I do not have a stop-loss at the moment.
My first target is 4287 and second profit target is 4677.
Constructive criticism is welcomed!

Cardano $ADA is a must buy at current price levelsCardano is riding wave 3 aiming at USD .53 indicating 50% profits.

CARDANO: CONTINUING BULL RUN = 33.77% PROFIT!!!Our "Crypto Bottom" Trade Indicator has correctly identified a buy in point on the 25th of April 2018.
Using this buy in point and selling at today's price, you would have expected to net 33.77% PROFIT !!!
The increase in price may also be explained by positive developments including:
April 5: IELE, a virtual machine with a universal language framework for translating and executing smart contracts, is in development to be deployed on the Cardano blockchain.
April 7: Cardano notifies of it's intention to launch beta test of Cardano for Linux.
April 8: Cardano is added to Coinswitch (a crypto-to-crypto exchange aggregator and users can compare prices of ADA and 300+ other coins across their partner exchanges - including KuCoin, Bittrex, Cryptopia, Changelly, Shapeshift etc.)
April 13: The first audit was carried out by FP 0.32% Complete in conjunction with Cardano Foundation on the Cardano cryptocurrency.
April 17: Cardano is added to Binance cryptocurrency exchange.
April 27: Ouroboros Genesis, the latest version of Ouroboros, the algorithm powering Cardano. his feature matches the security guarantees of proof-of-work protocols that was previously thought to not be feasible.
(NEW) April 28: Cardano is expected to launch 2 test nets in the near future: Yella test net (Cardano’s IELE Virtual Machine) and K-EVM (Ethereum Virtual Machine) with release dates to be identified soon.
An increase is trading volume is driven by Korean Exchange Upbit and Binance accounting for 49.71% (up from 45.60%) and 31.47% (up from 30.59%) respectively.

ADA ready for a run? hi all :)
I realy expect ADA to get ready for a new run, if we see macd in 4 hours then it tells me that we will soon go up.
Rsi has plenty to go on, as we are now around 49 arena, we comming form oversold arena so I expect the trend to continue.
I hope my charts plays out.
By order: 3131 sat
Target: 3700 \ 4400
Stoploss: 3100 for me
Do not make your choices based on my decisions or charts, as I'm still new and still learning myself :)
Happy trading everyone

Ada new Goals!!ada/btc may reach 0.00003680 and if it closes above this price it will reach0.00004140

Cardano short termCardano (ADABTC) is still in consolidation following the rally from two weeks ago.
Price is trading above the support/resistance level around 0.00003 but it looks like it lost it's momentum at the moment.
If price breaks below the support level, we can expect a reaction from the ascending trendline.
If we see a break of the trendline, then the next support level is around 0.000024, where we can expect the rally to resume.
If price starts to rally from the current levels, we can expect it to reach the resistance levels around 0.000041.
Good Luck,
CryptoTrendline


Cardano (ADA) Corrective Wave, (Quick Trade Idea)While North America slept, Asia was busy taking profits after our insane short term bull run. ADA has currently shown what appears to be a head and shoulders pattern in the 4 hour chart and we are currently holding the 2900-3000 satoshi support.
Signals:
-Head and shoulders after a relatively long bullish trend
-Bearish RSI divergeance
-Lack of volume & long legged doji candlestick. signaling indecision.
-BTC Dominance rose to 39% as of 11:09 EDT, likely caused by quick BTC drop from the 9.3k levels all the way to 8.8k, meaning alts with lack of stable fiat pairs will suffer.
How to trade
- Sell at if a candle closes below the 3000 satoshi support level
- Note that if ADA breaks under support levels, we will likely see that as the next resistance.
Buying points
2600-2780 satoshi range, where previous support has been shown
2400-2500 satoshi level (Strong buy, I currently believe it is unlikely for us to reach that low)
Sell Stop
If you choose to use a sell stop, place it slightly under each support level. I know many of you are holding for the long term so it will be your decision.
Quick Trade Idea
If ADA drops 5% under a support line, we will likely see the next candle be a green one, that closes just under the support line. This idea can be used if ADA breaks under the 3000 satoshi mark for a quick 1-5% profit, but you will need to catch the opportunity.
Please criticize my TA's so I can improve. Thank's for reading!


Easy Money [ADA/CARDANO] V2ENTRY The closure of the four hour candle above the previous high
EXIT The target level is 0.00003992
RISKS In case of the fall of bitcoin, the movement may be canceled
The trend formation

ADA - Cardano in Rounding Bottom.Hey , I am back with another Trade Idea.
This time looking at Cardano - ADA. ADA was recently added to another big exchange.
ADA is currently in a Clear rounding bottom bullish pattern, even MACD looks like an perfect rouding bottom.
RSI has strong ressistance at 67 level, which was tested bounced back and few days ago was broken.
MACD is giving Strong buy signal with increasing ammount of buyers.
Hope I made your view on whats going on with Cardano somehow clearer.
If you like this TA let me know in the comments, Likes are aprreciated, Thanks !
If this gets a little bit of attention, I will update.

Bullish Cardano (ADA) Trading Idea (Increase position 10-15%) Signals:
Significant buying pressure allowing ADA to break past 2400 resistance, now proven to be a support level
RSI showing continuous strength for past 3 weeks (This is actually a bullish sign, not an indicator for an overbought coin)
Bitcoin losing dominance every week, sign that altcoin season is here.
How to trade:
If it can hold the 3000 level, buy in around there.
Sell points
Around 3500 satoshis, the first significant resistance point
Buy back in after expected correction of around 10-15%, increasing your position in ADA by 15%. This step is if you are bullish in the long term.

So Apparently The Dip Wasn't Really The Dip..... ADA CardanoI hit you guys with a scenario of us having finished our Wave 3 and being in our Wave 4 correction.... But that wasn't so.
As you can plainly see we pumped even MORE!!! Wow, Cardano really went on a moon mission with this one. So apparently we had finished SUBwave 3 of wave 5, and we broke the 2.618 and almost made it to the 3.618 Fibb Extension of waves 1 and 2.
So now I have corrected the wave count and have added the subwaves to explain how I derived my conclusion. We caught the 5 wave extension, but this still follows Elliot Wave rules because wave 3 is not the shortest and wave 2 and 4 do not overlap. Whala!!
So now that we are EXTREMELY overbought and have seemingly completed our count for wave 3, we should have the nice retracement for wave 4 that I had been expecting when I posted the last chart.
My Wave 4 target is still for the 0.382 Fibonacci Retracement, however this target is now around 2900 satoshis. And once we have completed this correction I have a wave 5 target up at the 3.618 Fibb Extension of our main waves 1 and 2, which is about 4450 satoshis.
I hope that you enjoyed my analysis. Please always remember that targets are not set in stone and to always practice proper risk management! Please like and comment any questions you may have below. Happy trading!

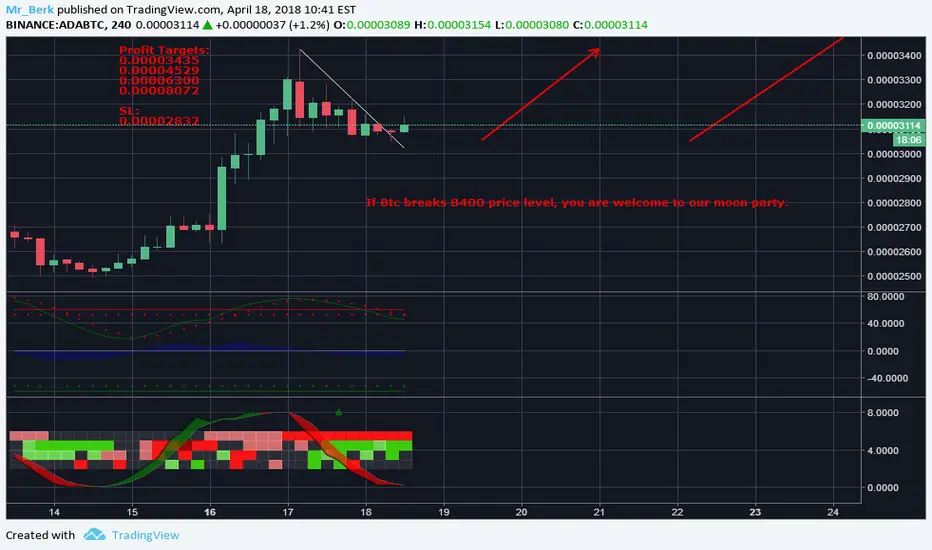
ADA/BTC = Ticket to the moon (Confirmed breakout)Confirmed breakout again and still bullish. I put profit targets and stop loss on the chart.
If bitcoin breaks 8400 price level, get ready to see moon.
Have a nice day,
Berk
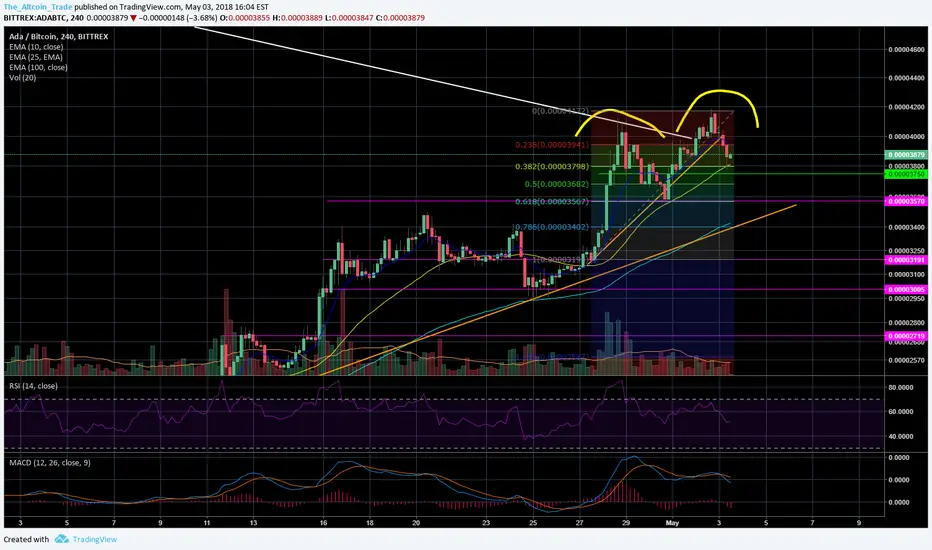
ADABTC case studyCase study on how we should have traded ADA in hindsight. We look at when we should have entered and at what levels we should have taken profit.
- Note: there's always profit taking at earlier stages doing the trades at EMA's, previous highs, fibs you name it. But on a higher level, this is what you are after.

ADA, Wave 2 Is In, Commence Dippening!!Last time i left you guys with extrapolated targets for what our wave C should look like based on Elliot Wave and Fibonacci Retracements and Extensions. Wave 1 ended slightly shallower than I expected it to, it was actually finished when i posted my last chart, but we couldn't have know that because we had no data on Wave 2 yet.
Now we see that the retracement of Wave 1 was deep. It came to the 0.786 Fibb. You can clearly see our 3 Wave ABC correctino structure within wave 2, therefore, we must continue our Wave C by commencing the start of subwave 3.
Now I have extrapolated new targets for our wave 3 and 4, and made the wave 3 fairly extended, reaching the 2.618 Fibonacci Extension . I did this because the 3.618 Fibb perfectly lines up with our 0.382 retracement of the entire 5 Wave Structure that were in the correction of right now. So, because there is such a low probability of us only correcting to the 0.236 Fibb, I've assumed that we will have a larger wave 3 in order to help us achieve the retracement to the 0.382 level.
My count seems to be lining up just fine, and I haven't changed it, only slightly corrected some of the target zones in the subwaves based on incoming data. However, keep in mind, this count is invalidated if we break above wave 1 around 3340 Satoshis.
I hope that you enjoyed my analysis. Please always remember that targets are not set in stone and to always practice proper risk management! Please like and comment any questions you may have below. Happy trading!

