UK 100, SHORT SELLING OPPORTUNITY, BIG RESITANCEResistance on the daily chart shows that 3 days ago price got rejected, by not only the horizontal resistance line but also the diagonal resistance that can be seeing clearly on the monthly chart, horizontal resistance on which was a really strong level of support and potential reversal for this chart right now.
Stop loss should be above resistance and take profit on the next level of support.
CFD

XAUUSD 1H CYPHER PATTERNHere is a cypher pattern I spotted today at Gold. Enjoy.
As always, targets and stops at screen.


Ferrari (RACE) sell signalFerrari (RACE) D1: Downtrend like from textbook + Horizontal level + Overbought + Hidden Divergence on RSI(14).

GOLD RALLY TO BE CONTINUED.We can see a beautiful flag at 4h chart. Friday, today, there was a breakout. I believe price will hold at resistance zone I mentioned with red rectangle, then reverse, make a double bottom at previous local support (blue rectangle) which will also be our retest then fly to previous highs. Beautiful set up for next week.

IBM in a bearish rising wedge?Looks like the IBM shows us a bearish rising wedge.
Definitely something to look out for, let's keep an eye on it if it works and if yes how much drop we could expect. For now I expect some pullback to a support at approximately 115$.
Since I'm still learning I'm not trading this.
If you feel the same give me some feedback I'm glad to hear from you guys!
Give a like if you feel I'm right.


Bearish Trend ContinuationMade newer lows from end of last year and we're now retesting a previous low.
SL: 2540
Entry: 2515
TP: 2415


Sugar#11 watch for double bottom pattern
Hello Traders.
We already had an impulse on Sugar#11 couple of weeks ago,
I'm expecting that that the price actions will continue to push higher.
Trade with care,
Not an investment advice.
Best Regard

But what if?Broken through support and will probably close below it at this point.
Massive sell-off.
Bears are still in control but what if 50.00 is a good support? Is this a false breakout?
I'll look for selling opportunities as it retraces to 50.00 or 54.00 but I'd need to see a good reason to keep selling when it looks like this trend is running starting to slow down.

EXXARO at 2 support levelsThe price has come down steadily to test the rising trend support at around 126.00. However, there a small horizontal support at 124.00 that is a stronger buy. The stock is extremely over-sold at current levels but it does leave the door open for price capitulation. The play here is to wait for a green candle and then buy for a relief rally.

Gold Future breakout from falling wedgeAfter G20 meeting and outcomes related to pause of trade war between US and China brings Dollar index to cool down from High level.
Technically Gold future continuous contract breakout from falling wedge pattern and to consider this breakout and price forecast it can rise up to $1261-$1266.
Now $1222-$1224 act as support.

OIL, Sell near $52.I will open Sell near $52
If the price will make fake broke of $52
Reasons:
- Long-Term trend is still bearish
- Price can make a retest of $49
- Most of the time the price makes a retest of such places.

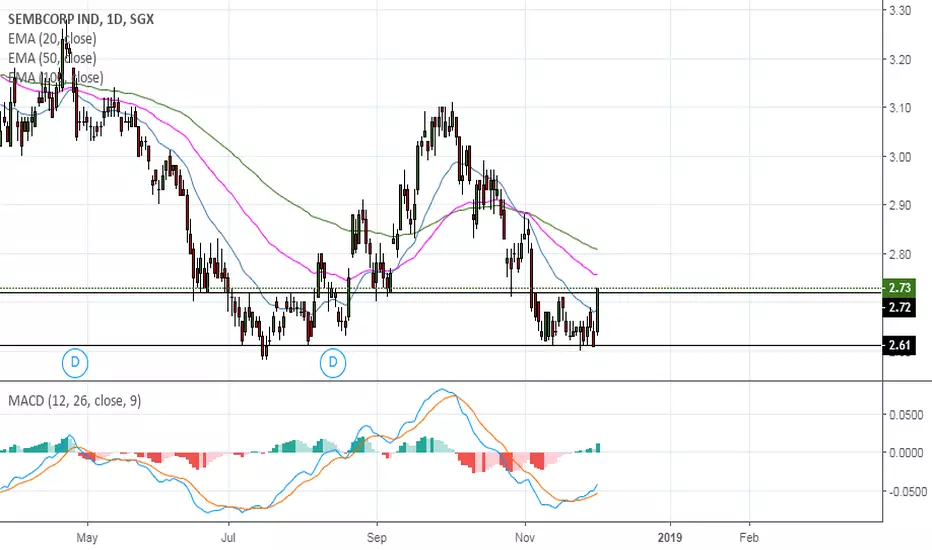
Sembcorp Ind took support may form Double Botton After Weak earning stock fall sharply and made low around 2.60.To consider downtrend is over stock have to close and trade above Level of 2.72.
All major Exponential Moving Averages are still pointing downwards. Fresh Down ward momentum picks up when stocks close below 2.60 and open downward trajectory till 2.50
Gold (XAU/USD), trading plan on next week. I will Open buy near $1212 - $1215
Goals $1233 and $1260
reasons: Price broke up mirror level, D1 close above it.
It is better to open entry after a pullback to minimize your risk and make potential profit bigger.

SOYBEANS BUY (SOYBEANS – US DOLLAR)Hi there. Price is forming a continuation pattern to the upside. Wait for the price to hit the bottom of the pattern and watch strong price action for buy.

PHLX OIL SERVICE SECTOR BUYHi there. Bigger time frame, bigger the opportunity. Price is forming a continuation pattern to the upside and a reversal pattern at the bottom of the bigger pattern. We may see a big move to the upside soon. This is a longer term trade.

NATURAL GAS SELL (NATURAL GAS – US DOLLAR)Hi there. Price is moving impulsively to the downside and currently is forming a continuation pattern to the downside. Wait for the price to complete the pattern that it’s forming and watch strong price action for sell.

WHEAT SELL (WHEAT – US DOLLAR)Hi there. Price is forming a continuation pattern to the downside. Wait for the price to hit the top of the pattern and watch strong price action for sell.

SUGAR BUY (SUGAR – US DOLLAR)Hi there. Price is forming a continuation pattern to the upside. Wait for the price to hit the bottom of the pattern and watch strong price action for buy.


Australia 200 Short IdeaNear 5922 I will open a Sell
I think the price will continue down move because long-term trend is broken and turned into a bearish month ago. Also, on the chart, we can see how the price bounced so many times from key level 5943 on Daily chart. It's the best signal that big players protect that level and near that level, we have a low and predictable risk.
Short near: 5922 goal:5778
Push like and Subscribe
