Bitcoin (BTC/USD) – Bearish Rejection from Supply ZoneThis chart represents a technical analysis of Bitcoin (BTC/USD) on the daily timeframe, highlighting key levels of resistance, support, and potential price movement. It indicates a bearish rejection from a supply zone, which suggests that BTC may experience further downside pressure.
Key Components of the Chart:
📌 1. All-Time High (ATH) + Resistance Zone (~$110,000 - $115,000)
This is the highest price level Bitcoin has ever reached on this chart.
It acts as a strong resistance zone, meaning sellers are likely to step in if the price approaches this level again.
📌 2. Supply Zone (~$88,000 - $90,000)
The supply zone is an area where selling pressure is high.
BTC attempted to break above this zone but got rejected, leading to a sharp decline.
This rejection confirms that bears are in control, pushing the price downward.
📌 3. Stop Loss (~$95,629)
This level represents the point where a bearish trade would be invalidated.
If BTC breaks above this level, it could indicate a shift in momentum toward bullish territory.
📌 4. Current Price Action (~$83,444)
BTC is currently trading below the supply zone, showing weakness.
The recent lower high formation suggests a continuation of the downtrend.
📌 5. Take Profit (TP) Level (~$65,969)
This is the target level for a potential bearish move.
The $65,969 level has acted as major support in the past, meaning buyers may step in here.
If BTC reaches this level, it could either bounce back up or break lower, leading to further downside movement.
📌 6. Major Support Level (~$45,000 - $50,000)
If BTC breaks below the $65,969 support, the next major support zone is around $45,000 - $50,000.
This area is historically significant and could provide a strong buying opportunity.
Trade Plan & Strategy:
🔴 Bearish Bias:
The rejection from the supply zone signals a continuation of the downtrend.
A short position can be considered if BTC fails to break above the supply zone again.
🎯 Trade Setup:
Entry: Around $85,000 - $88,000 (if BTC retests the supply zone and gets rejected again).
Stop Loss: Above $95,629 to protect against an unexpected bullish breakout.
Take Profit (TP): Around $65,969, targeting the next major support level.
Conclusion:
BTC is showing signs of a bearish continuation, with strong resistance at the supply zone.
A potential move toward $65,969 is likely if selling pressure continues.
If BTC breaks below this key level, a further decline toward $45,000 - $50,000 could happen.
⚠️ Disclaimer : This is not financial advice. Always conduct your own research before making trading decisions. 🚀📉
Chartanalysis

Analysis of USD/JPY Chart**Analysis of USD/JPY Chart**
**Chart Pattern & Market Structure**
- The chart identifies a **triangle chart pattern**, which often signals a potential breakout.
- Price has been consolidating within this structure and recently **broke above the pattern**, indicating possible bullish momentum.
**Key Technical Levels**
- **Resistance Zone (~149.8 - 150.0):** Price is testing this area, which previously acted as a supply zone. A breakout above could open doors for higher levels.
- **Support Zone (~148.5 - 149.0):** If price retraces, this area could act as a strong demand zone.
- **EMA50 (~149.2):** Currently acting as a dynamic support, maintaining the bullish structure.
**Potential Price Movement**
- The chart suggests a possible pullback toward **support** before continuing higher toward the next resistance zone (~151.5 - 152.0).
- If price breaks below the **support zone**, the uptrend could weaken, leading to a bearish scenario.
**Trading Considerations**
- A **successful breakout above resistance** (~150) could push price towards **152.0**.
- A **rejection at resistance** might bring price back to **support (~148.5 - 149.0)** before another bullish attempt.
- Traders should watch for **confirmation signals** (candlestick patterns, volume spikes) before entering trades.

Hedera Hashgraph: Balancing ActHedera Hashgraph’s HBAR continues to hover just above the $0.17 support level, moving within an increasingly narrow sideways range. If the price breaks sustainably below this red line (38% probable), the green corrective wave alt. will establish a new low. Our primary assumption, however, remains that the green wave was already completed with the late February low, at the upper boundary of our now grayed-out Target Zone. If this assumption holds and buying pressure returns soon, HBAR should rally above the $0.39 resistance during the green impulse wave .

BTC/USDT chart"I don't know what’s going to happen, but we’re in a range on the 1-hour timeframe, and if you want, you can trade. Personally, I’m waiting for comments from Mr. Powell to make a better decision."

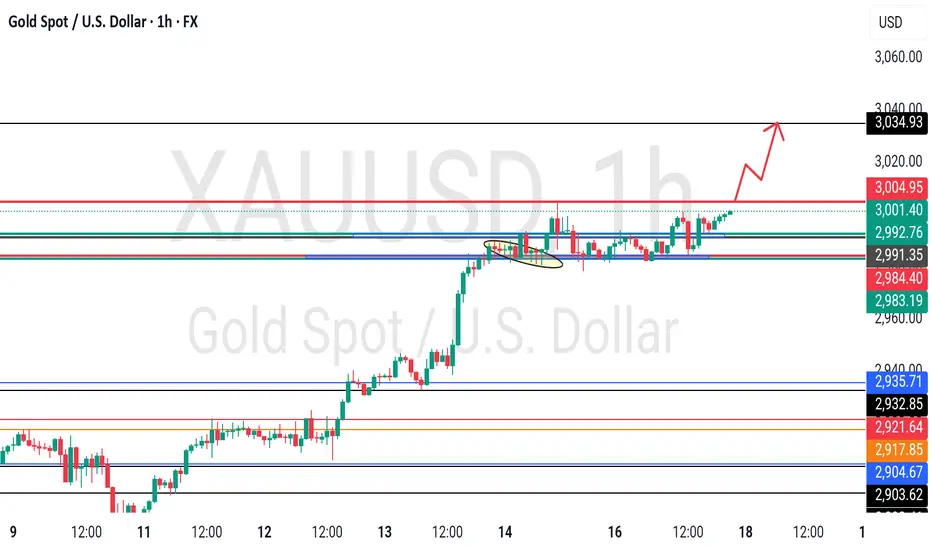
GOLD - near to his breakout level? What's next??#GOLD... well guys market bounce perfectly from our today supporting area, that was 2983 84
Now we have upside breakout level, that is 3005 around.
Keep close that level because above that we can expect further rise towards next resistance areas.
Good luck
Trade wisely
Gold (XAU/USD) Chart Analysis**Gold (XAU/USD) Chart Analysis**
📌 **Current Price:** $3,014.41
📊 **Chart Pattern:** Uptrend with Higher Highs & Higher Lows
🎯 **Short-Term Target:** $3,020
**🔹 Key Levels:**
- **Support:**
- $3,012 (7 EMA)
- $3,008 (21 EMA)
- $3,003 (50 EMA)
- **Resistance:**
- $3,015 (Immediate)
- $3,020 (Psychological Level)
**✅ Trade Setup (Scalping Strategy):**
- **Entry:** On retracement near $3,012 (7 EMA)
- **Stop-Loss:** Below $3,008
- **Take Profit:** $3,020
📢 **Gold is in a strong uptrend. Bullish momentum remains intact unless price drops below $3,008!** 🚀

AUD/JPY Chart AnalysisAUD/JPY Chart Analysis
**Key Patterns Identified:**
1. **Rectangle Pattern (Range-bound Market)**
- The price traded within a horizontal range, forming a consolidation zone.
- Two clear support touches at the bottom of the range (labeled as Bottom 1 and Bottom 2).
- The price respected both support and resistance levels multiple times before breaking out.
2. **Double Bottom Formation**
- A classic reversal pattern, signaling potential bullish momentum.
- Bottom 1 and Bottom 2 indicate strong support, where buyers stepped in.
- The breakout above the rectangle confirms the pattern, suggesting further upside potential.
**Breakout Confirmation:**
- The price successfully **broke out** above the rectangle's resistance.
- Volume increased during the breakout, supporting bullish momentum.
- Moving Averages (EMA 7, 21, and 50) are aligned bullishly, confirming the uptrend.
**Target Projection:**
- The expected target is measured based on the rectangle’s height.
- The breakout suggests a potential move towards **97.00** as the next resistance zone.
**Key Levels to Watch:**
- **Support:** 94.50 (previous range support), 95.00 (psychological level).
- **Resistance:** 96.00 (current price zone), 97.00 (breakout target).
**Conclusion:**
- **Bullish Bias:** Price action and technical indicators favor more upside.
- **Watch for Retests:** A pullback to the breakout zone (around 95.00) could offer buying opportunities.
- **Risk Management:** If price re-enters the rectangle, the breakout may fail, requiring reassessment.

WELCOME 3000 GOLD WILL GOLD MARK NEW ATH AGAIN!🔥 Attention Traders! 🔥
XAUUSD is heating up! Here's the latest analysis:
🔻 Bearish Setup: Watch for a potential decline if the price breaks below 2979-3003. Key targets: 2960 & 2945.
🔺 Bullish Setup: A breakout above 2911 could signal buying opportunities! Keep an eye on these targets: 3015 & 3030.
📉 Risk Management: Always protect your capital by setting stop-losses and adjusting position sizes based on your risk tolerance. Trading with discipline is key to success!
📊 Stay Engaged: Share your thoughts and strategies as we navigate through this volatile market. Let’s aim for new highs while managing risk effectively! 💵🚀

GBP/USD Chart Analysis: (1H Timeframe)**Chart Analysis: GBP/USD (1H Timeframe)**
**1. Chart Pattern - Rising Wedge 📉**
- The price has formed a **rising wedge**, a bearish reversal pattern.
- A rising wedge occurs when price makes higher highs and higher lows but within a narrowing range, suggesting weakening bullish momentum.
- The price has now broken out of the wedge, signaling a potential downward move.
**2. Key Levels & Targets 🎯**
- **Current Price:** Around **1.29720**
- **EMA Levels:**
- **7 EMA:** 1.29767 (Short-term trend indicator)
- **21 EMA:** 1.29748
- **50 EMA:** 1.29629 (More reliable trend indicator)
- **Bearish Breakdown Targets:**
- **First Target (Red Label):** Around **1.2800**, aligning with previous support levels.
- **Final Target (Green Label):** Around **1.2650**, suggesting a larger move downward if selling pressure continues.
**3. Confirmation of Downtrend? 🔻**
- The breakdown below the rising wedge suggests a potential **downtrend continuation**.
- The **break below 1.2900** would likely confirm a stronger bearish move.
- Volume is increasing on the move down, indicating strong selling interest.
*Possible Trade Setups 📊**
1. **Bearish Scenario:**
- A short position can be considered if price continues breaking below key EMAs and previous support.
- **Entry:** Below 1.2960
- **Stop Loss:** Above 1.3000
- **Take Profit:** 1.2800 (first target) or 1.2650 (final target).
2. **Bullish Reversal Possibility:**
- If price **reclaims the wedge** and breaks above 1.3000, it could invalidate the bearish pattern.
**Conclusion:**
- The **rising wedge breakdown** suggests bearish momentum.
- A move below **1.2900** would confirm further downside.
- **Watch for volume confirmation** before entering a trade.

Reversal Trade - Godfrey PhilipGodfrey Philip
This stock is forming good Weekly Tighter Close. Let's wait & check out how it behaves this week.
17 Feb Week Rejection is alarming.
No follow through to that rejection in last week. This week is defending last weekly low so far.
Highly Risky Trade, Rs.600, I am targeting 10% i.e. 24 Feb 25 Weekly High.
This is not a Buy Reco, Do your own Diligence. This is purely for educational purpose.

Zscaler: BalancedZS has seen buyers and sellers largely balancing each other recently, preventing any significant moves in either direction. As a result, we continue to place the stock in a corrective rally as part of the magenta wave , with its high anticipated above the $259.61 resistance. However, if the price falls below the $153.70 support, the ongoing corrective structure will extend further, with the turquoise wave alt.X establishing a new low. This alternative scenario carries a 35% probability.

Silver Climbs on Weak Inflation DataSilver surged toward $33.90 an ounce, its highest since late October with ongoing trade tensions and rising Fed rate cut expectations after weak U.S. inflation data.
Trump threatened 200% tariffs on European wines in response to the EU’s 50% tariff on U.S. whiskey, further heightening market uncertainty. U.S. producer prices remained flat in February in the meantime, consumer inflation rose just 0.2%, and jobless claims declined, signaling a resilient labor market.
If silver breaks above $34.00, the next resistance levels are $34.85 and $35.00. On the downside, support is at $33.80, with further levels at $33.15 and $32.75 if selling pressure increases.

Gold's Record Week: $2,980 MilestoneGold surged above $2,980 per ounce, hitting a record and heading for a 2% weekly gain as risk aversion and Fed rate cut expectations grew. Trump escalated trade tensions, threatening a 200% tariff on European wines after the EU's 50% tax on U.S. whiskey.
February's PPI and CPI data showed easing inflation, increasing Fed flexibility for rate cuts, and raising gold's appeal. Strong ETF inflows and continued central bank purchases, with China extending its buying for a fourth month, further supported prices.
Key resistance stands at 3000, with further levels at 3045 and 3100. Support is at 2980, followed by 2916 and 2885.

Euro Climbs on German Deal, Awaits Fitch RatingThe euro climbed toward $1.09, nearing its highest since early November, as Germany agreed on debt reform and increased spending. Chancellor-elect Friedrich Merz secured a deal with the Green and Social Democrat parties ahead of next week’s parliamentary vote.
Markets await Fitch’s rating decision on France, which is due after Friday’s close. Meanwhile, trade tensions rose as Trump threatened a 200% tariff on European wines in response to the EU’s tax on American whiskey. On geopolitics, Trump called his talks with Putin on Ukraine “very good,” expressing optimism for a resolution.
Key resistance is at 1.0950, followed by 1.1000 and 1.1050. Support stands at 1.0800, with further levels at 1.0730 and 1.0650.
Yen Gains on Rate Hike ExpectationsThe Japanese yen traded around 148.6 per dollar on Monday, near a five-month high, as expectations for BOJ rate hikes remained strong. However, the central bank is expected to keep its policy unchanged in this week’s meeting.
Major Japanese firms approved wage hikes for the third year, boosting consumer spending and inflation, and potentially allowing future rate increases. The yen also gained from dollar weakness as US economic concerns and trade policies pushed investors toward safe-haven currencies like the yen and Swiss franc.
Key resistance is at 149.20, with further levels at 152.00 and 154.90. Support stands at 147.00, followed by 145.80 and 143.00.

Is Shell Ready to Break Through Key Resistance on Its 5th Try..?🚨 Shell's 5th Attempt to Break Resistance at 0.3380 🚨
Shell is currently testing the key resistance level of 0.3380 for the 5th time. 🔥 Here's what to watch for:
📈 Strategy:
Wait for a breakout on the 4-hour timeframe. If Shell sustains above **0.3380**, we could enter a long position on the retest.
🎯 Targets:
First target: 0.4000
Second target: 0.4500
Keep an eye on this level—could be a big move ahead! 🚀

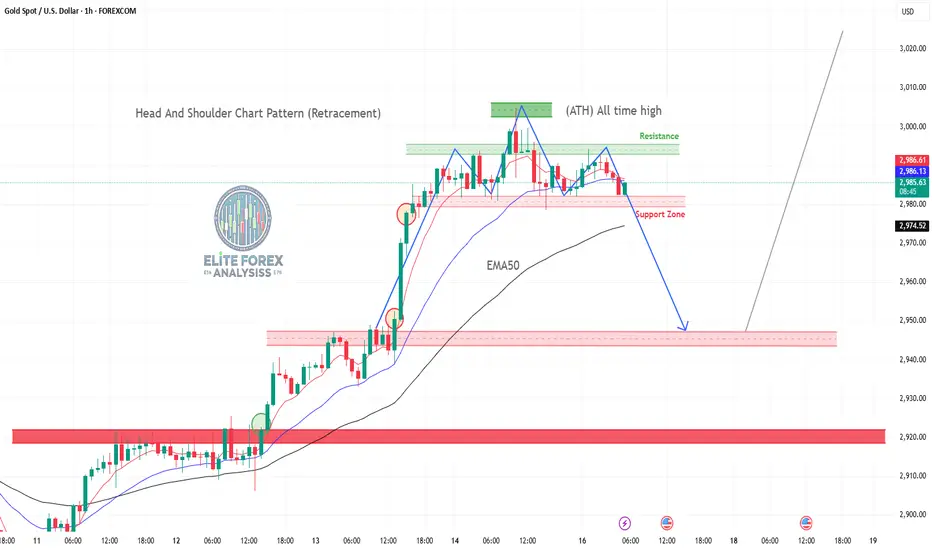
Gold (XAU/USD) – Head & Shoulders Pattern Analysis**📈 Gold (XAU/USD) – Head & Shoulders Pattern Analysis**
This chart represents the **Gold Spot (XAU/USD) 1-hour timeframe** and shows a potential **Head and Shoulders (H&S) pattern**, which is a bearish reversal signal. Let's break it down:
**🛠 Key Elements of the Chart:**
1. **📉 Head & Shoulders Formation (Bearish Sign)**
- **Left Shoulder**: Price makes a peak, then retraces.
- **Head (ATH – All-Time High at ~$3,005)**: The highest point before pulling back.
- **Right Shoulder**: Another peak, lower than the head, indicating weakness.
- **Neckline (Support Zone)**: Marked in red. A breakdown below this level confirms the pattern.
2. **📊 Exponential Moving Averages (EMA)**
- **EMA50 (Black Line)**: Indicates medium-term trend support.
- Price is testing this moving average, which acts as a dynamic support level.
3. **🔴 Resistance & Support Zones**
- **Resistance (Green Box near ATH)**: Selling pressure is strong at these levels.
- **Support (Red Zones)**: Price could test these areas if the H&S pattern plays out.
4. **📉 Bearish Projection (Blue Arrow)**
- If price **breaks below the neckline (~$2,974)**, it could drop to the next major support at **$2,940–$2,920**.
5. **📈 Bullish Scenario (Gray Arrow)**
- If price **rebounds from EMA50 and the support zone**, it could attempt another rally towards **$3,005 and beyond**.
### **📌 Trading Implications:**
✅ **Bearish Breakdown:**
- Sell below **$2,974** with targets at **$2,950–$2,920**.
- Confirmation comes from increased volume on breakdown.
✅ **Bullish Reversal:**
- If price holds above EMA50 and **breaks $2,990**, it could **retest ATH at $3,005+**.
- Strong buying interest could push gold to **$3,020–$3,050** in a risk-off environment.
### **🔎 Conclusion:**
📊 **Gold is at a critical level**—watch for a **breakout or breakdown** confirmation. A confirmed **H&S breakdown** could signal a retracement, while a **bounce above EMA50** keeps the **bullish trend intact**. 🚀💰 #XAUUSD
GBPJPY Trade Analysis**GBP/JPY 15-minute chart**
**Trade Analysis & Idea:**
📉 **Previous Downtrend**: The pair experienced a strong drop before finding support around **191.400**.
📈 **Current Recovery**: Price is now rebounding and trading above short-term moving averages (blue & red EMA).
🔄 **Resistance Zone**: The **192.000 - 192.200** area may act as resistance for further upside.
### **Potential Trade Setups:**
1️⃣ **Bullish Continuation**:
- If price **breaks & closes above 192.000**, we could see further upside towards **192.400 - 192.600**.
- A strong candle close above resistance would confirm bullish momentum.
2️⃣ **Rejection & Pullback**:
- If price struggles to hold above 192.000, a pullback toward **191.700 - 191.500** is possible.
- Look for **bearish candlestick patterns** (e.g., rejection wicks, engulfing candles) to confirm a short opportunity.
### **Risk Management:**
✅ Secure partial profits at key levels.
✅ Use **tight stop-loss** below **191.700** for longs or above **192.200** for shorts.

BTC/USDT"I think the trend is upward, and this is a fake breakout. We'll likely return inside the channel and continue the upward movement. What's your opinion?"

ETH/USDT – Ascending channel. Breakdown below support?Ethereum - is a smart contract platform that allows developers to build decentralized applications (DApps) on its blockchain.
CoinMarketCap : #2
↗️ Ethereum is moving within an ascending channel, and the bullish trend remains intact.
Inside the channel, there are two triangles.
The first triangle, with a base of 88%, has played out—its third wave broke through the triangle.
Liquidity grabs and shakeouts before the growth in the inner channel zones are marked with yellow circles.
Currently, we see a mirrored situation with a new triangle, this time with a 156% base. However, if this pattern plays out, it will break the ascending channel.
At the moment, the price has been dragged below the channel support, and there is a lot of negative sentiment in the news and opinions. Few believe in an upward move, and many have been liquidated. To me, this looks like a strong trigger.
⤵️The bearish scenario implies a -61% drop. (A less likely scenario.)
I've marked everything on the chart—consider this in your trading strategy. Remember, there's a lot of negativity around Ethereum, just like with all altcoins...
I also believe that on the monthly chart, it will end up being just a wick of the candle.

SCRT/USDT – Testing support. Will the scenario repeat?Secret - is a privacy-focused blockchain built on Cosmos. Its smart contracts, called Secret Contracts, enable DApps to utilize private data on Secret, similar to how smart contracts function on other blockchains. However, Secret Contracts transmit encrypted data through encrypted channels without exposing it. This is made possible by encrypting the contract state during execution.
All the charts are cropped, so I found a more complete historical chart of the coin and overlaid it to the left.
This coin has dropped by approximately -98% since its distribution. To put it in perspective, if you had invested $1,000 , you would now have only $20 …
We observe a formation resembling an internal channel (120%) and an external channel (280%) . The price is once again being squeezed near support at the lowest price zones available on Binance (where the main liquidity is).
My previous trading idea played out successfully in three zones .
Profit from the time of publication to the squeeze: +270%.
The price is moving within a descending channel , but at the same time, the sideways range I previously anticipated is also forming. Here, it’s crucial to adapt to the situation.
Right now, the entire market is experiencing a pullback toward support levels .
I've marked potential final liquidity grab zones on the chart—consider these in your trading strategy.
Also, I want to highlight how negative the news sentiment is at the moment. No one believes in a rally. But that's exactly how it always looks in similar price reversal zones !)))

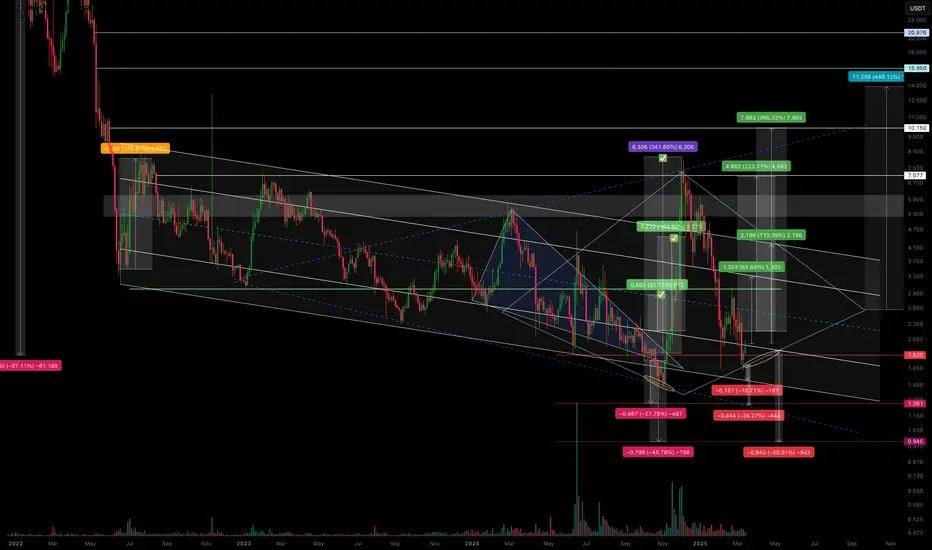
CVX/USDT – Is the scenario repeating? Continuing to work.The previous trading idea has played out with 3 out of 4 marked zones reached.
We saw a false breakout from the descending channel, followed by a pullback in line with the overall market—returning to the channel’s support zone.
I’ve noticed a potential formation of either a diamond pattern or an expanding triangle, but we’ll see how it plays out further.
Regarding declines and support zones:
-10.71% drop to the support of the descending channel.
-26.27% drop to the anticipated support of the expanding triangle.
-50% drop, likely as a squeeze under extremely negative news.
Regarding growth and resistance zones:
+65% rise to the resistance of the internal channel.
+110% rise to the resistance of the external channel (and if a diamond pattern forms, then its boundary).
+246% rise as a second attempt to break out of the descending channel.
+440% rise as a potential realization of diamond pattern pricing (if it forms).
All of this should be factored into your trading strategy, even the less likely scenarios.
I'll share the execution of the previous trading idea in my TG. I've also marked it on the chart.
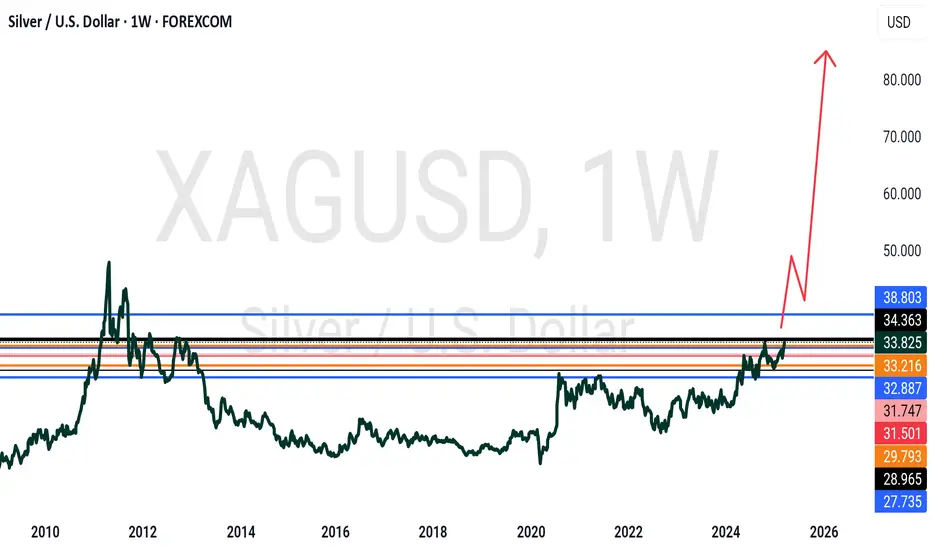
SILVER- very aggressive move expected, what's next??#SILVER... Market just broke his current resistance area, that was actually 32.40
So keep close it and if market hold 32.40 then it can leads you towards 3 digits.
Yes it can be 100 plus
Good luck
trade wisely