AXS/USDT
AXS has been trading within a falling wedge pattern—a classic bullish reversal setup. Recently, the price broke above the upper resistance line of the wedge, indicating a potential trend reversal.
This breakout is supported by a long-term downtrend losing momentum, and a breakout confirmation through a retest may be forming. If the breakout holds, we could see a bullish move toward the next key resistance zone around 6.50 USDT, which is our primary target.
📌 Setup Summary:
Pattern: Falling Wedge (Bullish)
Breakout: Confirmed
Target: 6.50 USDT (TP)
Risk Management: Watch for price action near the retest zone
This setup aligns with our smart bot strategy which identifies breakout patterns and entry points automatically. Stay tuned for updates!
Chartanalysis

YFI/USDTIn this analysis, I’m tracking the recent downtrend on the US30 daily chart. Based on the current pattern and technical indicators (like RSI divergence and a bounce off a key support zone), I expect a potential reversal or at least a short-term correction. Entry signal is marked based on my Smart Bot strategy.

Equity Research Update – Paras Defence and Space Technologies CMP: ₹1,143 | Upside Potential: High
Paras Defence has broken out of a strong resistance zone (~₹1,120–₹1,160), confirmed by significant volume and bullish momentum. The RSI shows strength above 70, indicating buyer dominance. Historical resistance, marked by previous rejections, may now act as strong support. If sustained, this breakout could lead to a fresh uptrend. Investors may consider accumulating on dips with a medium-term target of ₹1,300–₹1,350, keeping a stop-loss below ₹1,080.
Recommendation: BUY on Breakout Confirmation
For Education Purpose only

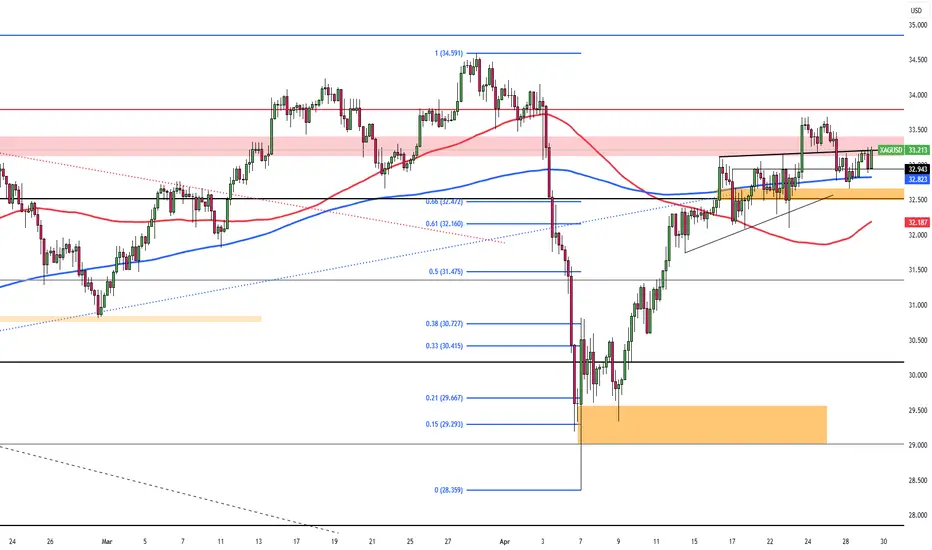
Silver Falls to $33.00 on Trade OptimismSilver (XAG/USD) slipped to around $33.00 on Tuesday as safe-haven demand eased amid improving U.S.-China trade sentiment and a stronger U.S. dollar. Optimism grew after Trump suggested tariff rollbacks and China granted exemptions. Treasury Secretary Bessent confirmed ongoing talks and positive proposals. Markets now await key US data, Q1 GDP, PCE inflation, and Nonfarm Payrolls for clues on Fed policy.
Technically, the first resistance level is located at 33.80. In case of its breach 34.20 and 34.85 could be monitored respectively. On the downside, first support is at 32.50. 31.40 and 30.20 would become the next support levels if this level is passed.
Gold Retreats as Investors Eye Key Economic DataGold fell below $3,330 per ounce on Tuesday as investors monitored tariff talks and awaited key economic data. Treasury Secretary Scott Bessent said many top U.S. trading partners made "very good" tariff proposals and noted China’s tariff exemptions signal de-escalation efforts. He stressed it is now up to China to act. A modest rebound in the U.S. dollar also pressured gold. Markets are focused on upcoming reports, including Q1 GDP, March PCE inflation, and April nonfarm payrolls, for clues on the economy and Fed policy.
Key resistance is at $3365, followed by $3,405 and $3,500. Support stands at $3250, then $3165 and $3050.

Pound Pressured by BOE Cut ExpectationsGBP/USD dipped to approximately 1.3425 during early Asian trading on Tuesday, as a slight rebound in the U.S. dollar put pressure on the pair. The dollar was supported by easing U.S.-China trade tensions, following China’s decision to exempt certain U.S. imports from tariffs, despite its denial of ongoing negotiations.
Meanwhile, expectations of a 25 basis point rate cut by the Bank of England in May continue to weigh on the pound. Markets are now focused on an upcoming speech by BoE Deputy Governor Dave Ramsden, with any dovish remarks likely to add further downside pressure on the GBP.
If GBP/USD breaks above 1.3430, resistance levels are at 1.3500 and 1.3550. Support is at 1.3200, followed by 1.3050 and 1.2960.

Euro Slips as ECB Rate Cut Bets GrowThe EUR/USD dipped to around 1.1415 in early Asian trading Tuesday as the Euro weakened on rising expectations of an ECB rate cut in June. Reuters cited growing confidence among policymakers, with Olli Rehn suggesting rates could fall below neutral.
Investors are also watching US-China trade developments ahead of Friday’s Nonfarm Payrolls. President Trump claimed progress, but Beijing denied active talks. Treasury Secretary Bessent confirmed recent contact but said China must act. Trade tensions continue to pressure the dollar, potentially supporting the Euro.
Key resistance is at 1.1460, followed by 1.1580 and 1.1680. Support lies at 1.1260, then 1.1200 and 1.1150.

ICP/USDT Breakout Potential: Descending Trendline Under PressureThis is the 4-hour chart for ICP/USDT, and it’s showing some interesting action. Over the past few months, ICP has been stuck in a downtrend with a clear descending trendline acting as resistance. However, each time it formed a falling wedge pattern, we saw a breakout to the upside, followed by short rallies.
Right now, the price is hovering around $5.10 and seems to be testing that same long-term trendline again. If it breaks above this level with strong volume, it could be the start of another bullish move. Definitely a chart to keep an eye on for a potential breakout in the coming days.

GOLD bulls ready to break higherHere we are looking at the 240/4hr chart. I am seeing price make a push higher from a previously well respected support zone and a possible triangle pattern forming after pushing down from previous highs.
Currently we're waiting for bears to push the price down either to the bottom of the triangle pattern, or breaking out to the highs for entries higher.
Plan for bears is to sell back into the triangle and in current resistance.
Plan here for bulls is to look for entries at a better price breaking this pattern, or into the highs.

PayPal: Slight Recovery!In recent days, PYPL shares showed a significant recovery, raising the central question of whether the price will indeed dive into deeper territories once more, as assumed in our primary scenario. In this case, we expect the stock to fall below the support at $50.18. There, the stock should form the final low of the overarching beige wave II, thus laying the foundation for a sustainable trend reversal. Alternatively, the overarching low may have already been settled at the beginning of the month. In this 45% likely scenario, the recovery would imminently gain momentum, allowing PYPL to sustainably rise above the resistance levels at $78.86 and $94.97.

$EBAY $80 EOYA non factor amongst tariff rhetoric. I think the idea of US consumers (even internationally) buying and reselling has never been higher. I think a lot of consumers will start to look for used goods more than ever. I'm eyeing $70 calls for earnings this upcoming week (first week of May 2025) and if it has any pull back I will load the boat for $80 call leaps. I like the structure it's held at this $55-$65 range. I expect new highs on this name maybe earnings can give it a jolt. All the lines you see are 20, 50, 200 SMA and EMA. I could be wrong on earnings as this name tends to dip from earnings even posting beats but that's the gamble of earnings but LONG TERM this name is a good buy. Charts are Monthly and Daily.
WSL.

Ethereum Up 30% — But Is This the Start of a Trend Reversal..?Ethereum Up 30% — But Is This the Start of a Trend Reversal..?
Ethereum has seen a notable bounce this month, climbing approximately 30% from its local bottom of $1,400 to its current level around $1,800. While this rally might appear promising at first glance, a deeper look at the daily timeframe reveals a more cautious picture.
Despite the recent price surge, Ethereum remains technically in a **downtrend**. A well-respected downtrend continues to hold as resistance, and ETH is currently **retesting this trendline**. This point of contact now sets the stage for two potential scenarios:
**Scenario 1: Rejection from the Trendline**
If Ethereum fails to break above the trendline, it’s likely to face **rejection**, which could send the price back toward the $1,400 level. A revisit to this support zone would form a **potential double bottom**, a classic reversal pattern. If that plays out, we could then start to look for signs of a genuine trend reversal.
**Scenario 2: Breakout Above the Trendline**
On the other hand, if ETH manages to **break through the trendline**, that alone shouldn't be a green light to go long just yet. There’s a significant resistance level sitting around **$2,100**, which has previously acted as a ceiling for price action. A true breakout would require Ethereum not only to cross this level but also to **sustain above it for 2–3 days**. Only then could a long position be considered relatively safer, with upside targets extending to **$2,800** and even **$4,000**.
**Final Thoughts**
While the recent rally is encouraging, it's essential to remain cautious. The downtrend isn't officially over until key technical levels are cleared and held. Until Ethereum breaks above both the downtrend and the $2,100 resistance zone — and proves its strength with sustained movement — the **best strategy may be to sit on the sidelines** and let the market play out.
Patience often pays in crypto — and right now, **watching closely** could be the smartest move.

Solana: More RoomSolana’s countermovement of the green wave 4 has some more room on the upside. Once the wave-4-top is established (below the resistance at $192.33), we primarily anticipate a wave 5 sell-off down into the blue Target Zone on the downside (coordinates: $56.56 – $29.87). In this range, the wave (ii) corrective movement should conclude, and the altcoin should start the next sustainable upward impulse. However, if the price rises above the mentioned $192.33 mark during the current upward movement (36% likely), this will suggest that the low has already formed via wave alt.(ii) in blue.

Silver Holds Ground on Mixed Trade SignalsSilver is trading around $33.50 on Friday morning, continuing to show greater sensitivity to macroeconomic shifts and trade news due to its dual role as both a precious and industrial metal. Recent price movements were shaped by mixed signals in U.S.-China trade relations. Although the Trump administration reportedly considered tariff reductions, Treasury Secretary Scott Bessent clarified that no formal proposals have been made and negotiations have not yet begun.
Technically, silver faces initial resistance at $33.80, with further levels at $34.20 and $34.85 if the upward move continues. On the downside, immediate support is seen at $33.15, followed by $31.40 and $30.20 if further weakness occurs.

Investors Turn to Gold as Tariff Tensions PersistGold is trading near $3,330 on Friday and is on track to record its third consecutive weekly gain. The increase in prices is primarily driven by heightened safe-haven demand, as uncertainty surrounding a potential U.S.-China trade agreement continues to weigh on investor sentiment. Although Chinese officials have publicly denied the continuation of negotiations, President Trump stated that discussions are still in progress. Adding to the cautious outlook, U.S. Treasury Secretary Scott Bessent emphasized that any progress would depend on the reduction of existing tariffs, reinforcing market skepticism about a near-term resolution.
Key resistance is at $3410, followed by $3,500 and $3,600. Support stands at $3315, then $3290 and $3250.

Sterling Keeps Flat Amid Trade WatchThe British pound held steady near 1.3290 on Friday morning, maintaining levels seen in the previous session. The currency remained flat in recent days, supported by optimistic comments from Donald Trump and largely neutral PMI data. Upcoming economic releases and developments in the US-China trade dispute are expected to play a key role in shaping the pair’s direction next week.
If GBP/USD breaks above 1.3430, resistance levels are at 1.3500 and 1.3550. Support is at 1.3200, followed by 1.3050 and 1.2960.

XAUUSD Risky small LONG trade ideiaXAUUSD Risky small Bullish trade ideia.
If you are more a agressive trader you can take this one. I rather wait to see it filling the gap first. Maybe I will have my trade tomorrow. But good luck if if prefer to take it.

Curaleaf: Target Zone in SightIn small steps, the CURA stock continues to move upward – however, we primarily interpret these movements as the internal structure of the downward wave v in orange. Therefore, the final low of this wave should soon be marked within the orange Long Target Zone between C$0.82 and C$0.37. Upon completion of wave v, the overarching wave II in beige should also end. Once this foundation is laid, a long-term upward movement should begin – initially driven by wave 1 in turquoise, which should carry the price above the resistance at C$4.93.

Dow Inc.: Low in PlaceDow Inc. managed to hold and respond well within our active Target Zone(s) between $35.93 and $22.83 at the relevant Fibonacci levels. We currently assume that wave (II) in blue has been successfully completed, which leads us to anticipate a rise above the two indicated resistance levels ($55.67 and $71.86). Our zones remain active and could still be used for entering long positions. However, it should be noted that the price range could be tested further, and a completely new low is even possible under our alternative scenario: this wave count outlines a significantly stronger setback with the blue wave alt.(II), which would mean breaking through our dark green-blue Target Zones (probability: 35%).


Miniso: Holding SteadyMNSO showed little volatility last week, recording only minor single-digit percentage pullbacks. Still, we expect further downside ahead. As the decline continues, the stock should reach the green Target Zone between $9.90 and $7.33. Within that range, we anticipate the low of the green wave . This bottom should then set the stage for a new upward move, which should eventually break above the resistance at $35.22 via a turquoise five-wave structure.


Ripple: Target Zone Ahead!Ripple’s XRP remains on track to reach our magenta Target Zone between $1.03 and $0.38, even though the price has recently settled into another consolidation phase. Under our primary scenario, we expect the bottom of the magenta wave (2) to form within this range. Once that low is confirmed, fresh upward momentum should unfold during the following impulse wave (3), which has the potential to push XRP above the resistance at $3.39 and toward new all-time highs. However, if XRP breaks out to the upside before establishing the projected low within our zone, this zone will be considered void. We currently assign a 38% probability to this alternative scenario.
