#BTC Dominance Update – Key Levels in Play!🚀 Hey Traders! 👋
If you’re finding value in this analysis, smash that 👍 and hit Follow for high-accuracy trade setups that actually deliver! 💹🔥
Bitcoin dominance ( CRYPTOCAP:BTC.D ) is trading inside a beautifully defined rising channel on the 4H chart.
📈 What’s unfolding?
✔ Strong support holds at the lower channel line (marked by green arrows)
✔ Bounce potential toward the upper channel resistance (~65%)
✔ Expect possible rejection there, followed by another retest of support
💥 Why this matters:
✅ BTC dominance drives altcoin sentiment
✅ Rising dominance → pressure on altcoins
✅ Watch for a breakdown below support → potential altcoin relief rally
⚙ Key Takeaway:
Monitor this channel carefully. If dominance breaks below support, alts could gain momentum. If it bounces, BTC will continue to lead.
💬 Drop your thoughts in the comments — are you betting on BTC or alts next? 🚀👇
Chart Patterns

USDJPY Analysis Today: Technical and Order Flow !In this video I will be sharing my USDJPY analysis today, by providing my complete technical and order flow analysis, so you can watch it to possibly improve your forex trading skillset. The video is structured in 3 parts, first I will be performing my complete technical analysis, then I will be moving to the COT data analysis, so how the big payers in market are moving their orders, and to do this I will be using my customized proprietary software and then I will be putting together these two different types of analysis.

GOLD DAILY CHART ROUTE MAP UPDATEHey Everyone,
Here’s the latest update on our daily chart idea, it’s been playing out perfectly!
The daily chart is unfolding as projected, with price action respecting the structure of the Goldturn ascending channel. A breakout above the channel was confirmed by the EMA5 crossing and closing above the upper boundary. This move extended to test the 3433 Goldturn axis level, where price met resistance. Notably, EMA5 failed to sustain a close above 3433 Goldturn level, confirming a lack of bullish momentum and validating a rejection. Price has since reversed, re-entering the channel.
Below, broader support is identified around 3104, which aligns with the channel’s half line. While this level may not be reached immediately, the current price range between 3297 and 3104 is significant. We may observe continued consolidation within this zone, with the half line gradually ascending. This dynamic could result in price interacting with the half line earlier than a direct move to 3104, providing potential bounce opportunities best monitored through lower timeframes for refined entries and validations.
This is the beauty of our Goldturn channels, drawn using weighted averages instead of pure price action. This unique approach helps us clearly identify fake-outs and real breakouts, cutting out much of the noise that usually confuses traders.
Moving forward, we’ll focus on smaller timeframes (1H and 4H) to buy dips off the weighted Goldturns, aiming for clean 30–40 pip moves. Ranging markets are perfect for this style, allowing us to capitalize on quick moves without getting caught in the chop of larger swings.
Thank you all again for your continued likes, comments, and follows, we truly appreciate your support!
Mr Gold
GoldViewFX

Important structure reached FridayThe trendline structure from the top was reached FRiday and I believe we may rally back to it at open but fail. There are a LOT of traders calling for a test of the 200 ma again, but I'm not sure it will actually occur. Vix also did not fill it's gap on Friday which could be interpreted as bullish for the VIX

TeslaFor the first time in Tesla's history, it broke monthly support back in Dec 22. Price came back to mitigate the supply level...and if I am right...just maybe...Tesla is within a distribution range...

xauusd:sell@3315-3320After the opening of the gold market today, it started to rise. After breaking through 3270, the market has been in an upward trend. Currently, it has reached the resistance area of 3310-3320. You can start short selling when it reaches this area.
All the signals I sent have been profitable, and I will continue to send accurate signals.
Today's trading strategy for gold:
xauusd sell@3315-3320
tp:3280-3270

Bearish Look for potential Reversal bearish candlestick formation upon the retest of daily supply zone

GOLD WEEKLY CHART MID/LONG TERM ROUTE MAPHey Everyone,
Quick update on our weekly chart idea, it's been playing out beautifully, helping us track the move down and catch the move back up.
The weekly chart structure is unfolding in line with prior analysis. Price action reached the upper boundary of the ascending Goldturn channel and temporarily broke above it; however, the EMA5 remained confined within the channel, validating the upper trendline as dynamic resistance.
A sustained EMA5 breakout above the channel would have confirmed a potential continuation of the breakout. Currently, price is consolidating within the Goldturn channel, with the 3189 level acting as immediate support. The channel half line of the channel may serve as a stronger swing support area, though price may not retest this level immediately. As the channel continues its upward trajectory, the midline will also rise, potentially aligning with price in future upward movements.
This is the beauty of our Goldturn channels, drawn using weighted averages instead of pure price action. This unique approach helps us clearly identify fake-outs and real breakouts, cutting out much of the noise that usually confuses traders.
Moving forward, we’ll focus on smaller timeframes (1H and 4H) to buy dips off the weighted Goldturns, aiming for clean 30–40 pip moves. Ranging markets are perfect for this style, allowing us to capitalize on quick moves without getting caught in the chop of larger swings.
Thanks again for all your likes, comments, and follows, we really appreciate the support!
Mr Gold
GoldViewFX

EUR/CAD Breakout Done , Ready For 250 Pips ?Here is my EUR/CAD Chart and i have a short entry from the top which is gave me 200 pips , but now breakout Done and i want to add another entry but i need a good retest fpr my broken support and then we can enter a new sell trade and targeting 250 pips , cuz the price can`t close below this support for more than 3 weeks ,and now it did , so if we have a good retest it will be a great confirmation to enter .

BTC/USDT – 1-Hour Technical Analysis
As of the current 1-hour timeframe, Bitcoin (BTC) is exhibiting early signs of a potential bullish reversal after a sustained downtrend.
Key Observations:
Price Structure:
A clear downtrend was established with a series of Lower Highs (LH) and Lower Lows (LL) from the recent Higher High (HH).
The price action formed a bullish reversal pattern, possibly a Double Bottom or Inverted Head and Shoulders, near the recent LL around $93,300.
Break of Trendline:
The downward trendline connecting the recent highs has been broken, indicating a shift in momentum from bearish to bullish.
RSI Analysis:
The Relative Strength Index (RSI) has shown a bullish divergence. While the price made lower lows, RSI made higher lows, signaling a weakening of bearish momentum.
RSI currently stands near 46.88, moving upward, which supports a potential move toward the overbought zone.
Entry and Risk Levels:
Buy Stop: 94,944.95 USDT
Stop Loss: 93,279.56 USDT (just below recent support and second LL)
This setup implies a calculated long entry only if price confirms bullish continuation by breaking above the Buy Stop level.
Target Levels:
TP1: 96,526 USDT – First resistance level aligned with previous structure zone.
TP2: 98,119 USDT – Second major target near the previous swing high zone.
Conclusion:
A break above the $94,944 resistance would confirm a bullish reversal with potential targets at $96,526 and $98,119. However, failure to sustain above $94,000 or a breakdown below $93,279 would invalidate the bullish bias. Traders should monitor the RSI for confirmation and use proper risk management.

Nasdaq100 M30Last week NFP failed to push investors price high , while this our chance to hit the lows

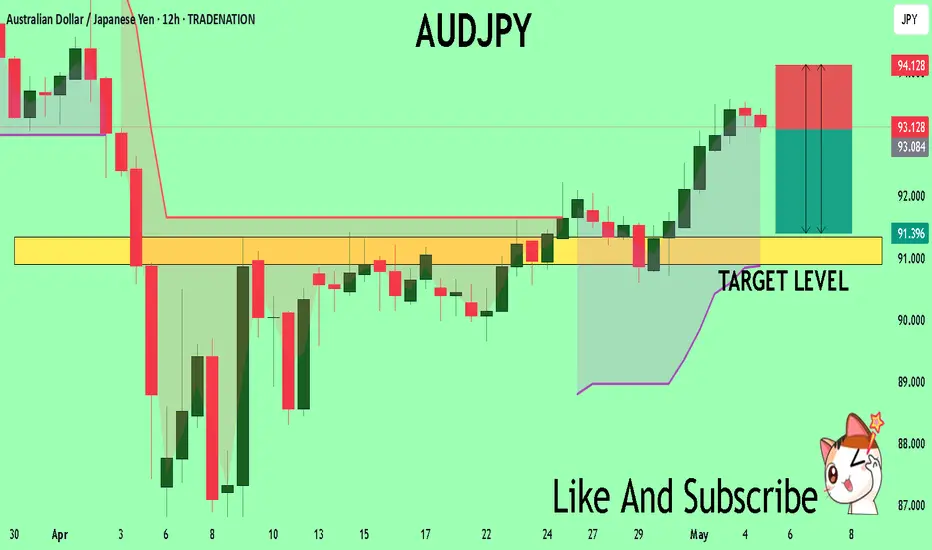
AUDJPY Buyers In Panic! SELL!
My dear subscribers,
AUDJPY looks like it will make a good move, and here are the details:
The market is trading on 93.104 pivot level.
Bias - Bearish
My Stop Loss - 94.128
Technical Indicators: Both Super Trend & Pivot HL indicate a highly probable Bearish continuation.
Target - 91.339
About Used Indicators:
The average true range (ATR) plays an important role in 'Supertrend' as the indicator uses ATR to calculate its value. The ATR indicator signals the degree of price volatility.
Disclosure: I am part of Trade Nation's Influencer program and receive a monthly fee for using their TradingView charts in my analysis.
———————————
WISH YOU ALL LUCK
BTC’s Resistance Rejection and Pullback PotentialBitcoin’s recent upswing encountered strong supply at a major confluence zone, setting the stage for a corrective phase. Below is a purely technical breakdown of the reversal signals and key levels to watch:
1. Confluent Resistance Barrier
Trend Channel Upper Boundary: BTC respected the descending channel ceiling drawn since November 2024, stalling gains at this dynamic resistance.
Volume Profile Node: The Point of Control for the November–April range coincides exactly with this ceiling, creating a heavy supply node where aggressive selling pressure has materialized.
2. Bearish Shark Harmonic Activation
Harmonic Geometry: The completed Shark pattern (0XA–AB–BC–CD) landed precisely at the resistance confluence, triggering a shift from impulsive to corrective price behavior.
Fibonacci Alignment: The D-leg retracement aligns with the 0.886 extension of the XA leg, reinforcing the pattern’s invalidation zone and confirming the reversal trigger.
3. Critical Downside Pivot
Key Swing Low – $91,648: A close beneath this level on elevated volume would validate the bearish scenario, initiating a cascading stop-run that could drive BTC toward the $86,000 structural support.
Stop-Hunt Risk: Traders who entered near recent highs likely have stops clustered just below the swing low; their liquidation would accelerate downside velocity.
Risk and Trade Management
Entry Zone: Aggressive short entries may be considered on a failure to retake the channel top, with initial targets near the POC support level.
Invalidation Point: A sustained reclaim of the channel resistance and POC region would negate the bearish thesis, shifting bias back to neutral or bullish.
Summary: Bitcoin’s clear rejection at overlapping resistance and the activation of the bearish Shark harmonic signal a high-probability pullback. Confirmation hinges on the swing-low break; otherwise, watch for a potential re-test of the confluence zone.

Bearish drop?NZD/JPY is reacting off the pivot and could drop to the 1st support.
Pivot: 86.11
1st Support: 84.18
1st Resistance: 86.84
Risk Warning:
Trading Forex and CFDs carries a high level of risk to your capital and you should only trade with money you can afford to lose. Trading Forex and CFDs may not be suitable for all investors, so please ensure that you fully understand the risks involved and seek independent advice if necessary.
Disclaimer:
The above opinions given constitute general market commentary, and do not constitute the opinion or advice of IC Markets or any form of personal or investment advice.
Any opinions, news, research, analyses, prices, other information, or links to third-party sites contained on this website are provided on an "as-is" basis, are intended only to be informative, is not an advice nor a recommendation, nor research, or a record of our trading prices, or an offer of, or solicitation for a transaction in any financial instrument and thus should not be treated as such. The information provided does not involve any specific investment objectives, financial situation and needs of any specific person who may receive it. Please be aware, that past performance is not a reliable indicator of future performance and/or results. Past Performance or Forward-looking scenarios based upon the reasonable beliefs of the third-party provider are not a guarantee of future performance. Actual results may differ materially from those anticipated in forward-looking or past performance statements. IC Markets makes no representation or warranty and assumes no liability as to the accuracy or completeness of the information provided, nor any loss arising from any investment based on a recommendation, forecast or any information supplied by any third-party.

Bitcoin Struggles at the $95,000 BarrierIn today’s session, BTC has once again posted a decline of over 2%, as the previous bullish bias struggles to break through the $95,000 resistance level. The neutrality forming on the chart around this zone reflects the uncertainty in market sentiment, which is also evident in the Crypto Fear and Greed Index, currently oscillating in the neutral range at 45 points. The market appears to be watching closely for developments in the trade war and the Federal Reserve's interest rate decision on Wednesday before resuming the buying pressure that has driven BTC in recent weeks.
Short-Term Bullish Trend
Since April 9, a sustained bullish trend has been forming in BTC’s price, until momentum stalled near the $95,000 resistance zone. Prolonged price neutrality around this level may begin to slow the upward momentum that had been developing and lead to a consolidation phase. However, the long-term outlook still shows a clear dominance of buying interest.
Technical Indicators:
RSI: The RSI line approached the overbought zone near the 70 level, but has since begun to trend downward, suggesting that the recent buying momentum is weakening. This opens the door for potential short-term bearish corrections.
MACD: The MACD histogram is slowly approaching the zero line, which may indicate a balance of forces in the market. Furthermore, if a crossover between the MACD line and the signal line occurs in the short term, it could be interpreted as the start of a sustained bearish momentum that may affect upward price movements.
Key Levels to Watch:
$95,000 – Major Resistance: The most relevant resistance level for BTC, aligned with the 61.8% Fibonacci retracement. A breakout above this zone could confirm the strength of buying interest and pave the way for a more extended bullish trend.
$90,000 – Nearby Support: This level aligns with neutral consolidation areas from previous sessions and could serve as a short-term support in the face of potential pullbacks.
$86,500 – Key Support: This level is marked by the 50-period simple moving average. A drop to this level could break the short-term bullish structure and extend bearish momentum.
Written by Julian Pineda, CFA – Market Analyst


DeGRAM | BTCUSD Holds the Accumulation Zone📊 Technical Analysis
● BTC rebounded off rising‐channel boundary and has formed a base in the $93K–95.3K accumulation zone. A decisive break above ~$95,700 would confirm a fresh leg to $98,000.
● Higher lows and tightening range signal building bullish pressure for an impulsive move toward the channel top.
💡 Fundamental Analysis
● Spot BTC ETFs logged ~$675 M of net inflows on May 2.
✨ Summary
Rising‐channel support + sustained ETF demand favor a short‐term long bias: targets GETTEX:98K → $100K; view invalidated below $91,500.
-------------------
Share your opinion in the comments and support the idea with a like. Thanks for your support!

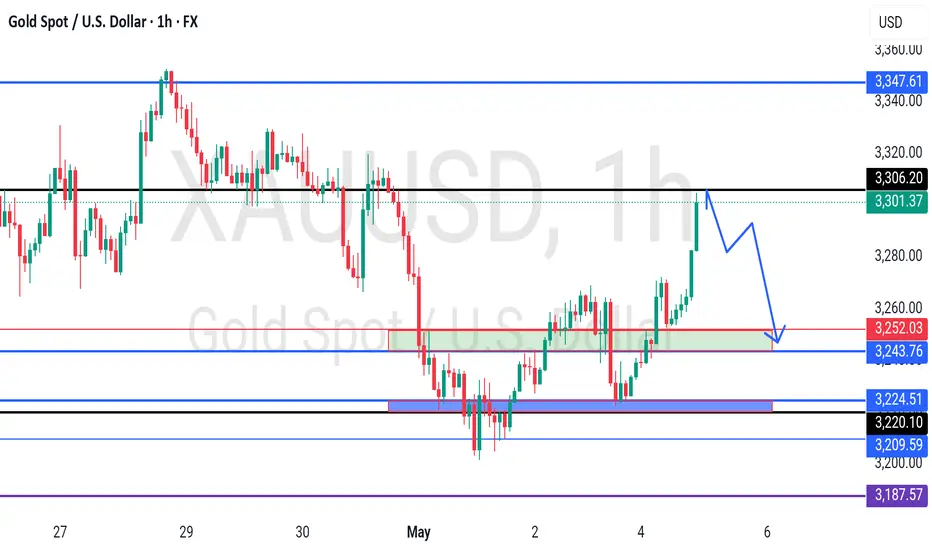
GOLD - reached at today resistance? What's next??#GOLD - perfect bounce above our area as we discussed in our video analysis.
Now market just reached at his today resistance area that is around 3302-05
Keep close it and if market holda then drop expected
Good luck
Trade wisely
Doge H4 | Overlap support at 38.2% Fibonacci retracementDoge (DOGE/USD) is falling towards an overlap support and could potentially bounce off this level to climb higher.
Buy entry is at 0.1667 which is an overlap support that aligns close to the 38.2% Fibonacci retracement.
Stop loss is at 0.1460 which is a level that lies underneath an overlap support and the 61.8% Fibonacci retracement.
Take profit is at 0.2028 which is a swing-high resistance.
High Risk Investment Warning
Trading Forex/CFDs on margin carries a high level of risk and may not be suitable for all investors. Leverage can work against you.
Stratos Markets Limited (tradu.com):
CFDs are complex instruments and come with a high risk of losing money rapidly due to leverage. 63% of retail investor accounts lose money when trading CFDs with this provider. You should consider whether you understand how CFDs work and whether you can afford to take the high risk of losing your money.
Stratos Europe Ltd (tradu.com):
CFDs are complex instruments and come with a high risk of losing money rapidly due to leverage. 63% of retail investor accounts lose money when trading CFDs with this provider. You should consider whether you understand how CFDs work and whether you can afford to take the high risk of losing your money.
Stratos Global LLC (tradu.com):
Losses can exceed deposits.
Please be advised that the information presented on TradingView is provided to Tradu (‘Company’, ‘we’) by a third-party provider (‘TFA Global Pte Ltd’). Please be reminded that you are solely responsible for the trading decisions on your account. There is a very high degree of risk involved in trading. Any information and/or content is intended entirely for research, educational and informational purposes only and does not constitute investment or consultation advice or investment strategy. The information is not tailored to the investment needs of any specific person and therefore does not involve a consideration of any of the investment objectives, financial situation or needs of any viewer that may receive it. Kindly also note that past performance is not a reliable indicator of future results. Actual results may differ materially from those anticipated in forward-looking or past performance statements. We assume no liability as to the accuracy or completeness of any of the information and/or content provided herein and the Company cannot be held responsible for any omission, mistake nor for any loss or damage including without limitation to any loss of profit which may arise from reliance on any information supplied by TFA Global Pte Ltd.
The speaker(s) is neither an employee, agent nor representative of Tradu and is therefore acting independently. The opinions given are their own, constitute general market commentary, and do not constitute the opinion or advice of Tradu or any form of personal or investment advice. Tradu neither endorses nor guarantees offerings of third-party speakers, nor is Tradu responsible for the content, veracity or opinions of third-party speakers, presenters or participants.

NZDCAD – 1H Bullish Divergence Building the Case for a BounceNZDCAD – 1H Bullish Divergence Building the Case for a Bounce 🔁📈
What’s up traders 👋
Eyes on NZDCAD 1H — things are getting interesting. While price has been sliding lower, momentum is quietly painting a different story. That’s right: we’ve got a bullish divergence on the radar.
🔎 Lower Lows in Price, Higher Lows in RSI
Let’s keep it simple. Price has been pushing into new lows, but RSI is doing its own thing — making higher lows in the same zone. That’s a bullish divergence, and it often signals that the downtrend is running out of gas.
The sellers are pressing, but they’re not getting the same power behind their moves. Meanwhile, buyers are starting to show up — quietly, but with intent.
This is not just noise, this is accumulation behavior.
🧠 What to Watch For
A bullish divergence on the 1H doesn't guarantee an immediate reversal, but it definitely sets the stage. Here's how this could play out:
A double bottom, higher low, or trendline break could act as the trigger.
Volume increasing on green candles? Even better.
Watch for price reclaiming key levels or flipping recent resistance into support — that’s confirmation.
💡 Potential Setup Brewing
If you’re a scalper or short-term swing trader, this could be a great spot to start planning. Not every divergence plays out, but when they do — the risk-to-reward is often skewed in your favor, especially if you catch it before the crowd sees it.
📌 Momentum Is Whispering – Are You Listening?
What’s your take on NZDCAD right now? Are you preparing for the bounce or waiting for more proof?
#NZDCAD #BullishDivergence #1HChart #ForexTrading #MomentumShift #PriceAction #TechnicalAnalysis #RSI #SmartTrading

Bittensor Turns Bullish Moving Averages (Soon Above $1,100)Here Bittensor (TAOUSDT) can be seen trading safely above EMA55/89, as well as two long-term moving averages (EMA233/377):
This is a bullish bias fully confirmed.
This confirmed bullish bias will put TAOUSDT above $1,100 within 3 months, most likely. But this isn't all, there is room for additional growth. See this chart:
Overall, trading volume is good and this pair has been pretty active lately.
After the last advance, the action is happening at resistance and stays there, no significant retrace is present on the chart. When a project is weak, a challenge of resistance immediately sends prices lower. When the market is bearish, a challenge of resistance leads to a crash.
Let me give you some examples. Notice the peak March 2024, the market was bearish and the drop that follows is fast and strong, also long-term. The same is true for October and December 2024. When the market is bearish, reaching resistance leads to a very strong bearish candle.
Currently, resistance was hit 25-April but the market went sideways rather than crashing, and, yesterday, a full green candle just to keep the action as close to resistance as possible. The more a resistance level is challenged, the weaker it becomes.
» Bittensor is good, TAO is good and ready to grow. It will grow long-term for months. Up and up, more and more; over and over, again and again.
Namaste.

Bearish drop?NZD/JPY is reacting off the resistance level which is a pullback resistance and could potentially drop from this level to our take profit.
Entry: 86.13
Why we like it:
There is a pullback resistance level.
Stop loss: 87.27
Why we like it:
There is a pullback resistance level that lines up with the 78.6% Fibonacci projection.
Take profit: 85.10
Why we like it:
There is an overlap support level that aligns with the 61.8% Fibonacci retracement.
Enjoying your TradingView experience? Review us!
Please be advised that the information presented on TradingView is provided to Vantage (‘Vantage Global Limited’, ‘we’) by a third-party provider (‘Everest Fortune Group’). Please be reminded that you are solely responsible for the trading decisions on your account. There is a very high degree of risk involved in trading. Any information and/or content is intended entirely for research, educational and informational purposes only and does not constitute investment or consultation advice or investment strategy. The information is not tailored to the investment needs of any specific person and therefore does not involve a consideration of any of the investment objectives, financial situation or needs of any viewer that may receive it. Kindly also note that past performance is not a reliable indicator of future results. Actual results may differ materially from those anticipated in forward-looking or past performance statements. We assume no liability as to the accuracy or completeness of any of the information and/or content provided herein and the Company cannot be held responsible for any omission, mistake nor for any loss or damage including without limitation to any loss of profit which may arise from reliance on any information supplied by Everest Fortune Group.

XAUUSD Bounce to daily resistance?Hello traders, this is a complete multiple timeframe analysis of this pair. We see could find significant trading opportunities as per analysis upon price action confirmation we may take this trade. Smash the like button if you find value in this analysis and drop a comment if you have any questions or let me know which pair to cover in my next analysis.
