EUR/USD Buy nowTook a EUR/USD buy after a sell-side liquidity sweep followed by a clear change of character (CHOCH) on the 5-minute timeframe. Waited for price to retrace into the fair value gap (FVG) and entered on the retest. Targeting the next high and liquidity above
Chart Patterns

My buy view for NVIDIA stock explained My buy view for NVDA.
If positive fundamentals continue to outweigh bad news, we are likely to see NVDA push further up towards $120, $130, $140, and then its previous peak of $150.
Trade with care if you are day trading, but this baby is still selling at discount in my view

Gas vs. OPEC+🔥 #GasHasNoMercy
📉 Gas is again following the main scenario closely. We stayed out of the market most of the time, as the movement was a correction within the primary downtrend, which remains intact.
The wave is nearing completion. Historically, gas rarely reverses after weekends—it typically continues the previous week’s trend until Tuesday-Wednesday. However, we now expect oil to gap down at the open due to OPEC+’s decision to accelerate production increases. This creates uncertainty in gas’s reaction:
▪️ Logically, gas should rise (lower oil prices → reduced U.S. production → less associated gas → higher gas prices).
▪️ But the market might temporarily ignore this correlation and follow oil’s lead.
Current tactic: Trade with the trend (downward). Not advice or recommendation.
💬 Your thoughts?
🔄 Agree with the plan? Comment below ➡️
⚠️ Disclaimer:
My analysis is for discussion purposes, not trading advice. Trading gas with leverage and no stop-losses is like playing with fire—high risk to capital and mental health.

EUR/CAD Short, AUD/CAD Short, USD/CHF Long and USD/JPY ShortEUR/CAD Short
Minimum entry requirements:
• If structured 1H continuation forms, 1H risk entry within it.
AUD/CAD Short
Minimum entry requirements:
• 1H impulse down below area of value.
• If tight non-structured 15 min continuation follows, 5 min risk entry within it if the continuation is structured on the 5 min chart or reduced risk entry on the break of it.
• If tight structured 15 min continuation follows, reduced risk entry on the break of it or 15 min risk entry within it.
USD/CHF Long
Minimum entry requirements:
• Tap into area of value.
• 1H impulse up above area of value.
• If tight non-structured 5 min continuation follows, reduced risk entry on the break of it.
• If tight structured 5 min continuation follows, reduced risk entry on the break of it or 5 min risk entry within it.
• If tight non-structured 15 min continuation follows, 5 min risk entry within it if the continuation is structured on the 5 min chart or reduced risk entry on the break of it.
• If tight structured 15 min continuation follows, reduced risk entry on the break of it or 15 min risk entry within it.
USD/JPY Short
Minimum entry requirements:
• If structured 1H continuation forms, 1H risk entry within it.

"Bitcoin - Stop loss level $92381.77"In continuation with yesterday's update,
"#Bitcoin, there is a possibility that $94239.50 may act as support otherwise $92381.77 should work as a stop loss. If it breaks, then we may see the further downside levels as $90523.64, $88665.50, $86575.25 and $84485.00.",
Now, I have added the upside levels as well.
Mid-point: $94239.50
Stop loss: $92381.77
Upside: $97962.33, $99813.50, $101903.75 and $103994.00
Downside: $90523.64, $88665.50, $86575.25 and $84485.00
#BTCUSD
#BitcoinResistance
#CryptoAnalysis
#ChartAnalysis

CHFJPY Analysis – Bearish Rejection at ResistanceCHFJPY pair is showing signs of exhaustion near a strong resistance zone just under 176.00. With price action printing multiple rejections and forming lower highs, the setup favors a bearish bias heading into mid-Q2 2025. With Japanese yen sentiment strengthening despite market doubts and Swiss inflation data showing stagnation, the technical picture is aligning with macro fundamentals for a potential drop.
📊 Technical Outlook (Daily Chart)
Key Resistance Rejected:
Price failed to sustain above 175.75–176.15 area, a strong historical resistance.
Multiple rejection wicks highlight bearish pressure at this level.
Bearish Structure:
Rising wedge and flag breakdowns have preceded the current move.
The chart shows a projected bearish leg forming, with three potential targets marked by green support zones.
Support Levels to Watch:
172.61 – Minor structure and neckline support.
171.00 – Key horizontal zone; likely the first major test.
168.50–166.50 – Final bearish targets based on previous structure and price consolidation.
Bearish Trade Plan (as indicated):
Entry zone: ~174.80–175.50 (after a confirmed lower high or breakdown).
Stop: Above 176.15 (structure invalidation).
TP1: 172.60
TP2: 171.00
TP3: 168.50
Final TP: 166.50
🌐 Fundamental Drivers
Swiss Inflation (April 2025):
Swiss CPI was flat MoM and YoY (0.0%), reflecting weak price momentum
Core inflation remained modest (+0.1%), reducing pressure on SNB to tighten policy.
JPY Sentiment & Positioning:
COT data shows record net-long JPY positions, suggesting strong speculative interest
Analysts warn of overbought sentiment, but dovish BoJ policy continues to suppress JPY bears for now.
Macro Context:
Risk-off sentiment or yield curve steepening could favor the yen further.
CHF may weaken if Swiss data continues to underwhelm.
✅ Summary
CHFJPY has rejected strong resistance, and both technical and macro indicators suggest a pullback is likely. A break below 172.60 could open the door to deeper declines toward 168.50–166.50 in the coming weeks.

CreditAccess Grameen (CREDITACC) – Bullish Breakout SetupStock Name: CreditAccess Grameen (CREDITACC)
Trend : Bullish
Timeframe : Daily
Trade Setup
Entry Point: ₹1,163
Stop Loss: ₹1,089 (Risk: ~6.4% from entry)
Targets:
Target 1: ₹1,205.70
Target 2: ₹1,248.75
Target 3: ₹1,294.15
Target 4: ₹1,337.15
Final Target: ₹1,385
Technical Rationale for Breakout
Bullish Flag Pattern Breakout: Price has broken out of a Bullish Flag pattern, signaling a continuation of the prior uptrend.
200 DEMA Support: The stock crossed above and retested the 200-day Exponential Moving Average (DEMA), now acting as strong support.
RSI Strength:
Daily RSI: Above 60 (indicating bullish momentum).
Weekly RSI: Also above 60 (confirms broader bullish bias).
Volume Confirmation:
Breakout day volume: 4.0M (extremely high vs. previous day’s 406.05K), validating the breakout’s strength.
Key Observations
The combination of a Bullish Flag breakout, volume surge, and RSI strength suggests a high-probability trade.
The 200 DEMA support adds confluence to the bullish structure.
Risk Management Tips
Strictly adhere to the stop loss.
Trail stops as price progresses toward targets.
Consider partial profit booking at each target level.
Disclaimer
This analysis is for educational and informational purposes only and should not be construed as financial or investment advice. Trading in equities carries inherent risks, including the potential loss of capital. Always conduct your own due diligence and consult a certified financial advisor before making any investment decisions. Past performance is not indicative of future results. The author assumes no responsibility for financial losses or gains based on this post. Volume, price, and indicator data are subject to market volatility and may change rapidly.
Let me know your thoughts in the comments! Are you watching this setup? 📈🔍

Tue 6th May 2025 BTC/USD Daily Forex Chart Sell SetupGood morning fellow traders. On my Daily Forex charts using the High Probability & Divergence trading methods from my books, I have identified a new trade setup this morning. As usual, you can read my notes on the chart for my thoughts on this setup. The trade being a BTC/USD Sell. Enjoy the day all. Cheers. Jim

Gold Intraday Trading Plan 5/6/2025As mentioned yesterday, a break above 3270 will signal the end of correction. Indeed after breaking the resistance, gold has gone up all the way to 3330. Right now there is a strong resistance at 3350. I will trade its breaking of structure or retest from 3270.
This is my strategy for today:
1. if 3350 is broken, upon retest, buy towards 3400 or even 3450.
2. Buy from 3270, 1st target 3350, 2nd target 3400

Latest gold trading analysis strategy on May 6:
Core driving factors
Surge in safe-haven demand
The continued escalation of the conflict between Russia and Ukraine and the situation in the Middle East has driven funds to flow into gold for safe-haven, with an intraday increase of 2.27% (over $80), reaching a high of $3,328.
Policy uncertainties such as the 100% tariff imposed by the United States on imported films have further weakened market risk appetite.
Monetary policy expectations
The market is betting that the Federal Reserve will soon start a rate cut cycle, and the attractiveness of interest-free assets such as gold has increased. However, it is necessary to be vigilant that inflation resilience or economic data exceeding expectations may delay rate cuts and trigger a correction in gold prices.
Weak US dollar and central bank gold purchases
The US dollar has failed to gain sustained momentum from strong employment data to support gold. The global central bank gold purchases (especially in emerging markets) provide long-term support for gold prices.
Key technical signals
Daily level
Potential top risk: The long upper shadow line of the high and fall last Friday shows upper selling pressure, MACD dead cross and MA5 moving average downward, suggesting that the trend may weaken.
Support confirmation: The current price has returned to above $3,300, and it is necessary to observe whether it can stand firm at this psychological barrier.
4-hour level
Range oscillation: Short-term wide range oscillation between 3270 and 3350, MACD golden cross but needs to break through the 3330-3350 pressure zone to confirm the continuation of the bulls.
Key positions:
Resistance: 3330 (intraday high), 3350 (previous high and upper edge of the range).
Support: 3300 (psychological barrier), 3280-3290 (MA10 moving average and short-term bull defense line).
Operation strategy suggestions
Short-term bull opportunities
Entry conditions: Retracing to the 3280-3290 support area and the emergence of stabilization signals (such as 4-hour K-line closing positive or MACD bottom divergence).
Target: 3330→3350, after breaking through, it can look up to 3400.
Stop loss: below 3270 (the trend turns bearish if the range breaks).
Be cautious of high-altitude opportunities
Entry conditions: rebound to 3340-3350 under pressure (previous high of the daily line + upper edge of the range), combined with K-line reversal patterns (such as pin bar).
Target: 3300→3280.
Stop loss: above 3360 (to prevent sudden geopolitical risks from driving breakthroughs).
Breakthrough follow-up strategy
Break above 3350: light position chasing long, target 3400, stop loss 3340.
Break below 3270: turn to bearish, target 3230-3250, stop loss 3280.
Risk warning
Escalation of geopolitical conflicts: If the situation suddenly deteriorates (such as large-scale conflicts in the Middle East), the gold price may quickly break through 3350, and the stop loss needs to be adjusted in time.
Changes in Fed policy expectations: Focus on non-agricultural, CPI and other data. If it shows that the economy is overheated or inflation is sticky, it may suppress expectations of interest rate cuts and be bearish for gold.
Summary: Gold is bullish in the short term due to risk aversion, but there is a risk of a correction on the technical side. It is recommended to go long on pullbacks, and try to go high at key resistance levels with strict risk control. Conservative investors can wait for a breakout of 3350 or a fall below 3270 before following the trend.

EURUSD LONG Greetings traders this is my idea on EURUSD and it is Long.
As we can see on the chart this is my idea on EURUSD
After a big accumilation we can see that the price is begining for a uptrend movement.
Like,comment

AUD/USD Ready To Give Us A Second Entry With Extra 250 Pips !Here is my second area to can enter a buy trade on AUD/USD , First Entry +90 Pips , now i`m looking for second entry , we have a very good breakout after long time , so it will be my fav place to add another entry and targeting another 250 pips , just waiting for touch and good bullish price action to confirm my analysis .

5 May Weekly NAS100 Forecast USTECH: Trade Talks and Fed Decision in Focus
Analysis:
Markets are at a pivotal juncture as investors monitor two critical developments: the potential resumption of U.S.-China trade negotiations and the Federal Reserve's upcoming policy decision.
Trade Negotiations: Renewed dialogue between the U.S. and China could alleviate tariff pressures, stabilize global supply chains, and bolster investor confidence, thereby reducing recession risks.
Federal Reserve Decision: The Federal Open Market Committee (FOMC) is scheduled to meet on May 6–7, 2025. While the Fed is widely expected to maintain the current interest rate range of 4.25%–4.50%, market participants are keenly awaiting Chair Jerome Powell's commentary for insights into future monetary policy directions.
Market Bias: Cautiously Bullish
The confluence of potential trade resolutions and a steady monetary policy stance supports a cautiously optimistic outlook. However, market volatility may persist pending concrete developments.
Key Levels to Watch:
USTECH (NASDAQ 100):
Resistance: 20 531
Support: 19 481
Conclusion:
Investors should remain vigilant, monitoring both geopolitical developments and central bank communications, as these factors will significantly influence market trajectories in the near term.
---
Disclaimer: This analysis is for informational purposes only and does not constitute investment advice. Always conduct your own research before making trading decisions.
---

USDJPY Analysis Today: Technical and Order Flow !In this video I will be sharing my USDJPY analysis today, by providing my complete technical and order flow analysis, so you can watch it to possibly improve your forex trading skillset. The video is structured in 3 parts, first I will be performing my complete technical analysis, then I will be moving to the COT data analysis, so how the big payers in market are moving their orders, and to do this I will be using my customized proprietary software and then I will be putting together these two different types of analysis.

EUR/USD Rejected at Resistance – Bearish Setup in Motion!Timeframe: 15-Minute (M15)
Designed for short-term or intraday trades.
Entry Zone (Short):
Price is reacting to a fresh supply zone around 1.13260–1.13280.
Stop Loss:
Just above the supply zone, near 1.13280 (tight SL setup).
Bearish Reaction:
Price rejected resistance with a wick and bearish body — strong confirmation of selling pressure.
Target Zone (Demand):
A wide green demand area is marked at 1.12810–1.12830, providing a solid take-profit level.
Structure Bias:
Current formation shows lower highs and clear resistance respect — indicating bearish momentum.
Risk-to-Reward Ratio:
Strong RRR (more than 2:1) – minimal risk for decent reward.

#NIFTY Intraday Support and Resistance Levels - 06/05/2025Flat opening in nifty in consolidation zone of 24450-24500 level. After opening any side breakout can gives strong rally in nifty. If nifty starts trading and sustain above 24500 level then expected upside rally upto 24750+ level in today's session. Downside below 24450 level there will be further downside possible upto the 24250 support level.

Gold shortShort position on a LTF .
i think it retraces a little bit and then it continues higher on HTF.

PLTR, It's Been RealAt a high of 125, it's had a great run, but a double top has formed going into earnings and a US government which may be forced into austerity. Insiders have been selling for months with no net buys
- First Price target down to the neckline at 76
- Next price target would be 42 for the last real breakout test
- Final PT would be 24 if the double top played out completely

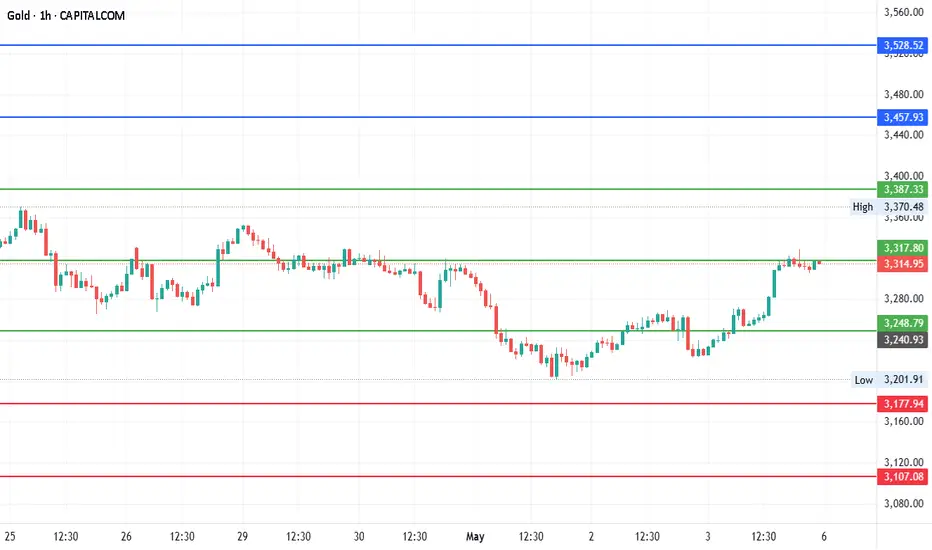
GoldCurrent Price: $3317
Mid-point: $3317.80
Upside: $3457.93, $3528.52, $3607.54 and $3686.56
Downside: $3177.94, $3107.08, $3028.06 and $2949.04
Resistance: $3387.33
Stoploss: 3248.79
#Gold
#GoldChartAnalysis
From $1.37 to $8.48 in 5 hours +518% Massive start of the week with 2 Buy Alerts sent out right before vertical move!
$4.00 confirmed as important line in premarket trading already, then quickly set a strong support above it as soon as market opened and when it came down to re-test it again after initial pop it was showing strong hidden buying in that area which was confirming everything else we were looking and aiming for - power vertical squeeze to new highs.
Biggest stock gainer of the entire stock market today AMEX:GPUS
Get ready for next ones!

Gold will first rebound and adjust its rhythm.The 4H chart is a bullish structure. In the short term, it is necessary to continue to be strong, with the target of 3202-3500 connecting the 50% rebound point of 3350. In the medium term, before breaking through the 61.8% rebound point of 3386, maintain a bearish mindset. Short-term support is 3310, strong support is 3304-3300; short-term resistance is 3328, strong resistance is 3336-3350. If it breaks through strongly, pay attention to the attack and defense of the 3370-3386 range.

ORDIUSDT — channel, high risks, high rewards.ORDI is the first BRC-20 token based on the Ordinals protocol on Bitcoin. Since its launch in March 2023, the token quickly gained popularity and a significant market cap, being integrated into the Bitcoin blockchain. This integration is made possible through the Ordinals protocol developed by Casey Rodarmor. The protocol allows inscriptions - text, images, audio, or video - to be made directly on satoshis, the smallest unit of Bitcoin, giving Bitcoin new functionality that was not originally envisioned. You can now create NFTs and other digital assets and trade them directly on the blockchain.
____________
The token was listed at a fortunate time - late 2023 - amid overall market growth and positive sentiment. At the time, everything looked promising, but now the price has dropped by 94% from the zones where “hype was being sold.”
🔻 Structure:
The token is moving within a large descending channel. Recently, the price tested the outer support of this channel.
A local downtrend channel was also broken - its retest and a rise within the main trend are possible.
📊 Scenarios:
Retest and upward movement as part of a correction.
Consolidation in the current zone with a possible breakout to the upside.
Further decline amid overall negative market sentiment.
💥 Risks:
The token is traded on all major exchanges, including Binance. However, if it gets delisted (which has been happening more often recently), this is the main risk: loss of liquidity!
🎯 Approach:
With such tokens, it’s crucial to distribute volume wisely and accept risk in advance. I mark out interesting zones and place limit orders accordingly.
Considering the overall market and news backdrop, the token does have bounce potential, especially now that faith in the project is nearly lost.
💭 Opinion:
From my years of experience, I’ll say it again: the goal isn’t to guess where the price will go - it’s to be ready for it. Not everyone will understand that, but then again, not everyone consistently makes money in this market.
_________
📌 Not financial advice. This material reflects personal observations and a risk management approach.

ETH LONG (Longer Timeframe)ETH is bullish, just like many other alts in the long term. Expected price drop to around $1690-$1720 range for entry long.
From my charts we can see that using PO3, manipulation happened the previous month, closing within range low. now price will seek to gather liquidity end from range high, closing above and around $2555.
Entry on fair value gap after bounce in $1690-$1720 range.
