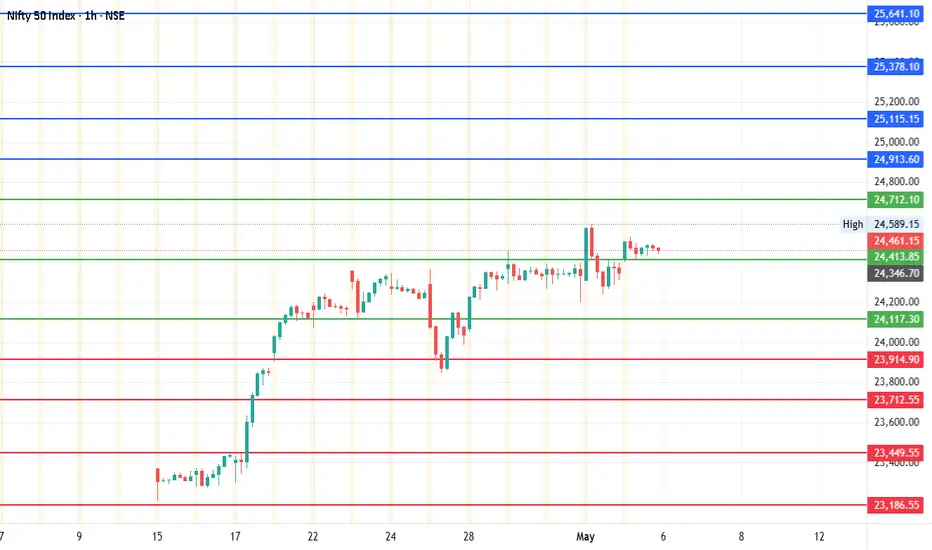
"Nifty 50 - 1st Level 24487.28 hit posted on 26th April" The levels mentioned in the previous chart is still intact-26th April.
Here are the inter-mediate levels for the next week or so. Will India-Pakistan war a spoilsport for the upside levels or will the markets surprise you? can we expect 1000 pts or 2000 pts swing? can be any direction.
Let's watch out for these levels:
Current Price: 24,461.15
Mid-point: 24413.83
Upside: 24913.61, 25115.13, 25378.11 and 25641.10
Downside: 23914.92, 23712.53, 23449.54 and 23186.55
Resistance: 24712.10
Stop loss: 24117.31
Chart Patterns
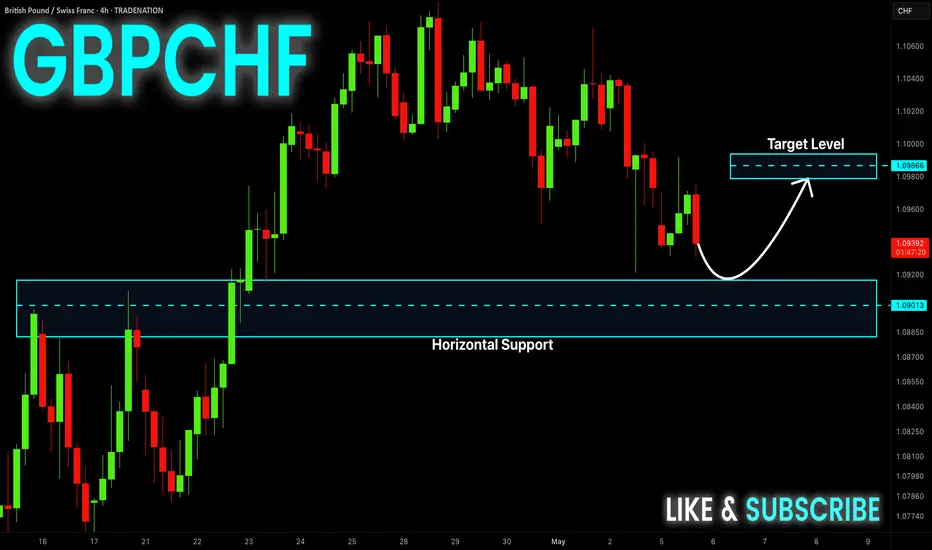
GBP-CHF Local Long! Buy!
Hello,Traders!
GBP-CHF is going down
Now but the pair is close
To the horizontal support
Level of 1.0901 already so
After the retest we will be
Expecting a local bullish rebound
Buy!
Comment and subscribe to help us grow!
Check out other forecasts below too!
Disclosure: I am part of Trade Nation's Influencer program and receive a monthly fee for using their TradingView charts in my analysis.
MOVEUSDT.P LONGI think the price will jump from here.
Looking to book 75% at first tp.
Risky trade as btc not looking so good.
But this coin may pump.
Lets hope for the best.
DYOR

BITCOIN UPDATE for WAVE 5 one more POPBitcoin and the wave structure is now been updated I have said the rally should reach 96100 to 101 k I still feel the markets have added some short term Liquidity this should help ASSETS for another weak rally back to .786 on All indexes But CYCLES are turning DOWN for a corrective phase . So raise cash into all rallies .Best of trades WAVETIMER

ETH/USDT ETH/USDT 4-hour chart
Price is currently just above the 200 EMA, which often acts as dynamic support.
ETH has been consolidating around this level neither showing strong bullish breakout nor bearish breakdown.
The price is ranging sideways in a relatively tight band, showing a lack of strong momentum either way.
There’s no clear higher high or lower low — a neutral/balanced market phase.
Recent candles show wicks on both ends, indicating indecision and equal pressure from buyers and sellers.
As long as price holds above the 200 EMA (~$1780), bulls maintain slight control.
If ETH breaks and closes below the 200 EMA, it may open a path toward lower support zones (~$1740, $1700).
To regain bullish momentum, ETH need to break and hold above ~$1840–$1860, the recent local highs.
Looking for breakout with strong momentum, watch for massive volume candle.
stay strong and take care.

Watching carefully USDCAD this weekWith the abundance of US & CAN data this week, we may see some interesting action in USDCAD pair.
Let's dig in.
Let us know what you think in the comments below.
Thank you.
77.3% of retail investor accounts lose money when trading CFDs with this provider. You should consider whether you understand how CFDs work and whether you can afford to take the high risk of losing your money. Past performance is not necessarily indicative of future results. The value of investments may fall as well as rise and the investor may not get back the amount initially invested. This content is not intended for nor applicable to residents of the UK. Cryptocurrency CFDs and spread bets are restricted in the UK for all retail clients.

AUDJPY, our risk on/off monitor, is near a key resistance areaAUDJPY has been on a good run lately. The driving force behind it was the improved market sentiment due to the calming moment in the tariff wars. Can this be sustained?
Let's look at the technical picture of AUDJPY.
Let us know what you think in the comments below.
Thank you.
77.3% of retail investor accounts lose money when trading CFDs with this provider. You should consider whether you understand how CFDs work and whether you can afford to take the high risk of losing your money. Past performance is not necessarily indicative of future results. The value of investments may fall as well as rise and the investor may not get back the amount initially invested. This content is not intended for nor applicable to residents of the UK. Cryptocurrency CFDs and spread bets are restricted in the UK for all retail clients.

GOLD Update - One More Javpot Trade . We Have planned a Gold Trade In Previous Post . Gold Trading At 3200 at that Time .
Now Gold Blasting Current Price is 3313 . We Are Expecting a All Time High In Gold .
Hope You Have Taken a advantage . Keep Rocking

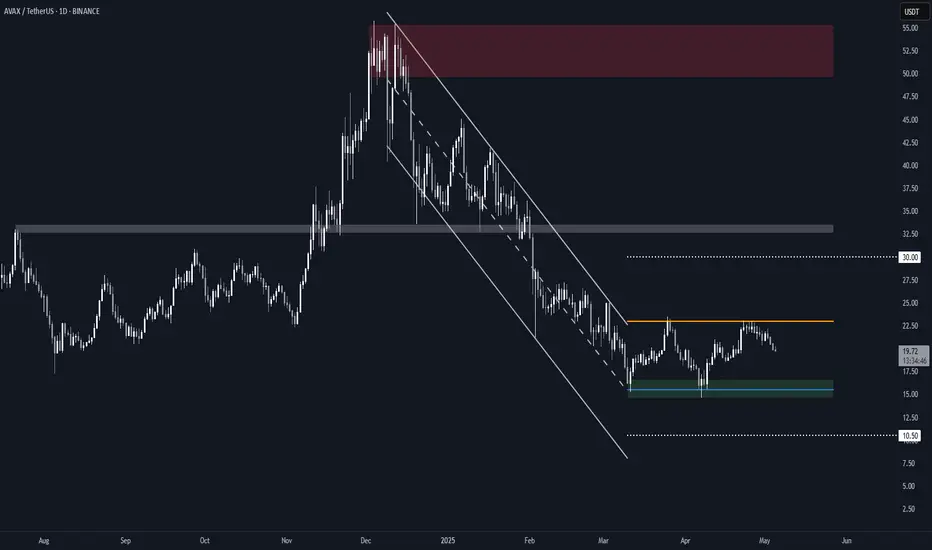
Avalanche (AVAX) RectangleBINANCE:AVAXUSDT is trading within a well-defined rectangle, after breaking out of a steep falling channel earlier this year.
Key Observations
• The current range has two clear touches on both support ($15.50) and resistance ($23.00), forming a valid rectangle structure.
• This follows a sideways channel breakout, suggesting a consolidation phase which is often a precursor to a larger move.
Range Levels
• Resistance – $23.00: Capped price twice in April, marking the upper bound of the rectangle.
• Support – $15.50: Held firmly on two separate pullbacks.
• Midrange Bias – As long as AVAX remains within this box, directional conviction remains limited.
Breakout/Breakdown Scenarios
• Bullish Breakout: If AVAX closes decisively above $23.00, the measured target would be ~$30, based on the rectangle height projected upward (linear scale).
• Bearish Breakdown: If it loses $15.50 support, the downside target becomes $10.50, calculated using the same rectangle height on log scale (to reflect proportional downside risk).
Until either side breaks, this remains a range-trading environment.
Triangle PatternThe price has formed a triangle pattern as a consolidation pattern, and now the price broken out of the pattern followed by a pullback, it is very likely to continue lower as we follow the trade with the 4 hour MA
time to go short
WE ONLY TRADE PULLBACKS

BTC Traders: Buy the Dip or Wait for the Break?Bitcoin broke out of its range, hit 97K, and is now consolidating near key resistance at 99K. Traders are watching for either a bullish breakout or a dip to buy. Watch the video to learn more.
This content is not directed to residents of the EU or UK. Any opinions, news, research, analyses, prices or other information contained on this website is provided as general market commentary and does not constitute investment advice. ThinkMarkets will not accept liability for any loss or damage including, without limitation, to any loss of profit which may arise directly or indirectly from use of or reliance on such information.

BTCUSD in bullish trend BTCUSD in bullish trend expected correction according to RSI diversions, entry with a sell stop

Short-Term Trade Setup: NZDCAD Eyes 0.82898–0.83110 TargetsGood day Traders,
Trust you are well.
Below is my analysis of NZDCAD.
Overview:
NZDCAD is retracing from the recent high at 0.83050, currently trading around 0.82628. Price action is approaching a key support zone between 0.82470 – 0.82285, an area that previously triggered bullish reactions. Momentum indicators are showing bearish pressure, with red histogram bars visible on the chart.
Idea:
Although bearish momentum is present, the histogram shows a slight decrease in selling pressure, hinting at a potential slowdown in the current downtrend. If the pair holds above the 0.82287 level, it could signal a potential reversal or bounce. This would open room for bullish targets at: 0.82898, 0.83039 and 0.83110.
However, a confirmed break below 0.82287 could expose the next support around 0.82100.
Conclusion:
The pair is at a critical support zone, with decreasing momentum suggesting that sellers may be losing strength. A bounce from current levels could provide a short-term buying opportunity, while a break below 0.82287 would invalidate the bullish outlook.
Cheers and happy trading!

Poker Game Playthis is a simple system for your risk management... instead of doing all thigns in your mind... you are devloping a system which you can increase your performance

EURAUD possible short for 1.7150euraud forming lower low and lower high on daily time frame, indication for downtrend. in daily time frame supply zone is quite larger, 1.5760-1.7885. ideal level for short is 1.7820 & 1.7885, stop loss 1.7910. initial target 1.7400, longer term down target is 1.7150.

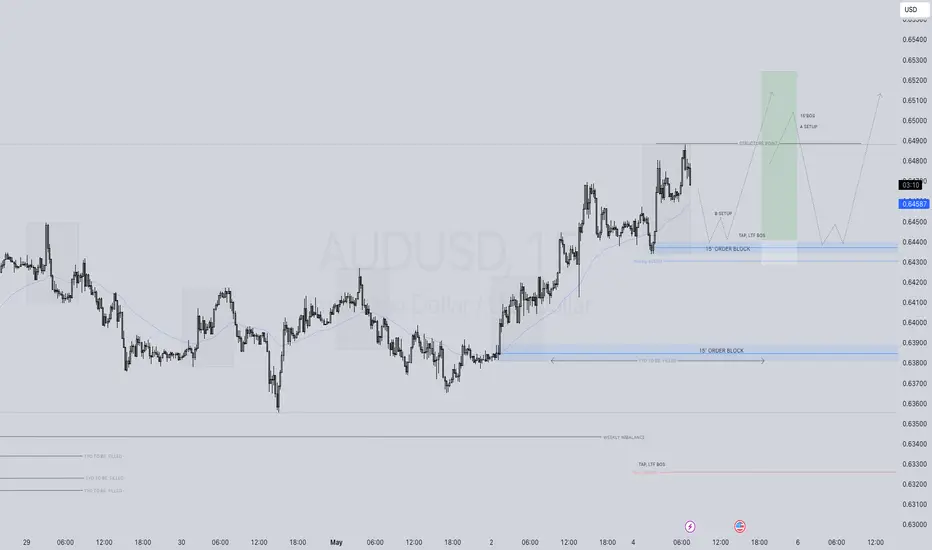
AUDUSD LONG FORECAST Q2 W19 D5 Y25
AUDUSD LONG FORECAST Q2 W19 D5 Y25
Professional Risk Managers👋
Welcome back to another FRGNT chart update📈
Diving into some Forex setups using predominantly higher time frame order blocks alongside confirmation breaks of structure.
Let’s see what price action is telling us today!
💡Here are some trade confluences📝
✅Weekly 50 EMA
✅Intraday 15' order block
✅Tokyo ranges to be filled
✅Intraday bullish breaks of structure to be confirmed
🔑 Remember, to participate in trading comes always with a degree of risk, therefore as professional risk managers it remains vital that we stick to our risk management plan as well as our trading strategies.
📈The rest, we leave to the balance of probabilities.
💡Fail to plan. Plan to fail.
🏆It has always been that simple.
❤️Good luck with your trading journey, I shall see you at the very top.
🎯Trade consistent, FRGNT X
ORCL looking at a new returned upsideRising momentum is seen for ORCL L after mid-term stochastic oscillator performs an oversold crossover and rising momentum. Furthermore, the 23-period RSI has rose steadily above the zero line.
Meanwhile, price action saw continued upside coming after forming a pair of higher high and low. Ichimoku's conversion and base line has performed a crossover, indicating an early signs of uptrend returning. Will buy spot or wait for a small retracement until 1433.00. or 128.00 to enter a buy. 1st target at 180.00

Institutions Are Loading EUR/NZDIn the current market context, EURNZD is showing a highly compelling technical and fundamental structure for both short- and medium-term opportunities. After a prolonged retracement from the March highs, the price has strongly reacted from a clearly defined weekly demand zone between 1.8712 and 1.8600.
From a technical perspective, this reaction aligns with a moderate RSI divergence and a still intact macro bullish market structure, despite the corrective nature of recent weeks.
However, what truly validates this setup goes beyond price action alone. The latest Commitment of Traders (COT) data strongly supports the long thesis. On the euro side, we observe a significant increase in commercial long positions (+14,659 contracts), signaling institutional hedging activity. At the same time, non-commercials (speculators) have been cutting their short positions, suggesting growing expectations of euro strength.
On the NZD side, the picture is even more decisive: non-commercials maintain a net short position of -40,444 contracts, with a further reduction in long positions. The speculative sentiment toward the NZD is clearly bearish and shows no signs of short-term reversal.
Adding to this, retail sentiment data currently shows that 59% of retail traders are short on EURNZD. From a contrarian perspective, this is particularly bullish — the crowd is selling while smart money is buying.
Seasonality also supports the setup: historically, the months of May and June have been positive for the euro and negative for the NZD, adding an additional statistical layer of confluence to the trade idea.
🎯 Conclusion
We may be witnessing the early stages of a new bullish leg on EURNZD. The 1.89 area represents a potential re-entry zone in the event of a retest. The medium-term target is set between 1.9300 and 1.9500.
Technical structure, institutional positioning, retail sentiment, and seasonality all align in favor of a clear bullish bias in the coming weeks.

BTC Update higher and lower timeframe narratives. While the 1-hour chart exhibited a strong bullish reaction from a key liquidity zone, the failure of a supporting imbalance on the 15-minute chart introduces the possibility of a retracement or a deeper corrective move before any sustained upward trajectory.
.
on the 15-minute timeframe presents a contrasting perspective. A bullish imbalance (Fair Value Gap) that was anticipated to provide support has failed to hold. This development suggests a potential weakening of immediate bullish momentum.

Wipro 25mins..Wipro in 25mins formed ascending triangle pattern.. breakdown or breakout.. wait and watch

Gold Intraday Trading Plan 5/5/2025As explained in my weekly post, I will engage selling order at the start of this week. As long as 3270 is held, gold in short term remains bearish.
I am looking for selling signals at around 3246-3250 level.
1st target 3200
final target 3165

APPLE Set To Grow! BUY!
My dear friends,
Please, find my technical outlook for APPLE below:
The price is coiling around a solid key level - 205.25
Bias - Bullish
Technical Indicators: Pivot Points High anticipates a potential price reversal.
Super trend shows a clear buy, giving a perfect indicators' convergence.
Goal - 208.36
About Used Indicators:
The pivot point itself is simply the average of the high, low and closing prices from the previous trading day.
Disclosure: I am part of Trade Nation's Influencer program and receive a monthly fee for using their TradingView charts in my analysis.
———————————
WISH YOU ALL LUCK

Notcoin—New Entry —Buy Now! Stop-Loss Trading ExplainedThe market always offers a second chance... Always.
Here Notcoin (NOTUSDT) encountered a rejection at "final resistance" and is now trading above support with a very nice higher low. This is a perfect place, a perfect zone to go LONG, accumulate buy and hold.
When the market is red or trading near support, or both, that's the time to buy.
Notice the retrace, after the steps pattern, the nice rise and then Notcoin found resistance. Five days challenging resistance and then a drop. This drop has been going for four days today. Total 9 days of not growing action which will lead to the resumption of the initial bullish wave.
In short, Notcoin will continue growing and is set to grow. The small drop is what we technical market analyst call short-term noise. Another thing we love to say is to ignore noise at all cost, and to never use a stop-loss because this can weaken your long-term earnings potential as well as result in selling when it is not right to do so. The strategy is to buy and hold because prices will climb so high so fast so soon, that you don't want to be caught selling lower than what you bought.
A stop-loss is simply a sell order but you place the order below your entry point. This makes no sense. When you buy, you can set up a sell order right away but it must be above your entry price. If you buy at 100, set a sell order at 200 or 300, for example. If you buy at 100 and set a sell order at 80 what do you think will happen? The bots will see this order and sell just because you are committed to sell something you bought at 100 for 80, a 20% loss. Instead, when you buy, always make sure to place your sell orders very high up... Very high. In this way, the bots will have to also buy in order to meet your sell requirement... And that's how your money grows.
Thank you for reading.
Namaste.
