EURUSD | Head‑&‑Shoulders on the Brink – Bears Eye 1.1250📉 Trade Thesis
A textbook Head‑and‑Shoulders has completed on the 30‑min EURUSD chart. Price is now testing the rising neckline drawn from mid‑April swing lows. A clean close and retest beneath that trendline opens room toward the next demand shelf and the lower boundary of the broader ascending channel.
🎯 Execution Plan
Entry: wait for a decisive candle close below the neckline, then look to short on a minor pull‑back into that broken support.
Stop: just above the right‑shoulder high to keep risk tight.
Target: the measured‑move objective sits near the channel median/support cluster highlighted on the chart; scale out as price approaches that zone.
🧩 Confluence Factors
Momentum loss: RSI made a lower peak on the “head” versus the prior thrust, signalling fading upside energy.
Event risk: upcoming NFP/ISM releases may fuel USD volatility, providing the catalyst for a break.
Structure: the right shoulder’s supply shelf has capped every rally since late April, reinforcing bearish pressure.
⚠️ Risk Management
Macro data can produce whipsaws—size positions accordingly and stick to the plan. Move stops to breakeven once price pushes convincingly away from the neckline.
For educational purposes only. Trade your own strategy & manage risk.
Chart Patterns

JYOTICNC | Buy @1180 | SL below 1040 | 1st Target 1560Disclaimer:
This is not financial advice. Please do your own research or consult with a financial advisor before making any investment decisions. Investments in stocks can be risky and may result in loss of capital.

Bitcoin Daily Bullish CUP pattern but with resistance coming in
Please excuse the number of lines here but this is my working chart and I am short of time but I wanted to share this.
Bitcoin Daily has printed a Bullish CUP and is back on the Rim but we have still to reach the edge of the Cup, which is expected around 15th May, 10 days. When PA entered thhis Cuo, it also ranged sideways for a while.....
Something that PA has to face in the near future is that red 236 fib circle. And PA may be already reacting to that.
Look to the left and see what happened last time we hit a red 236 fib circle.
I think we are in a stronger position this time though but a Drop to the Long term rising trend line is a very real possibility
That is around 92K - > 87K -Not a Major drop and it would actually play into the Bulls hands by resetting the Daily MACD that is already beginning to turn slightly Bearish
This is NOT a reason to PANIC or Sell but is more an opportunity, maybe the last one, to Buy BTC at around this price.
I think a drop back down to the 2.272 Fib extension at 77K is highly unlikely but we should have a plan should this happen.
We do have the DXY support group, sorry, THE FED announcing the Next decision of Rates on 7th and it is very likely that PA will Drop till then, slowly hopefully, resetting the MACD as previously mentioned, and then push through that 236 Fib circle after the continued Freeze on Rates is announced.
We have to wait and see......

mazagon dock looks niceMazagon dock - looks good. i opened it up cuz war starting and ships needed. and its above all time high(recent breakout). with a retrace. also a round bottom. looks gud

Bitcoin Ascending Broadening Wedge (4H)After a clean breakout above the macro downtrend, BINANCE:BTCUSDT rallied into its supply zone — but price action has since become increasingly volatile, forming a rising broadening wedge (also known as a megaphone pattern).
Pattern Insights
• The structure is defined by diverging trendlines, with each swing becoming larger and more erratic.
• This pattern often signals instability or exhaustion, especially near key resistance.
• While it can break either way, broadening wedges in an uptrend frequently resolve to the downside, especially when supply is overhead.
Key Levels
• Resistance: ~$ 98K-$99.5k supply zone — the upper boundary of the pattern.
• Support: ~$93.5k area — prior S/R, potential flip zone.
• Reversal: A breakdown below ~$93k could confirm a short-term bearish resolution and open the door to ~$88.5k.
• Continuation: A breakout above the upper boundary with volume could trap shorts and ignite a squeeze toward new highs.
Until then, BTC remains in a high-volatility structure, best approached with caution or as a range-trading opportunity.

OIL Reaching Crucial SupportOil is reaching an important support in the weekly timeframe. A 50% rise to $83 won't be surprising.

Trade outlook explain nzdusdTrade outlook explain nzdusd = 5-5-25
Trade idea for the week explained for my friend

TOTAL2 - Daily Rounded TopA Rounded Top structure
these patterns usually break out to the bullish side once completed as shown with the arrow
Right now this structure has perched itself above an MA and is looking to move higher
Good buy into alts right now in hopes of an altseason

EURUSD: holds gains above 1.1500EUR/USD is finding support at the start of the week, holding above 1.1300 in European trading. A weaker US Dollar, fueled by renewed trade worries and pre-Fed positioning, is boosting the pair ahead of the US ISM Services PMI release.
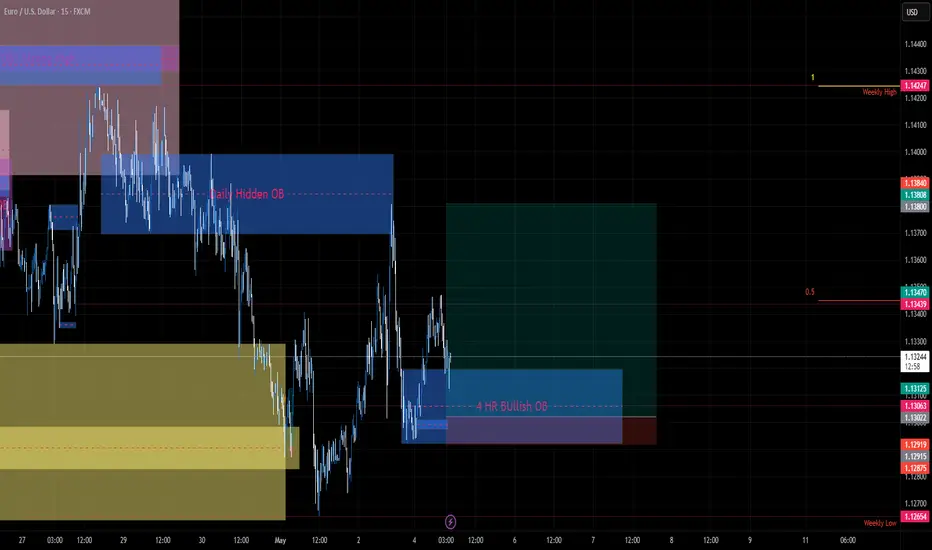
EURUSD 5/5/2025EU BUY. Using 4hr Bullish OB with a LTF POI as an entry , Expecting price to take Hidden oB. 4hr BUllish OB is in a weekly discount. Weekly high could possibly the main target if it goes my way.
US30 Stuck at Resistance – 05/05/2025🛑 US30 Stuck at Resistance – 05/05/2025 🛑
📈 Strong Bounce – But Watch This Supply Zone!
US30 ripped from the 36,700s all the way back above 41,000 🔥 — but now we’re seeing price stall just under a major resistance zone at 41,200–41,300. Bulls have full control for now, but signs of exhaustion are building 🥵.
🔍 Key Observations:
🔹 Price holding above 40,700 (key support)
🔹 41,200–41,300 = local resistance zone
🔹 42,359 = next major upside target 🎯
🔹 EMAs still bullish but starting to curve → 🌀 possible slowdown?
⚠️ Expect a squeeze or rejection play soon — market is winding up for the next breakout or pullback 💣.
🎯 Trade Plan:
🟰 Current range = 40,700 – 41,300
🔻 Lose 40,700 = retrace likely to 39,775, possibly 39,200
🚀 Break + close above 41,300 = upside open toward 42,359–42,787
🧠 Mindset Reminder:
🔁 Don’t chase highs! Wait for clean structure or rejection
⚡ When EMAs compress, expect volatility to explode
💎 Patience + plan = edge

Long ong bitcoin Long on bitcoin after testing suport around 95250. I think bitcoin is due for one more up before it corrects around 78K! completing wave B!

EURCAD SellsSell EURCAD based on this head and shoulders pattern. A bearish flag further confirms this sell move indicating some bearish movement towards sell side liquidity

Gold Price Analysis – XAU/USD 4H Chart | Supply Zone Rejection +Gold is currently trading at $3,259, showing signs of rejection from a major supply zone around $3,271 - $3,259, highlighted by LuxAlgo's Visible Range. The price tapped into the high-volume area and faced rejection, signaling potential downside.
Key Levels:
Resistance (Supply Zone): $3,259 – $3,271
Current Price: $3,259
First Support: $3,200 – price previously reacted here.
Second Support: $2,998 – a significant former resistance turned support.
Major Demand Zone: $2,576 – strong institutional buying area.
Bearish Bias If:
Price fails to reclaim the $3,259-$3,271 zone.
Break and close below $3,200 could trigger a move toward $2,998.
Momentum below $2,998 opens a path toward $2,576, especially if macroeconomic data favors USD strength.
Watch For:
Reaction near $3,200 (potential bounce or continuation).
NFP or major U.S. economic data (highlighted on the chart) that could spike volatility.
Trade Idea: Short-term traders may look for short opportunities if the current supply zone holds. Confirmation would be a bearish candlestick close below $3,200.
Risk Management:
Use tight stops above $3,271 to limit exposure. Monitor macro events closely.
---
What do you think – will Gold hold the $3,200 support or break lower? Drop your analysis below!
#Gold #XAUUSD #PriceAction #SupplyAndDemand #TechnicalAnalysis #LuxAlgo #Forex #Commodities #TradingStrategy #ChartAnalysis

Understanding the Inverted Cup and Handle Chart PatternUnderstanding the Inverted Cup and Handle Chart Pattern
Understanding chart patterns is fundamental for market participants. This article delves into the inverted cup and handle formation, a bearish signal indicating a potential downward movement. Explore its identification, trading strategies, psychological underpinnings, common pitfalls, and more to boost your trading knowledge.
What Is the Inverted Cup and Handle Pattern?
The inverted cup and handle, sometimes called an upside-down cup and handle pattern, is a bearish chart pattern that may appear during up- and downtrends. It is the opposite of the traditional cup and handle pattern, which is bullish. The inverse formation consists of two main parts: the "cup," which is an inverted U-shape, and the "handle," a small upward retracement following the cup.
Identifying the Inverted Cup and Handle Pattern
Identifying the inverse cup and handle pattern involves recognising a specific sequence of market movements that signal a potential bearish move. Here's a step-by-step overview of identifying this formation:
Cup Formation
- Shape: The pattern begins with an inverted U-shaped "cup." The price gradually rises, consolidates, and then begins to decline, reflecting a shift from bullish to bearish sentiment.
- Depth: The cup should have a rounded top, not a sharp V-shape, indicating a gradual reversal. The depth of the cup can vary but typically represents a significant portion of the preceding movement.
Handle Formation
- Upward Retracement: After the cup's formation, prices usually experience a minor upward retracement or consolidation, forming the "handle." This movement should be relatively short and not exceed the initial high of the cup.
- Shape and Duration: The handle often appears as a small flag or pennant and should be brief in duration compared to the cup. An optimal handle retraces no more than half of the cup’s depth.
Breakout Confirmation
- Neckline Break: The pattern is confirmed when prices break below the neckline, the lowest point of the handle. This breakout often leads to a significant decline in prices, signalling a bearish trend.
- Volume Surge: Volume typically decreases during the formation of the cup and increases as prices decline, especially during the handle formation. A substantial increase in volume during the breakout can validate the pattern and minimise the risk of false signals.
The Psychology of the Inverted Cup and Handle
The psychology behind the inverse cup and handle pattern is rooted in market sentiment and behavioural finance. This bearish pattern reflects a shift from optimism to pessimism among traders.
- Initial Uptrend: The formation starts with an upward movement, where traders are generally bullish, driving prices higher. This phase is marked by growing confidence and increasing demand.
- Formation of the Cup: As prices peak, consolidate, and start to decline, some traders begin to take profits, leading to reduced buying pressure. The rounded decline of the cup signifies a gradual shift in sentiment from bullish to bearish as traders become cautious and selling pressure mounts.
- Handle Formation: The minor upward retracement forming the handle indicates a brief period of consolidation where the market tests the resolve of buyers. It can be considered a dead cat bounce. This phase often traps optimistic traders who expect the uptrend to resume, but the overall sentiment remains fragile and cautious.
- Breakout and Decline: The decisive break below the neckline represents a culmination of bearish sentiment. At this point, selling pressure overwhelms any remaining bullishness, leading to a sharp decline. The volume surge during this breakout confirms the shift in market psychology from hopeful to bearish as traders rush to exit their positions or initiate short sales.
Trading the Inverted Cup and Handle Pattern
Trading the inverted cup and handle pattern involves careful identification and strategic decision-making to maximise potential returns. This pattern presents two primary entry points for traders: during the handle formation or after the neckline break.
Entry on the Break of the Handle
- Risk-Reward Advantage: Entering on the breakout of the handle’s lower boundary offers a better risk-to-reward ratio but requires more skill and confidence in pattern recognition.
- Technical Tools: Traders often use a medium-term moving average (like 21 periods) to confirm the downward leg of the handle. A decisive close below the moving average indicates a continuation of the downward handle leg.
- Momentum Indicators: Using momentum indicators like the RSI (Relative Strength Index) or stochastic oscillator helps confirm downward movement. Bearish divergence suggests that the bearish trend is likely to continue.
- Volume Analysis: Increasing volume during the handle's breakout indicates strengthening seller control. High volume often validates the pattern and potentially reduces the risk of false signals. Note that volume data may be less reliable in a decentralised forex market.
- Stop Loss and Profit Target: Traders typically place a stop loss above the handle's high to potentially protect against upward spikes. The reverse cup and handle pattern target is usually set at a distance equal to the cup's height, projected downward from the handle's breakout point, although it can be greater if the retracement is particularly shallow.
Entry After the Neckline Break
- Confirmation Advantage: Waiting for the neckline break offers greater confirmation of the formation but may provide a less favourable risk-to-reward ratio.
- Price Action: A decisive close below the pattern's low, ideally with a strong candlestick and minimal wicks, indicates a reliable breakout. This typically confirms the bearish trend and provides a clear entry signal.
- Volume Confirmation: Higher volume during the neckline break can further validate the pattern and indicate that the breakout is genuine and not a false signal.
- Stop Loss and Profit Target: In this scenario, the stop loss is typically set above the handle's high. The profit target remains the same, projecting the cup's height downward from the breakout point.
Common Mistakes to Avoid
When trading the upside-down cup and handle pattern, avoiding common mistakes is key for maximising potential returns. Some of the more common mistakes traders make include:
- Premature Entry: Entering a trade too early, before the handle completes or the neckline breaks, can lead to false signals and losses. Most traders wait for clear confirmation, such as a decisive close below the neckline with increased volume.
- Ignoring Volume: Volume is a critical component in confirming the pattern. Low volume during the breakout phase may indicate a fakeout. Traders typically look for a substantial increase in volume to validate the pattern.
- Incorrect Pattern Identification: Misidentifying the pattern is a common error. The cup should have a rounded bottom, not a sharp V-shape, and the handle should be relatively short. Accurate identification requires practice and attention to detail.
- Overlooking Market Conditions: External factors, such as news events or broader market trends, can impact the pattern’s reliability. Traders consider these conditions when planning their trades.
Advantages and Disadvantages
As with all chart patterns, the inverted cup and handle pattern comes with its pros and cons. Here are some key advantages and disadvantages of using this pattern:
Advantages
- Clear Signal: The pattern provides a clear signal of a potential bearish movement, helping traders anticipate market declines.
- Risk Management: With defined entry and exit points (handle high for stop loss and cup depth for profit target), it aids in effective risk management.
- Flexibility in Analysis: Several forms of analysis, from support/resistance and momentum indicators to volume and price action, can be used to trade the pattern.
- Versatility: Applicable across various timeframes and markets, including stocks, forex, and commodities, making it a versatile tool for different trading strategies.
Disadvantages
- Complex Identification: Accurately identifying the pattern can be challenging, requiring significant experience and skill.
- Rarity: The pattern doesn’t occur frequently, limiting trading opportunities.
- False Breakouts: Like all chart patterns, it is susceptible to false breakouts, especially if not confirmed with volume and other technical indicators.
- Timing Sensitivity: Entering too early during the handle formation can result in premature positions, while waiting for the neckline break might reduce the risk-to-reward ratio.
The Bottom Line
The inverted cup and handle pattern is one of the most popular chart patterns among traders of all levels. However, like any technical formation, it should be used alongside other indicators and sound risk management to potentially increase its effectiveness. By mastering patterns like the inverted cup and handle, traders can gain deeper insights into market psychology and price action to navigate volatile markets with greater confidence.
FAQ
What Is the Inverse Cup and Handle Pattern in Forex?
The inverse cup and handle pattern in forex is a bearish chart pattern. It features an inverted U-shaped cup followed by a small upward retracement (the handle). This pattern suggests that sellers are gaining control, and prices are likely to decline further once the neckline is broken.
How Can You Trade the Inverse Cup and Handle?
Traders can enter positions either on the break of the handle’s lower boundary or after the neckline break. Entering during the handle might offer a better risk-to-reward ratio, while waiting for the neckline break provides greater confirmation. Key tools to validate the breakout include moving averages, momentum indicators like RSI or stochastic oscillator, and volume analysis.
What Happens After the Reverse Cup and Handle Pattern?
After the reverse cup and handle pattern is completed, the price typically moves downward strongly. This bearish movement is often confirmed by a strong breakout below the neckline with increased volume, signalling a sustained decline in prices.
What Is the Opposite of the Cup and Handle?
The opposite of a cup and handle is the inverse cup and handle pattern. While the cup and handle indicates a bullish movement, the inverse version signals a bearish trend.
Is the Inverted Cup and Handle Bullish or Bearish?
The inverted cup and handle pattern is bearish. It indicates that the price will move downwards, suggesting that traders may open short trades.
This article represents the opinion of the Companies operating under the FXOpen brand only. It is not to be construed as an offer, solicitation, or recommendation with respect to products and services provided by the Companies operating under the FXOpen brand, nor is it to be considered financial advice.

XAUUSDHi ,
The market has consistently been rising as indicated in my yesterdays Analysis , The formation of series of HIGHER HIGHS $ HIGHER LOWS from 2nd May - 5Th May. This supports yesterdays idea on testing $3372 and infact went further up to $3380
If the fast EMA (8) is above the SLOW EMA (21) it then further supports the BULLISH COURSE.
If the RSI is hovering above 70 , this indicates the asset been OVERBROUGHT signaling a potential PULLBACK.
The PRICE consolidated before breaking out UPWARD , which indicates a CONTINUATION OF THE BULLISH TREND.
The current WAVES exhibits smooth pullbacks without DEEP CORRECTIONS , signaling STRONG BUYING PRESSURE.
The sudden SURGE in PRICE indicate INCREASING BULLISH MOMENTUM or a possible EXHAUSTION.
OVERALL we should hit $3372-85 and if the price breaks the zone and moves a little further it will signal further BUYS. If the PRICE breaks $3252 going down that should be your FALL CONFIRMATION.
Meanwhile i have a few buy positions active and waiting for further confirmation.

Trade Idea: $MSFT Short to $418 and beyond into JuneTriple bearish divergence is evident on Volume, RSI, and Momentum. The 9-count sell signal on the daily chart further supports the likelihood of a sell-off at this point. If the price falls below $425, a swift decline to $418 is anticipated, where the true test of the Fair Value Gap (FVG) below will occur. The Fair Value Gap open is at $392.45. Stop would be above yesterday's high at $439.50 ...

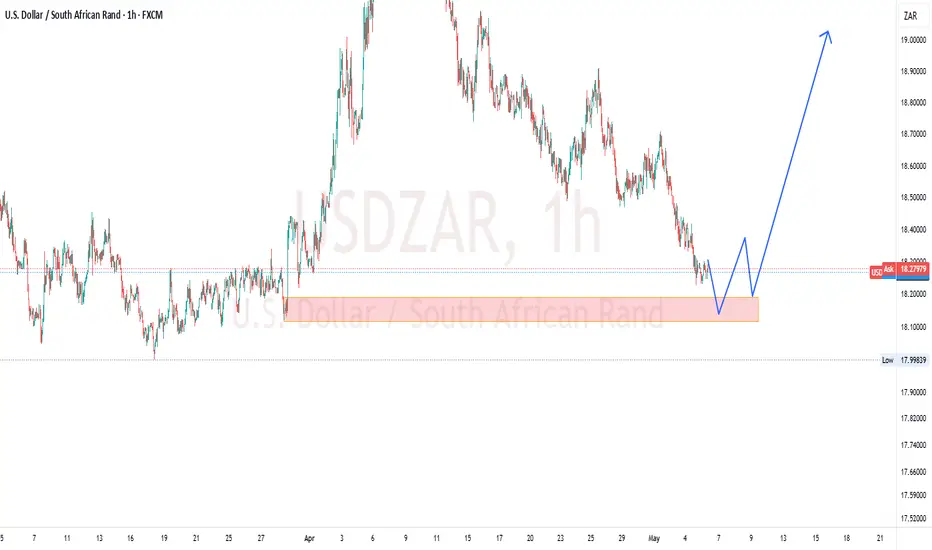
usdzarlooking for perfect entry to go long. as the bear has been happining for the past months, the moment price react to key level, i will only enter buy on confirmation
AUDNZD (4H) Symmetrical Triangle Breakout+Falling Wedge ReversalOn the 4-hour chart of AUDNZD, the market has completed a compression phase inside a symmetrical triangle, nested within a larger falling wedge structure. Both patterns suggest a potential bullish reversal after an extended downward trend.
The breakout occurred to the upside, with price moving above the triangle and breaking through short-term resistance around 1.0713. Volume increased on the breakout, confirming genuine buyer interest. If the price holds above this level and breaks 1.0766, it opens the path to the next major target at 1.0844, aligned with the previous key swing level.
Technical picture:
– Symmetrical triangle breakout confirmed
– Price also broke out of the falling wedge
– Volume expansion on the move
– Bullish realignment of EMAs is starting
– Holding above 1.0713 + breaking 1.0766 will activate the next phase
Fundamental backdrop:
The Australian dollar is benefiting from resilience in the commodity and export sectors, while the New Zealand dollar faces pressure from weakening inflation and growing expectations of monetary easing by the RBNZ. This economic divergence creates short-term advantage for AUD over NZD.
This double-pattern setup confirms the transition from consolidation to bullish impulse. Holding above 1.0713 and a confirmed break above 1.0766 would unlock a move toward 1.0844. These patterns offer clean early entries into trend reversals.

MILK Price Consolidation AnalysisMILK/USDT is showing signs of consolidation after a recent price drop. The current price of $0.1201 is hovering around the 30-day moving average, indicating a potential pivot point. Traders should watch for a break above the 10-day moving average ($0.1229) as a bullish signal.

BCOUSD | Bearish Crude oil is at the stage of testing trendline and is indicating to continue the bearish trend.

ONGC chart shows upside movement as price at demand zoneONGC chart shows upside movement as price at demand zone

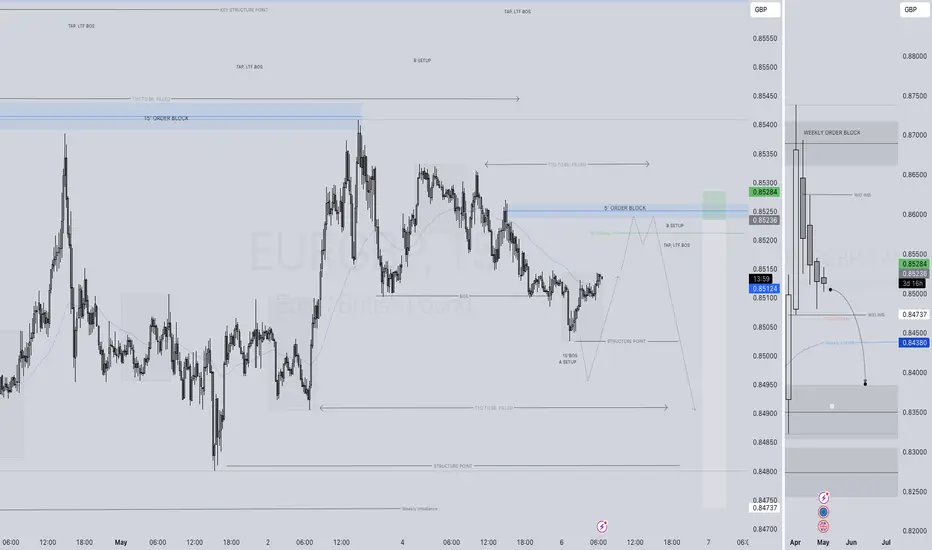
EURGBP SHORT FORECAST Q2 W19 D6 Y25EURGBP SHORT FORECAST Q2 W19 D6 Y25
Professional Risk Managers👋
Welcome back to another FRGNT chart update📈
Diving into some Forex setups using predominantly higher time frame order blocks alongside confirmation breaks of structure.
Let’s see what price action is telling us today!
💡Here are some trade confluences📝
✅Weekly order block
✅15' order block
✅Intraday bearish breaks of structure
✅Tokyo ranges to be filled
🔑 Remember, to participate in trading comes always with a degree of risk, therefore as professional risk managers it remains vital that we stick to our risk management plan as well as our trading strategies.
📈The rest, we leave to the balance of probabilities.
💡Fail to plan. Plan to fail.
🏆It has always been that simple.
❤️Good luck with your trading journey, I shall see you at the very top.
🎯Trade consistent, FRGNT X