Short Idea on EURUSDBased on :
- Periodic volume profile
- Seasonality
- Currency strength of usd and eur are weakest vs strongest
- small divergence on Poiv but on weekly timeframe is more evident
- Cot data
Chart Patterns

Bearish reversal?USD/JPY is rising towards the pivot which has been identified as an overlap resistance and could reverse to the 1st support which is a pullback support.
Pivot: 146.90
1st Support: 142.06
1st Resistance: 150.92
Risk Warning:
Trading Forex and CFDs carries a high level of risk to your capital and you should only trade with money you can afford to lose. Trading Forex and CFDs may not be suitable for all investors, so please ensure that you fully understand the risks involved and seek independent advice if necessary.
Disclaimer:
The above opinions given constitute general market commentary, and do not constitute the opinion or advice of IC Markets or any form of personal or investment advice.
Any opinions, news, research, analyses, prices, other information, or links to third-party sites contained on this website are provided on an "as-is" basis, are intended only to be informative, is not an advice nor a recommendation, nor research, or a record of our trading prices, or an offer of, or solicitation for a transaction in any financial instrument and thus should not be treated as such. The information provided does not involve any specific investment objectives, financial situation and needs of any specific person who may receive it. Please be aware, that past performance is not a reliable indicator of future performance and/or results. Past Performance or Forward-looking scenarios based upon the reasonable beliefs of the third-party provider are not a guarantee of future performance. Actual results may differ materially from those anticipated in forward-looking or past performance statements. IC Markets makes no representation or warranty and assumes no liability as to the accuracy or completeness of the information provided, nor any loss arising from any investment based on a recommendation, forecast or any information supplied by any third-party.

into the close May 5Some possible Bearish implications, but still the bias is up and another move higher can occur into tomorrow.

usdjpyi will love to hold on to buy bias, but i want to see price react to the demand level and look for buy confirmation on lower tf

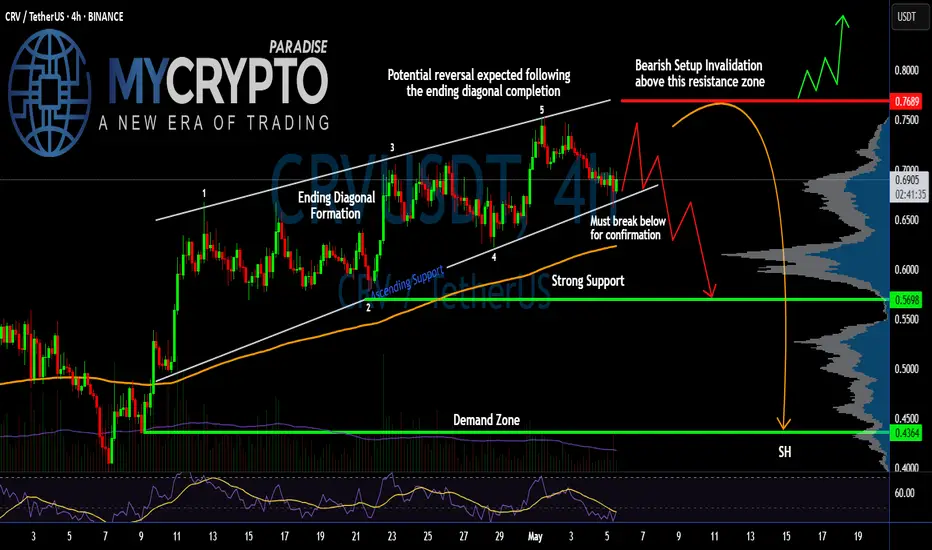
Is #CRV Ready for a Reversal or Not? Key Levels to Watch Yello Paradisers! Are we about to witness another brutal trap as #CRV finishes its final leg up and prepares to flush all late longs? Let’s break down the setup for #CurveDAOToken:
💎#CRVUSDT is currently trading around $0.6948, and what we’re seeing here is a classic Ending Diagonal Formation, a pattern well-known for luring in unsuspecting bulls before reversing violently. The structure has completed its five-wave sequence, and the price is now teetering just above key support.
💎The resistance zone near $0.7689 is where the whole game flips. This level has been clearly rejected before, and it now marks the invalidation point for any bearish outlook. A sustained move above this region with solid momentum would invalidate the diagonal and potentially send the price toward the $0.80+ mark. However, without that breakout, the bearish reversal remains the dominant scenario.
💎#CRVUSD is holding above rising trendline support, but this support is critical. A break below it confirms the end of the diagonal and should trigger a strong sell-off. The first target on a breakdown is the $0.5698 area, a zone previously respected and backed by significant volume profile interest.
💎If sellers gain traction and that level breaks down too, we’re watching for a move toward the demand zone at $0.4364, which aligns with the lower volume shelf—this is where the real pain could begin for over-leveraged traders caught on the wrong side.
Play it safe, respect the structure, and let the market come to you!
MyCryptoParadise
iFeel the success🌴
GOLD JUMPS ON ASIAN OPEN Geopolitical Tensions Fuel Early SurgeGOLD JUMPS ON ASIAN OPEN – Geopolitical Tensions Fuel Early Surge
Gold opened the week with a strong upside move during the Asian session, gaining nearly $30/oz in early trading. The bounce comes amid a weekend full of heightened geopolitical tensions and expectations of increased central bank activity later this week.
🌍 Geopolitical Backdrop:
Rising concerns over Russia–Ukraine and India–Pakistan flare-ups.
No official confirmation from governments yet, but the market is clearly on edge.
Former US President Donald Trump is reportedly pushing for an earlier Fed rate cut.
All eyes now turn to the FOMC meeting this week, with potential policy shifts that could stir further volatility.
These developments have re-ignited safe-haven demand for gold, making this week's opening surge a logical reaction to global uncertainty.
🔍 Key Technical Zones
Resistance levels:
3278 – 3288 – 3301 – 3314
Support levels:
3250 – 3246 – 3238 – 3224 – 3204
🎯 Trade Setups – 06 May 2025
🔵 BUY ZONE: 3246 – 3244
SL: 3240
TPs: 3250 → 3254 → 3258 → 3262 → 3266 → 3270 → 3280
Gold may continue its bullish run into the European session. A clean bounce from this support range could offer a solid risk/reward entry.
🔴 SELL ZONE: 3300 – 3302
SL: 3306
TPs: 3296 → 3292 → 3288 → 3284 → 3280 → 3270
If price rallies into this resistance cluster, look for signs of exhaustion for a potential intraday reversal trade.
⚠️ Weekly Outlook:
The FOMC meeting later this week will be key. A dovish tone may extend gold’s rally, while hawkish surprises could trigger sharp reversals.
Any new geopolitical flashpoints may also accelerate volatility — stay alert to global headlines.
Avoid FOMO — trade the reaction, not the prediction.
📌 Pro Tip: Let price come to your zone. Be patient, wait for confirmation, and manage SL/TP with discipline.

Request Network Long-Term Resistance & New ATH (PP: 1195%)The previous three weeks all closed green and were perfect full bodied candles. This is a strong signal on its own. But REQUSDT (Request Network) didn't print this signal in isolation, it is coming after a hammer candlestick pattern which is also a short-term and long-term higher low. Makes sense?
The market bottom was hit in September 2023. The three white soldiers, as it is called in candlestick reading, is an action signal. It confirms an advance will happen and the hammer candlestick pattern is a reversal signal. The long-term higher lows is a chart structure signal and it can help us project how the pair in question will behave in the future.
With a strong chart structure, we can predict a strong bull market for this pair.
With the action and reversal signal, we can predict the start of the next bullish wave within days. It is already happening because three weeks closing green is a decent amount of time.
The resistance zone on this chart is well established. This resistance was confirmed in May 2022 with a full rejection on a candle. The again in October 2022 there was a strong attempt by the bulls to push prices higher but another failure it seems.
In March 2024 there was another rejection, a strong one because this one cancelled a bullish wave. The final rejection at this long-term resistance zone happened in December 2024.
While the resistance range stays the same, the support zone has been growing from its base (higher lows).
Ok, I will make my prediction now.
» On the next advance, which is part of the current bullish wave, REQUSDT will break this long-term resistance and challenge $0.70 as the first strong target. After this level is challenged there will be a correction followed by additional growth. This additional growth will lead to a new All-Time High as part of the 2025 bull market bull run.
Thank you for reading and for your continued support.
Namaste.

USD/JPY) Bullish trand analysis Read The ChaptianSMC Trading point update
Technical analysis of USD/JPY on the 2-hour timeframe, and it presents a bullish continuation setup. Here's a breakdown of the key elements and the idea behind the analysis:
---
1. Ascending Channel Formation
The price is trading within an ascending channel, suggesting a controlled uptrend.
Higher highs and higher lows confirm the trend structure.
2. Key Support and Fair Value Gap (FVG)
There’s a well-identified support level where price has bounced before (highlighted in yellow).
A Fair Value Gap (FVG) zone is marked slightly above the support level, which could act as a short-term demand area.
Price is currently pulling back into this zone, potentially setting up a buying opportunity.
3. EMA 200 Support
The 200 EMA (~143.78) is acting as dynamic support just below the current price.
If price drops further, this level may offer strong technical support.
4. RSI Momentum
RSI is above 50 (currently 56.37), supporting the bullish trend and showing room for continued upside.
5. Target Point
The chart anticipates a bounce off the support/FVG zone and a rally toward the upper boundary of the channel, targeting 147.153.
Mr SMC Trading point
---
Summary of the Idea:
This is a bullish continuation setup within an uptrend channel. The analyst expects a potential long entry around the FVG/support zone, with a target at the channel top (147.15). Confluence from the EMA 200, RSI, and previous structure supports this bullish bias.
Pales support boost 🚀 analysis follow)

USDJPY NEXT MOVE Assumption of a Bullish Continuation (Without Confirmation)
• Disruption: The projected upward path to the “Double Top Resistance” presumes a bullish continuation without confirming signals (e.g., bullish candlestick patterns, volume spikes, or RSI divergence).
• Alternative View: Price is currently rejecting the resistance zone and heading downward—this could be the start of a deeper retracement or trend reversal, not just a dip.
⸻
2. “Strong Support” Zone is Based on a Single Bounce
• Disruption: The “Strong Support” zone is derived from a single historical reaction. It might not hold on the next test, especially if momentum and volume increase on the way down.
• Counterpoint: Stronger support typically comes from multiple prior reactions or a broader consolidation zone.
⸻
3. Lack of Consideration for Bearish Structure
• Disruption: The broader structure is bearish (from left to right on the chart), with lower highs and lower lows. The analysis skips over this longer-term downtrend context.
• Alternative: Instead of anticipating a return to 148, traders might watch for short setups if price fails to break back above the resistance cleanly.
⸻
4. Volume Decline During the Recent Rally
• Disruption: The bullish leg into early May shows diminishing volume. This divergence between price increase and falling volume weakens the bullish case.
• Warning Sign: Could indicate a bull trap, followed by a sharper fall through the support.
⸻
5. Overemphasis on “Double Top” without Neckline Break
• Disruption: The projected double top at ~148 assumes that level will be revisited. But without a confirmed breakout through 144.000, it’s premature to predict such a move.
• Risk: Traders buying now on this expectation may be caught in a pullback that dips below the “Strong Support.”


No Altseason Until BTC.D Hits 70%?Bitcoin Dominance (BTC.D) is currently climbing and approaching a major resistance zone between 71.38% and 73.06%. This area has proven to be a strong turning point in the past, acting as a top back in December 2017, September 2019, and again in 2021. These repeated rejections suggest that this zone is likely to remain a key resistance.
Right now, BTC.D is sitting around 64.66% and still has room to push higher. However, if it enters the resistance zone again, there’s a strong chance it may face selling pressure and start reversing. The white arrow on the chart shows the possible move into resistance, while the red projection outlines the expected rejection and potential decline back toward the 54.63% level—another important support zone from the past.
In simple terms, BTC dominance might be nearing its peak, and once it reaches the upper zone, we could start seeing altcoins gain more strength as dominance falls. This chart helps anticipate when the market might shift from BTC-led rallies to altcoin outperformance.

EURJPYMacro Economic Analysis / Fundamental Analysis
The ECB has kept the rates while also BOJ kept the rates at the moment. In the short term we expect the ECB to cut the rates whilst the BOJ to raise the rate, probably in the next meeting. So in overall, we expect the JPY to strengthen against the EURO.
Technical Analysis
We expect a liquidity sweep of the previous week candle, then a sharp fall of the EURJPY.

How to Trade Gold with AI-Powered Algos in 2025📊 How to Trade Gold with AI-Powered Algos in 2025
A practical action plan for serious gold traders
🔍 1. Know Why Gold Requires Custom Algo Tactics
Gold is volatile, news-sensitive, and driven by macro events like Fed policy, geopolitics, and inflation. Generic stock or crypto bots fail here — gold needs precise, event-aware automation.
🧠 2. Use AI-Powered Bots Trained for Gold Volatility
Deploy bots that adapt to real-time data like CPI releases, bond yields, and geopolitical headlines. Use machine learning models that detect gold breakouts, consolidations, and safe-haven flows.
Top AI algos for gold traders: Multiple systems based on MT4/MT5
Fully-automated, AI-based gold bot with breakout detection, precision entries, and built-in risk control.
⚙️ 3. Build or Choose the Right Algo Strategy for Gold
Trend-Following: Use 21/50 EMA crosses on H1 and H4
Mean Reversion: Bollinger Band fades in range-bound sessions
Breakout Algos: Trigger trades on CPI or FOMC event volatility
Volume-Based AI: Analyze volume spikes vs. historical patterns
🧪 4. Backtest Gold-Specific Models
Always test your bot using historical gold data, especially during NFP weeks, Fed meetings, and geopolitical escalations. Use data from 2018 to 2024 for high-volatility periods.
Tools: TradingView for Pine Script testing, MetaTrader 5 for EA deployment
🛡️ 5. Control Risk with Gold-Specific Parameters
Max drawdown: Keep under 15 percent
Stop-loss: Always use hard stops (not just trailing)
Position sizing: 0.5 to 1 percent of capital per trade
Use volatility filters: Avoid entries during thin liquidity hours
🔄 6. Automate Monitoring and Adaptation
Run multiple bots for breakout, momentum, and reversal setups
Use dashboards to track gold-specific metrics like VIX, USDX, DXY, and 10Y Treasury yields Integrate AI that adjusts parameters after major data releases
🚀 7. Prepare for 2025 Market Structure
Gold is increasingly driven by
Central bank digital currency rollouts
USD de-dollarization risks
Global stagflation or recession themes
DeFi and tokenized gold products
Your algo must factor in these macro narratives using real-time data feeds
📌 Gold Algo Trading Success Plan 2025
Use AI bots built for gold volatility
Trade high-probability breakouts post-news
Backtest with gold-specific macro filters
Maintain strict risk limits with max 15 percent drawdown
Monitor global news and macro data with bot triggers
Continuously optimize and adapt
Gold is not just a commodity — it’s a signal of global risk. Automate smartly, manage risk tightly, and use AI to stay one move ahead.

GOLD) Technical Analysi ) Breakout)HELLO 👋 Dear friend Gold Traders
technical analysis chart for Gold (XAU/USD) on the 4-hour timeframe. Here's a breakdown of the key elements:
1. Trendline Breakout
A descending trendline (marked by red arrows) has been broken to the upside.
The price has closed above the trendline and is retesting it, indicating a bullish breakout.
2. Support & Resistance
Support Level: Around $3,185–$3,200 – the price previously reversed from this zone.
Resistance Level: Around $3,480–$3,510 – a strong area where price may face selling pressure.
3. EMA Analysis
50 EMA (Red) is below the price, suggesting a short-term bullish trend.
200 EMA (Blue) is further below, reinforcing medium-term bullish momentum.
4. Forecast/Projection
There's a projected move towards the resistance zone around $3,500, as shown by the curved arrow.
The retest (labeled as "BARECKOUT" — likely a typo for "BREAKOUT") suggests a potential continuation upwards.
Conclusion
This chart shows a bullish breakout from a descending trendline, supported by EMAs and a clean retest. If the breakout holds, the next major target is the resistance zone near $3,500.

05/05/25 Weekly OutlookLast weeks high: $97,941.18
Last weeks low: $92,845.16
Midpoint: $95,393.17
FOMC week returns once again on Wednesday, the forecast suggests no change to the interest rate is expected with 4.5% staying as is. The tariff acceleration we saw last month brought into question the timing of rate cuts and if they would be brought forward, it looks like this FOMC is too early to see a cut but it is coming in the future if president Trump gets his way.
The chart is an interesting one but one that isn't too surprising. The orderblock that sent Bitcoins price to $74,500 was at ~$97,000, naturally that area would be major resistance and so a huge amount of Stop Losses were placed there, price swept that supply zone wiping out SL and SFP back under the resistance zone, a textbook move.
An accumulation under the resistance area would be a sign that the bulls are building to flip the zone, however a gradual sell-off from here would then look like a HTF lower high, a very bearish pattern.
Going into the FED interest rate decision there is usually a lot of de-risking/ sidelining from traders until the decision is made, therefor the second half of the week would give us more directional information.

USD/TWDLarge selloff driven by price action in a macro rising wedge
- Look for support hold
- Island bottom or bounce with a wick less than half the body candle
- Could see highs again by 2026/2027
- Could be a concern over Chinese invasion
- China says not ready until 2027 to do so

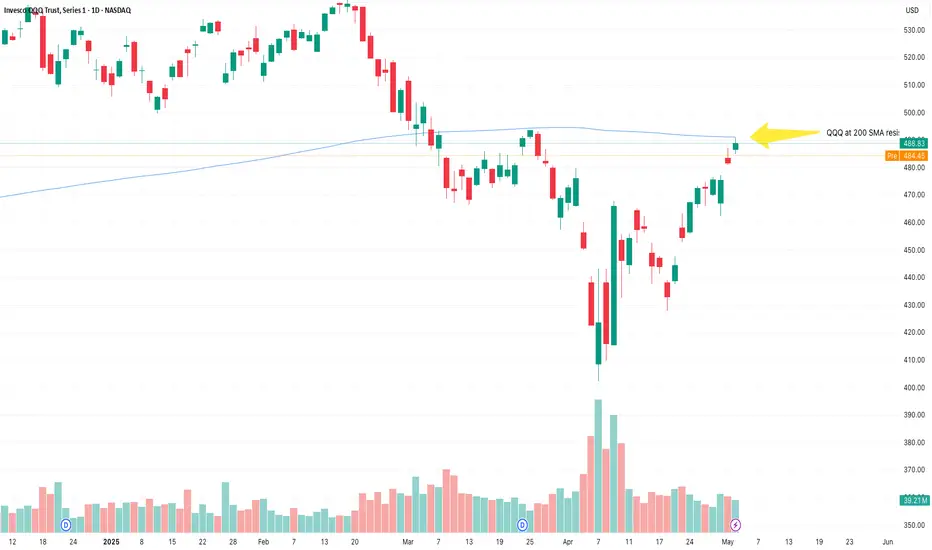
QQQ at SMA 200 resistance There might be some pullback here
I am staying bullish as long as it is above 477.58.
XAUUSD on sell#XAUUSD price have breakout 3300 and more which is now at 3315, we expect rejection between the upper rectangle.
Sell at 3315-3317, stop loss at 3335, take profit at 3295-3280.
If H1 makes a closure above 3330 or more then bullish next target is at 3400.

Although the bulls are strong, don't chase them at high levelsFrom the 4-hour analysis, the upper pressure in the evening is around 3336-3345, and the lower support is around 3280-3293. In the evening, we will continue to rely on this range to maintain the main tone of high-altitude low-multiple cycles. In the middle position, we will watch more and do less, and follow orders cautiously, and wait patiently for key points to enter the market. I will remind you of the specific operation strategy during the trading session, so please pay attention to it in time.
Gold operation strategy: 1. Gold rebounds to 3336-45 line, stop loss 3353, target 3280-3295 line, continue to hold if it breaks;
2. Gold falls back to 3280-3295 line and goes long, stop loss 3274, target 3325-30 line, continue to hold if it breaks;

Ethereum: Sell Or Hold? Panic Buy, Panic Sell or Panic Hold?If I were you in this situation, what would you do?
What would you do if you were not you in this situation?
Ethereum hit bottom on the 9th of April and the bottom is confirmed based on the same candle. It ended full green and with really high volume.
The action moved back above support on 22-April when the 3-Feb. low resistance was conquered. Ethereum now trades within a tight price range.
This range's support has been tested four times and it holds, Ethereum now trades higher but what will happen next? What would you do if I were me?
Market conditions can change in a day. Two days green, two days red it is all sideways, nothing changes and nothing has changed.
If you are still wondering if you should panic sell or panic hold right now all you have to do is panic buy because Ethereum is going up.
Ignore the short-term nothing because this chart isn't showing even noise. It is the consolidation of the higher low before additional growth.
Ethereum's chart looks very different to Bitcoin, it is incredible. Ethereum is no longer "#2" but more like an Altcoin, Bitcoin has its own chart while Ethereum has the chart of a medium sized Cryptocurrency pair. This is good, it tells us that Ethereum is about to grow really strong and will produce a new All-Time High in 2025. This All-Time High will be higher than 2021 because while this isn't Bitcoin it is still a very strong chart. Expect lower no more, panic buy followed by panic hold while you rest easy and relaxed because there is no panic when the market grows.
The only panic right now is on the short side because the bottom is in and the bears are gone.
Rest easy, do not let go of your coins. Hold strong.
Never ever use a stop-loss. Think long-term and the market will bless you with amazing results.
Namaste.

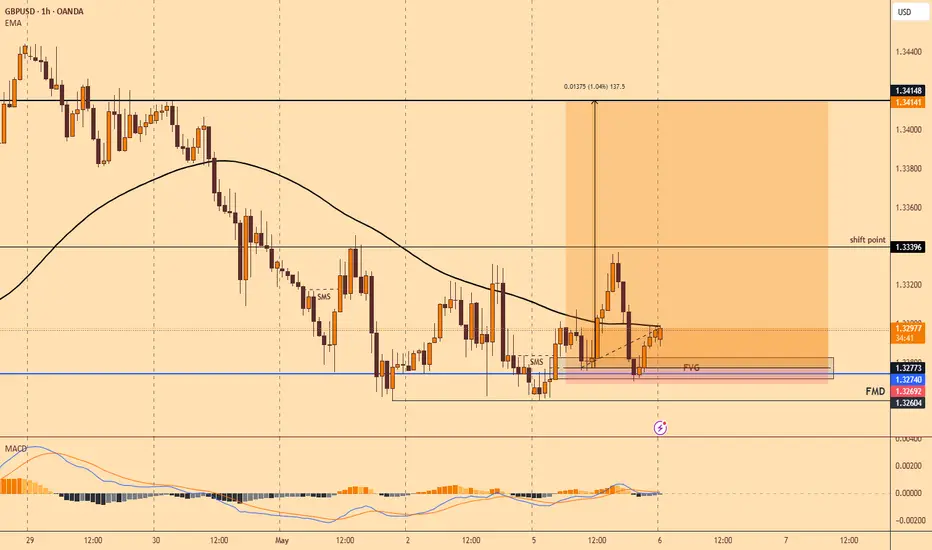
Bullish ScenarioH4 is bullish and on the m15 TF it made a shift is structure then a pullback to a FVG now we are expecting a rise in price up.
Gold XAUUSD is bullish in natureGold XAUUSD is a bullish pair so when it sells its for short reversals and market correction. I see a correction that would be corrected at 3160 area. I hope it reverses in a few mins at the close and start of the 4hr candle by 2pm. I hope gold reverses from 3227-3220 down to 3200 and then 3160 to correct the imbalance and give buyers an opportunity for better entry. I don't know when all these will take place. What do you think about my analysis? and what's your idea on Gold. its currently at 3220 area. Buy or Sell

EURGBP SELL TRADECMCMARKETS:EURGBP
Sell at 0.85378
SL at 0.85583
TP at 0.83353
Why sell..? Looking at the H4 TF. There is already a break to the downside signifying a chance of structure to the sell side.
And there is already two a touch retest on 0.85378 which verify a potential sell.
Coment below and let me know your opinion too.
