Chart Patterns

EURUSD Sell TradeEURUSD Sell opportunity.
Entry : 1.13713
SL: 1.13893
Tp: 1.09423
Am looking for a sell opportunity on EURUSD this week.
There is a likely for sell opportunity this week.
Comment your opinion below.

CAD_JPY BULLISH REBOUND|LONG|
✅CAD_JPY is going down now
But a strong support level is ahead at 103.888
Thus I am expecting a rebound
And a move up towards the target of 104.400
LONG🚀
✅Like and subscribe to never miss a new idea!✅
Disclosure: I am part of Trade Nation's Influencer program and receive a monthly fee for using their TradingView charts in my analysis.

Amd Break Above $104 Long To The MoonI Know A lot of people Dont Like AMD lol But it Might Just Be there< Ready To Breakout!!!
Earnings And If Spy Holds and runs This Forcast Is Very Well in The Books for it
📈 AlphaPulse Multi-Timeframe Forecast: NASDAQ:AMD
📍 Current Price: $100.59
🔍 Active Patterns: True S/R Zone, Channel Upside Breakout, Overbought Channel Position
🔀 Recent Crosses: Bullish 8/21 EMA Cross
🌐 Market Structure:
• Primary Trend: Mixed/Slightly Bearish
• Trading Bias: Bullish (49.2% confidence)
• Ideal Timeframe: weekly (Strength: 8)
🎯 Bullish Price Targets:
• Conservative: $113.15 (+12.48%)
• Primary Target: $125.70 (+24.97%)
• Aggressive: $138.26 (+37.45%)
• Expected Duration: 2-4 weeks
📊 Technical Position:
• Weekly: Consolidation
• Daily: Bearish Consolidation
• Intraday: Range Bound
🔑 Key Levels:
• Strong Support: $98.80
• Strong Resistance: $101.72
• Risk/Reward Ratio: 1:0.6
📈 Current Market Action:
• Weekly: Strong Downward Movement (-19.3%)
• Daily: Strong Upward Movement (+20.3%)
• 5min: Strong Upward Movement (+20.3%)
⚠️ Signal strength: 49.2% - 1 historical patterns analyzed
Safe Trades As Always

The Index US30 may form a long-term BUY trendBased on the analysis, the US30 may form a short-term BUY trend. Based on this analysis, we can try to enter a Buy position with a small risk margin.

USDCAD SHORT FORECAST Q2 W19 D5 Y25USDCAD SHORT FORECAST Q2 W19 D5 Y25
Professional Risk Managers👋
Welcome back to another FRGNT chart update📈
Diving into some Forex setups using predominantly higher time frame order blocks alongside confirmation breaks of structure.
Let’s see what price action is telling us today!
💡Here are some trade confluences📝
✅Intraday breaks of structure
✅Tokyo ranges to be filled
✅15' order block identified
🔑 Remember, to participate in trading comes always with a degree of risk, therefore as professional risk managers it remains vital that we stick to our risk management plan as well as our trading strategies.
📈The rest, we leave to the balance of probabilities.
💡Fail to plan. Plan to fail.
🏆It has always been that simple.
❤️Good luck with your trading journey, I shall see you at the very top.
🎯Trade consistent, FRGNT X

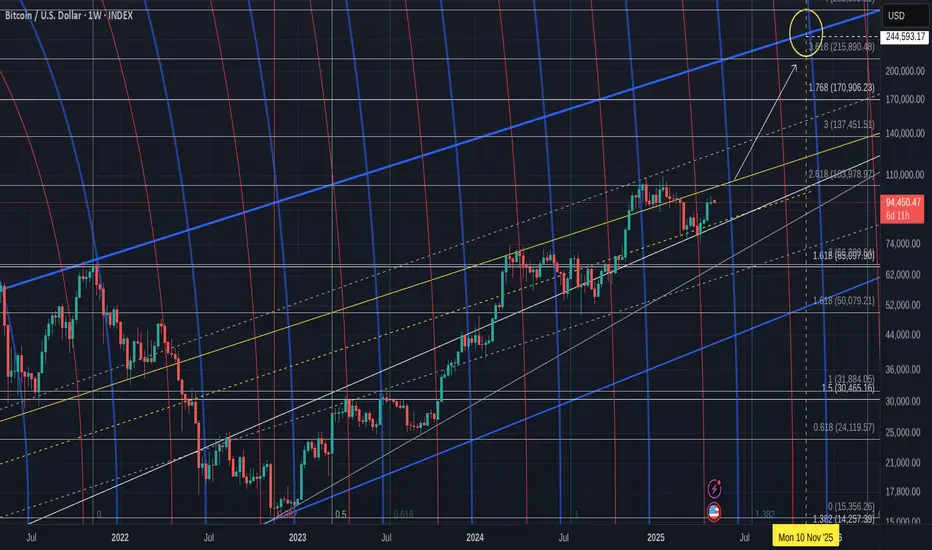
Bitcoin Weekly Long Term Chart showing realistic Cycle ATH
Bitcoin PA taking a breath of Air having pushed up off the lower trend line
Currently facing short term resistance as mentioned in the Daily chart just posted.
The Weekly MACD has yet to Croos its signal line ( red)
There is currently little reason to expect this to not happen.
PA currently sits Mid point of its rising channel with strong support below. We may well stay in this area till Mid Month, depending on the Macro influences.
The projected ATH in the circle top right of chart is on the ATH line created sine the 2017 ATH top.
It is a projection and an Expectation but there is confluence with many charts as to this Cycle Top price range. There are charts that show a Much higher price, though I feel they are possibly more pointing towards the Next cycle Top in 2029 ( If the cycle pattern continue as they have since 2017 )
We are on the edge of moves higher and we just need to remain patient......
Gold Buy Call #XAUUSDGold has broken out of a key resistance level at, $3,265 with strong bullish momentum and above-average volume, confirming the breakout. This move is supported by rising RSI and MACD crossover, indicating strength in the trend. The breakout from the consolidation zone signals renewed investor interest, likely driven by macro uncertainty and safe-haven demand.
Traders can consider initiating long positions at current levels with a stop-loss and take profit levels defined in the charts.

BTC (Post Weekly Close Update)BTC has seen a weekly close above the 93700 support, suggesting bullish strength and likely continuation if this level holds on the weekly. We remain bullish as long as 93700 is maintained; a drop below it would be the first SOW on the HTF, potentially targeting 89K–90K, and possibly 1D OB at 83K–85K. Technically, this remains a LH until the 99500 SH is convincingly reclaimed, ideally on a weekly close.
On the daily, however, we’ve observed the first SOW, closing below the SH at 95K after a rejection from the 1D supply zone, refined into MTF HOBs, where whales initially sold off aggressively. This isn’t alarming, but it warrants attention. With the SPX at resistance, the DXY at support, USDT.D closing the weekly well above the SL at 5.03, and TOTAL at resistance, these are signs of caution, in my view, despite the series of bullish news we’ve seen. That said, with the HTF remaining bullish, we’ll focus on exploiting LTF and MTF moves. The FOMC meeting on Wednesday could certainly bring volatility in the markets, particularly as BVOL24H and BVOL7D, as mentioned in the last update, are at support.👀
To further examine the weakness, note the contrast between the two horizontal ranges (grey boxes). The first range saw a BO followed by impulsive PA, smashing through the 90K key level. In contrast, the second range produced a BO but encountered an HTF supply, resulting in a notably weaker bounce compared to the first BO from the lower range. This could potentially manifest as a deviation if the price closes below the RL, making the 8D HOB at 89K–90K our next target.
On the LTF/ MTF, we’ve also seen a break below the TL, with the other resistance TL being respected, indicating further weakness. Although we haven’t yet seen HTF weakness, I believe a scalp-sized short from the 11H OB, refined into a 2H HOB at 95500 SH, makes sense with a tight invalidation, or from the MTF level around 97500, if provided. If the daily closes above 95500 again, I might consider a scalp long into the 1D supply for a potential DT or even the 100K psychological level.

GOLD Potential ReversalIt appears that we've reached a significant top in the market, with price action showing signs of a potential dump. Liquidity has been taken out at this level, and we are now looking at lower price targets, which align with the lines below, marking new liquidity points. These areas could serve as key support levels as the market tests them for further reaction.
The price structure suggests a possible drop to the target zones around 3,300 / 3,200 & 2970 where we could see renewed buying interest. Stay cautious as we approach these levels, as they may present opportunities for short entries ahead of the market correction.
Keep an eye on the evolving price action for further confirmations.

RISING WEDGE CHANNEL IN NATURALGAS📈 NATURAL GAS – 1H TIMEFRAME UPDATE
Natural Gas has been climbing nicely inside an upward channel, and right now it’s retesting the lower trendline after a strong rally last week.
🔸 Support zone: Around 306–307 (channel bottom)
🔸 EMA 55: Acting as dynamic support near 300 -295
🔸 Volume: Picking up on the recent dip — worth watching!
🔍 What to Look Out For:
✅ If support holds: We could see a bounce toward 315–322 levels.
⚠️ If it breaks below: Momentum may shift and pull price down toward the 295 region.
Let’s see if the bulls can defend the trendline!
💬 Drop your thoughts in the comments & hit the like if this helped!

Buy only on a confirmed close above $545 Breakout Traders: Buy only on a confirmed close above $545 with strong volume.
Target zones: $585, then $600+ based on the ascending triangle projection.
Sell Setup (if price opens & stays below $523): base on pre-market Chart If it still 522
Entry: $521–523
Stop Loss: $530
Targets:
TP1: $510
TP2: $500
TP3: $490 (extended)

BTC – Waterfall?Price rejecting after Friday's blow-out.
Flow wise it's not that sellers stepped in, more like the one or few buyers that were buying with no regard for price, finally stopped buying. Price is mean reverting here, looking for balance again.
Notice how H4 trend stopped supporting price, and now became resistance over the weekend, after which price flushed for the first time.
A correction to mid-high 80s would be very healthy and the best case scenario for bulls imo. Reset momentum and positioning a bit while making a higher low.
If we yearly open and local lows hold here, we can look for a short setup.
Also note that the highs are pretty bad, a push into +95k might trigger a lot of short stops and give us a quick move above the highs. Be careful with getting or staying bullish there, unless price is slow grinding up above the high, it is very likely just a fake-out.

KAVA ANALYSIS📊 #KAVA Analysis
✅There is a formation of Descending triangle pattern on daily chart 🧐
Pattern signals potential bullish movement incoming after a breakout.
👀Current Price: $0.4280
🚀 Target Price: $0.5380
⚡️What to do ?
👀Keep an eye on #KAVA price action and volume. We can trade according to the chart and make some profits⚡️⚡️
#KAVA #Cryptocurrency #TechnicalAnalysis #DYOR

XAUUSD-Bullish reversal analysis technical analysis of Gold Spot (XAU/USD) on the 4-hour timeframe, projecting a bullish outlook. Here's a breakdown of the main ideas conveyed:
1. Support Level & Double Bottom
A strong support level is marked around the 3,177 area, with the price bouncing from it twice (highlighted by two black dots), indicating a potential double bottom pattern, which is typically a bullish reversal signal.
2. EMA 200 Support
The 200 EMA (Exponential Moving Average) lies just below the current price (~3,177), acting as dynamic support. The fact that price is holding above it adds strength to the bullish argument.
3. Bullish Divergence on RSI
The RSI (Relative Strength Index) shows a bullish divergence, where the price made lower lows but RSI made higher lows—another potential reversal indicator.
4. Price Projection
If the bullish move plays out, the chart outlines two upward targets:
Target Point: ~3,501.67
Next Target Point: ~3,729.23
These are based on measured moves from previous impulse legs (shown by vertical blue projections).
5. Entry Setup
The chart suggests a break above the short-term consolidation could trigger the bullish run toward the first target, aligning with bullish price structure and support confirmation.
Overall Idea: The chart expects a bullish reversal from support, confirmed by double bottom, EMA 200 support, and RSI divergence, targeting higher resistance zones.

Bitcoin Dominance - BTC.D - AltcoinsYears of struggle to be inside for a subseason that lasts a few weeks.
For some it's financial freedom, for others it's the cornerstone of a reset story.
We're talking about Bitcoin Dominance.
Few know just how powerful it has become.
The only thing that is real is bitcoin. By the time everyone realizes this, 99.99% of investors will have lost all their assets.
And we will all regret buying altcoins instead of bitcoin at the end of the day.
I think the most extreme peak for bitcoin dominance in the short term is 73%.
Dominance is going to have a rough ride before it crosses this target.
We will see an altcoin season that will give small investors a breather.
Then we'll break 73% with a disruptive bitcoin dominance.
Bitcoin will show everyone again who is the real boss.

$MSTR regretting the missed shortJust steadily up the last month. Reversal candles coming in. Wish I had puts. I’m an idiot. Retrace to $350-$360.

USDJPY Will Move Higher! Long!
Take a look at our analysis for USDJPY.
Time Frame: 12h
Current Trend: Bullish
Sentiment: Oversold (based on 7-period RSI)
Forecast: Bullish
The market is on a crucial zone of demand 144.942.
The oversold market condition in a combination with key structure gives us a relatively strong bullish signal with goal 148.284 level.
P.S
We determine oversold/overbought condition with RSI indicator.
When it drops below 30 - the market is considered to be oversold.
When it bounces above 70 - the market is considered to be overbought.
Disclosure: I am part of Trade Nation's Influencer program and receive a monthly fee for using their TradingView charts in my analysis.
Like and subscribe and comment my ideas if you enjoy them!

Hanzo | Gold 15 min Retest 3275 – Confirm the Next Bullish Move🆚 Gold – Hanzo’s Strike Setup
🔥 Timeframe: 15-Minute (15M)
——————
💯 Main Focus: Bullish Retest at 3275
We are watching this zone closely.
———
Analysis
👌 Market Signs (15M TF):
• Liquidity Grab + CHoCH at 3265
• Liquidity Grab + CHoCH at 3318
• Strong Rejections seen at:
➗ 3270 – Major support / Key level
➗ 3325 – Proven resistance
🩸 Key Zones to Watch:
• 3272 – 🔥 Bullish breakout level X 7 Swing Retest
• 3325 – Strong resistance (tested 5 times)
• 3270 – Equal lows
• 3328 – Equal highs
Hanzo | Gold 15 min Retest 3275 – Confirm the Next Bullish Move

BTCUSD - [TRADE UPDATE]MARKET CONDITION
From my previous post i said i was anticipating a Accumulation, Manipulation & Distribution market profile and it seems like the first two phases has been completed. I would want to see huge movement to the downside this new week to start the Distribution phase.
TRADE UPDATE
I'm currently in a swing short from that daily supply zone and i'm still anticipating more downside going into the new week/month.
SUMMARY
I'll be observing Price Action and managing my trade accordingly. Drop your take on BTC in the comment lets break down some few things together.

GOLD 4H CHART ROUTE MAP UPDATE & TRADING PLAN FOR THE WEEKHey Everyone,
Please see our updated 4h chart levels and targets for the coming week.
We are seeing price play between two weighted levels with a gap above at 3282 and a gap below at 3224. We will need to see ema5 cross and lock on either weighted level to determine the next range. We have a bigger range in play then usual.
We will see levels tested side by side until one of the weighted levels break and lock to confirm direction for the next range.
We will keep the above in mind when taking buys from dips. Our updated levels and weighted levels will allow us to track the movement down and then catch bounces up.
We will continue to buy dips using our support levels taking 30 to 40 pips. As stated before each of our level structures give 20 to 40 pip bounces, which is enough for a nice entry and exit. If you back test the levels we shared every week for the past 24 months, you can see how effectively they were used to trade with or against short/mid term swings and trends.
The swing range give bigger bounces then our weighted levels that's the difference between weighted levels and swing ranges.
BULLISH TARGET
3282
EMA5 CROSS AND LOCK ABOVE 3282 WILL OPEN THE FOLLOWING BULLISH TARGET
3343
EMA5 CROSS AND LOCK ABOVE 3343 WILL OPEN THE FOLLOWING BULLISH TARGET
3404
EMA5 CROSS AND LOCK ABOVE 3404 WILL OPEN THE FOLLOWING BULLISH TARGET
3439
EMA5 CROSS AND LOCK ABOVE 3439 WILL OPEN THE FOLLOWING BULLISH TARGET
3503
BEARISH TARGETS
3224
EMA5 CROSS AND LOCK BELOW 3224 WILL OPEN THE FOLLOWING RETRACEMENT RANGE
3190
3138
EMA5 CROSS AND LOCK BELOW 3138 WILL OPEN THE SWING RANGE
SWING RANGE
3088 - 3046
EMA5 CROSS AND LOCK BELOW 3046 WILL OPEN THE SECONDARY SWING RANGE
SECONDARY SWING RANGE
3015 - 2988
As always, we will keep you all updated with regular updates throughout the week and how we manage the active ideas and setups. Thank you all for your likes, comments and follows, we really appreciate it!
Mr Gold
GoldViewFX

GBP/CHF – Bearish Flag Breakdown in ProgressThe pair has completed a textbook bearish flag pattern on the 4H timeframe, signaling a continuation of the strong downward move that started in early April. The recent consolidation channel (flag) has broken to the downside, confirming bearish momentum.
🔻 Technical Breakdown:
Price rallied in a corrective upward-sloping channel (bearish flag) following a steep sell-off.
Breakdown occurred with high volume and a strong bearish candle closing below channel support.
RSI has crossed below 50 and is heading lower, aligning with downside momentum.
Immediate support targets:
First: 1.0065
Final target: 1.0200 zone (projected based on flagpole height)
🔹 Trade Plan Summary:
Entry: Breakdown of the flag at ~1.0950
Stop-loss: Above the flag resistance near 1.1100
Take-profit 1: 1.0065
Take-profit 2: 1.0200 (conservative)
Extended TP: Potential extension further if momentum sustains
🛑 Risk Note: Be cautious of short-term pullbacks; a retest of the broken flag support could occur before continuation.

XAUUSD Channel Up intact and targeting the 1D MA50.Gold (XAUUSD) has been trading within a Channel Up since the October 30 2024 High and is currently on its latest technical Bearish Leg. The last pull-back tested the 1D MA50 (blue tend-line) before rebounding again.
As you can see the Low that this pull-back made was also on the 0.618 Fibonacci retracement level. On the current Bearish Leg, the 0.618 Fib is at 3155 and can make contact with the 1D MA50 within 1 week. That is our short-term Target, but depending on the Fed Rate Decision on Wednesday, it may be achieved earlier.
-------------------------------------------------------------------------------
** Please LIKE 👍, FOLLOW ✅, SHARE 🙌 and COMMENT ✍ if you enjoy this idea! Also share your ideas and charts in the comments section below! This is best way to keep it relevant, support us, keep the content here free and allow the idea to reach as many people as possible. **
-------------------------------------------------------------------------------
Disclosure: I am part of Trade Nation's Influencer program and receive a monthly fee for using their TradingView charts in my analysis.
💸💸💸💸💸💸
👇 👇 👇 👇 👇 👇
