Key Levels & Bullish Bias – Intraday XAUUSD Outlook for Nov 26Gold Market Analysis – M30 Intraday Outlook
- Gold continues to push higher on the M30 timeframe, maintaining a strong bullish structure after the previous breakout.
- Current price is around 4155–4160, showing clear buyer strength and healthy continuation behavior.
- From a structural perspective, the market continues to print higher highs and higher lows, confirming that bullish momentum is still dominant.
- As long as gold remains above the 4128 pivot zone, the probability favors further upside expansion toward the next liquidity targets.
Key Levels
- Pivot Level: 4128
- Resistance / Target Zone: 4185 – 4210
- Support: 4109
- Extended Support: 4083
Trading Recommendations
✅ Primary Strategy – BUY Bias
Buy above 4128
Target 1: 4185
Target 2: 4210
As long as price holds above 4128, bullish continuation remains the most likely scenario.
🔁 Alternative Scenario
If price breaks and sustains below 4128:
Target 1: 4109
Target 2: 4083
This signals a deeper pullback into previous demand zones before any continuation attempt.
Technical Insight
- RSI remains in bullish territory, supporting further upside momentum.
- Market structure is clean and bullish, with no confirmed reversal patterns at this stage.
What are your thoughts on GOLD? Comment now or join my group to trade with me on description
Chartpatterntrading

Major Pattern Formation in Rain IndustriesThis is the weekly timeframe chart of Rain Industries.
The stock is forming a Bow & Tie pattern on the long-term timeframe and is currently trading near the key support zone around ₹100.
The major support level near ₹80, based on the EMA, remains crucial.
If this support holds, the stock has the potential to move toward new highs in the coming sessions.
Thank You !!

What are your thoughts on GOLD?Hello Traders! 👋
Currently, GOLD has reached the upper resistance of the range and is showing signs of weakening — forming lower highs, suggesting buyers are losing strength and selling pressure may return.
🔍 Key Technical Highlights
Price reacted strongly at the 4120–4140 resistance zone.
Emerging pattern of lower highs, signaling bearish pressure.
Main support to watch: 4040–4060.
Short-term trend: bearish correction within the range.
Medium-term trend: neutral / sideways.
Current Expectation
If GOLD continues to fail at the 4140 zone, it’s likely that price will:
👉 Decline back toward 4060,
and potentially further to 4040, the bottom of the range.
📌 Trade Signal (Technical Setup)
Sell Setup:
Sell zone: 4120–4140
Stop Loss: above 4160
Take Profit 1: 4080
Take Profit 2: 4060
Take Profit 3 (extended target): 4040
Conclusion
GOLD remains in consolidation. Price is now at a key resistance zone and showing signs of exhaustion, so selling from 4120–4140 remains the preferred strategy. The overall structure is still sideways until the market breaks above 4140 or below 4040 with conviction.
Don’t forget to like and share your thoughts in the comments! ❤️

GOLD Bullish Momentum Confirmed – Key Trading Zones for 25 NOV At the moment, gold is transitioning into a short-term consolidation phase, preparing for the next directional move. This creates two important intraday zones for tactical trading.
🔍 Technical Outlook
Short-term trend: Bullish bias remains intact after the breakout.
Momentum: RSI stays above the midline → buyers still have control.
Market structure: The corrective pattern has completed; price is stabilizing before the next impulse.
Order flow: Evidence of accumulation at lower levels followed by aggressive buying.
These factors shape today’s intraday strategy.
Trading Setups (Technical Reference Only)
📌 Setup 1 – Timing Sell Zone
Potential area where short-term profit-taking may appear.
SELL Zone: 4185 – 4188
Take Profit: 4182 – 4177
Stop Loss: 4192
📌 Setup 2 – Timing Buy Zone
Support region where buyers may regain control.
BUY Zone: 4100 – 4103
Take Profit: 4106 – 4111
Stop Loss: 4096
📈 Conclusion
Gold respected the previous forecast with high precision, confirming the current strength of the bullish structure. For today, the two zones above serve as key tactical points, aligning with market structure, flow behavior, and momentum dynamics.

Kotak Near Crucial Support Zone — Opportunity AheadThis is the daily timeframe chart of Kotak Bank.
The stock is moving within a well-defined parallel channel, with a key support zone around 1950–2000.
When applying the Fibonacci retracement from the recent low to high, the 2050 level aligns as an important support area.
This 2050 zone is also confirmed by the pivot levels—whenever this level holds, the stock avoids further decline and maintains a range-bound movement. For the past month, Kotak Bank has been trading between two key pivot levels:
Quarterly Pivot: 2050
Monthly Pivot: 2120 (which will shift after monthly expiry)
A breakout above the monthly pivot can trigger further upside, with potential targets around 2330–2350.
If the support continues to hold, we may see higher levels in the stock.
Thank you.

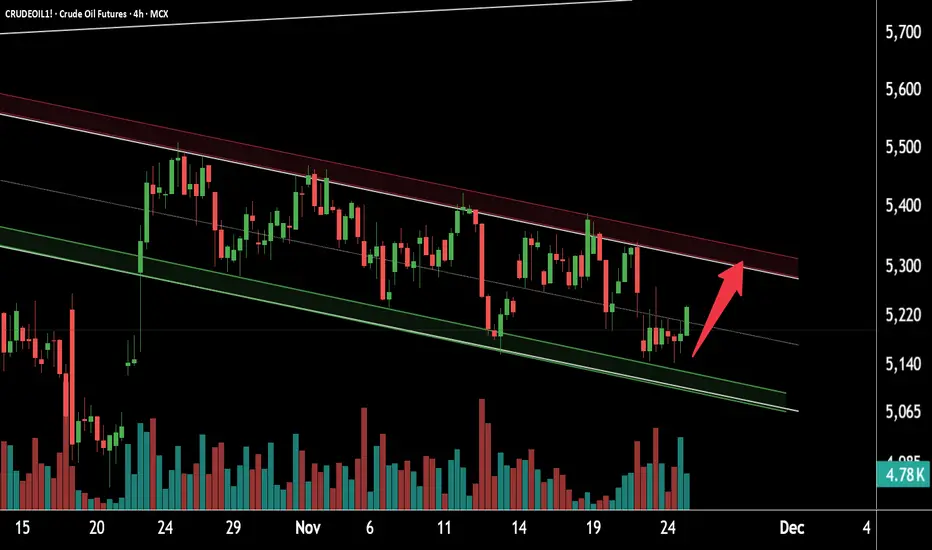
Crude Oil Showing Strong Upside SetupThis is the 4-hour timeframe support zone of Crude Oil.
The price is moving within a falling channel and is currently trading near the support zone at 5050–5100.
Crude Oil is respecting this support and has started taking a reversal.
If the momentum continues, the bullish move may extend towards the resistance zone at 5350–5400.
Thank you.
Rain Industries Forming a Bullish PatternThis is the weekly timeframe chart of Rain Industries.
The stock is forming a Broadening Wedge pattern with a key support zone near 90–100.
If this support zone sustains, we may see higher prices in Rain Industries.
Thank you.

Bearish Divergence on Weekly TF.Bearish Divergence on Weekly TF.
Resistance lies around 225 - 235
Currently moving in a Rectangular Channel.
Crossing 222 - 223 will trigger more positivity
towards 235 - 240 initially and then around 250-260.

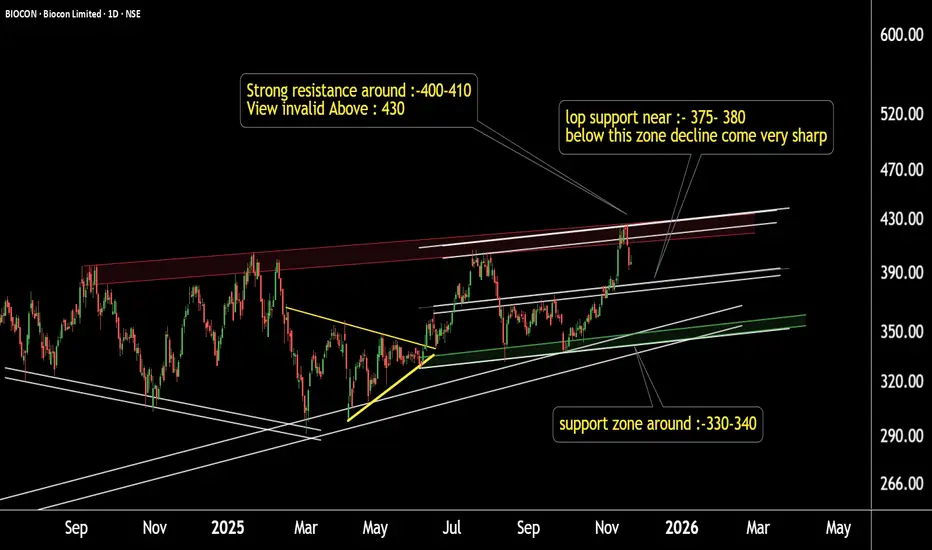
Biocon Under Heavy Selling Pressure — Momentum Turning WeakBiocon – Daily Timeframe Update
This is the daily timeframe chart of Biocon.
The stock is showing a sharp decline and may take a pause near its first LOP support at 370–380.
If this support breaks, the next strong support zone lies at 330–345, from where a potential reversal can be expected.
Thank you !!
MARICO Under Pressure — Sharp Fall on the Charts!This is the daily timeframe chart of MARICO.
MARICO is trading within a well-defined parallel channel and is currently falling from the upper resistance zone. This sharp decline may pause near the channel support.
The stock continues to respect the structure, with a key support zone around 700–710 and resistance in the 775–785 region.
If the current weakness extends, we may see a further drop toward the support area, followed by a potential bounce from those levels.
Thank you!!

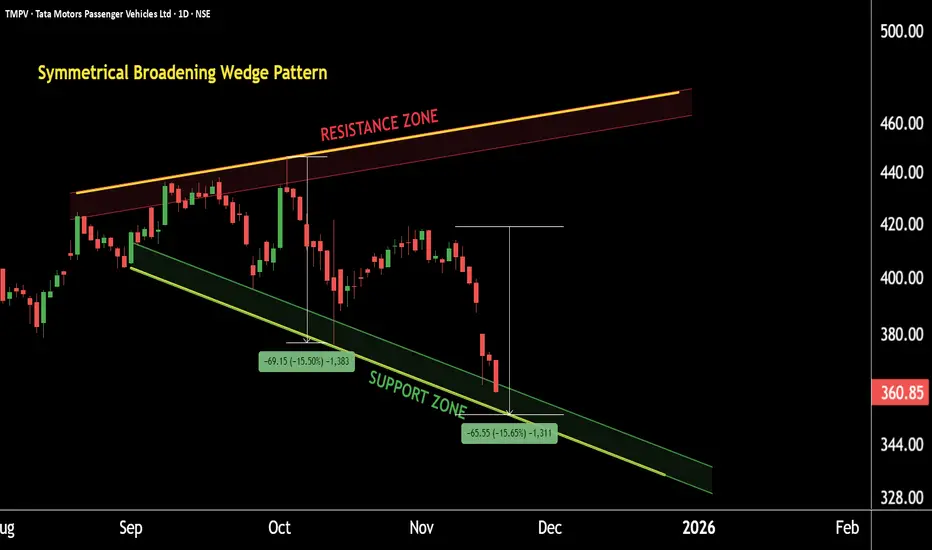
Tata Motors PV: A Big Pattern is Taking ShapeThis is the daily timeframe chart of TMPV.
TMPV is forming a Symmetrical Broadening Wedge Pattern with a key support zone near the 345–350 range.
The stock is also developing an AB=CD harmonic pattern within the broader structure, and the CD leg is completing near the same 350 support zone.
If the price continues to sustain above this support region, we may see higher levels like 400 and pattern price in TMPV in the coming sessions.
Thank you.
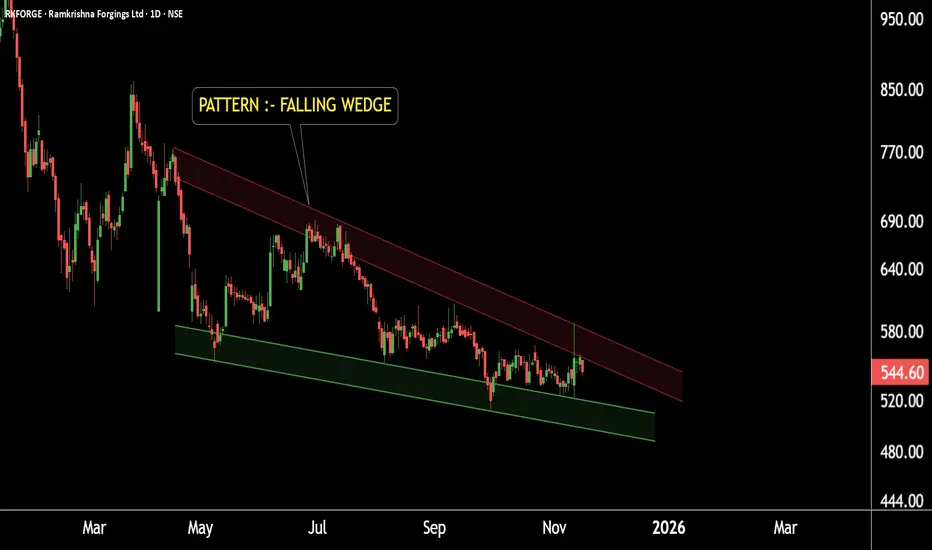
RK Forgings Showing a Clean Reversal Setup — Trend Change Ahead?This is the daily timeframe chart of Ramkrishna Forgings.
The stock is forming a well-defined pattern at a strong support zone near 490–510.
The pattern resistance is placed near 570, and a breakout above this level may open the path for a potential upside target toward the 710+.
If the support zone near 490–510 continues to sustain, we may witness higher prices in Ramkrishna Forgings.
THANK YOU !!
Gold Bearish Continuation Analysis
📉 Gold Market Analysis (45-min Chart)
Your chart shows a full transition from bullish trend → distribution → bearish trend.
Below is the step-by-step breakdown:
1️⃣ Previous Trend: Strong Uptrend
Price was moving inside a rising channel, creating:
Higher highs
Higher lows
Fair Value Gap (FVG) inside the channel
Breakout points showing bullish continuation
This structure remained intact until BOS (Break of Structure).
2️⃣ Break of Structure (BOS) → Trend Reversal
Price broke out of the ascending channel and then broke below structural support → confirming a bearish reversal.
This BOS is the key signal showing buyers losing control.
3️⃣ Current Phase: Range Consolidation
After BOS, price entered a range between:
Upper range: ~4,100
Lower range: ~4,020
This type of consolidation usually appears before another strong move.
Because BOS is bearish, the expected continuation is downward.
4️⃣ Liquidity Objective: 4,012 Target
Your chart marks TARGET 4012, and it aligns with:
Liquidity grab zone
Previous reaction area
Lower range boundary
Beginning of the order block
This makes 4,012 a high-probability bearish target.
5️⃣ Order Block Confirmation
Below the chart, there is a large order block zone (3,927–3,947).
If 4,012 is broken with momentum, price may later gravitate toward this deeper zone.
But for now, the nearest confirmed target is:
👉 4,012
6️⃣ Expected Movement (Short-term)
Price is currently retesting the breakdown area (small pullback).
From here, the expected path is:
Pullback → Rejection → Drop toward 4,012
(Bearish continuation)
---
📉 Summary
Trend shifted from bullish to bearish after BOS.
Price is inside a bearish range.
Momentum favors a continuation downward.
Short-term target: 4,012
Major support/order block below: 3,927–3,947
If you want this analysis in another language or want me to write a full signal, let me know!

Gold Price Retest Setup – Key Supply Zones in FocusGold (XAUUSD) has broken below its ascending structure, forming a clear weak low and shifting into a bearish environment. Price is now attempting a recovery toward two major supply zones highlighted on the chart.
The first reaction zone sits near 4099–4121, where sellers may re-enter. If this level is breached, price could extend toward the upper supply zone around 4160+, where a deeper retracement is expected.
Market structure shows earlier BOS, CHoCH, and a clear EOH, confirming the bearish shift. Until a strong reversal forms, rallies into marked supply levels may act as sell opportunities
Gold has broken its bullish trendline and formed a weak low, confirming bearish control. Price is now pulling back toward the 4099–4121 supply zone, where the first rejection is likely. If buyers push higher, the next strong supply sits near 4160, expected to cap any deeper retracement. Until these zones break with strength, rallies remain sell-biased.

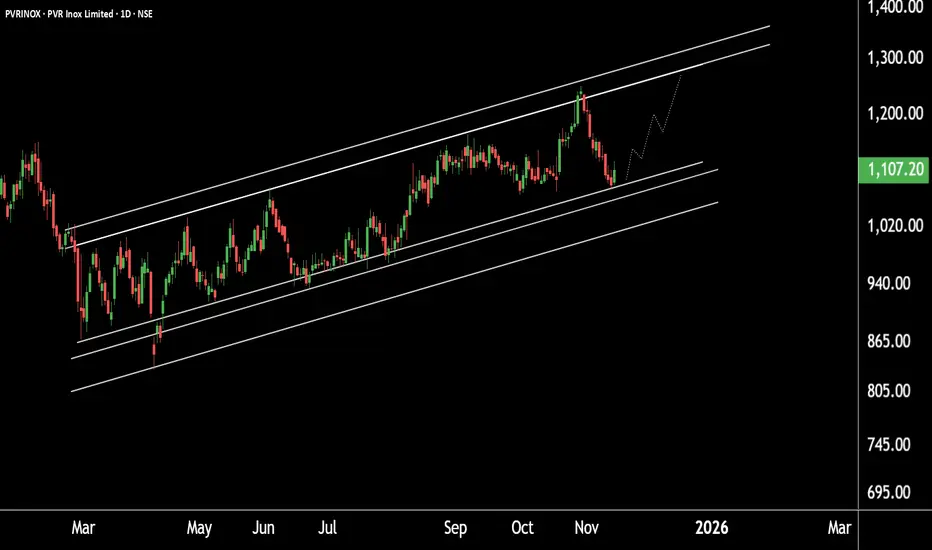
PVR Taking a Sharp Reversal from Strong Support – Rally LoadingThis is the daily timeframe chart of PVR Inox.
The stock is taking support near the upper boundary of the channel around the 1080–1100 range.
If the stock breaks this level, it has another strong support zone near 1000–1020.
If this support zone sustains, we may see higher prices in PVR Inox.
Thank you!
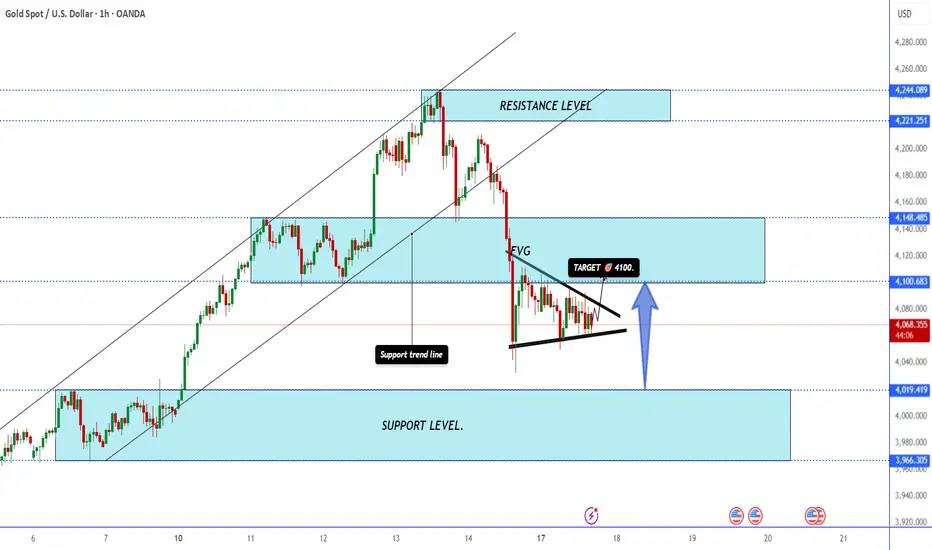
Bitcoin Reversal Setup Toward 96K TargetBitcoin is currently trading within a corrective structure after breaking down from the central zone. The chart highlights a fair value gap (FVG), a support level below, and a potential short-term bullish push toward the 96,000 target before any deeper move. The market remains in a ranging phase with key levels marked for possible reactions.

Gold Triangle Breakout Setup Toward 4100 ZoneGold is consolidating inside a symmetrical triangle after breaking below the mid-range zone. A potential bullish breakout could push the price toward the 4100 resistance zone, while the lower support zone remains a key level to watch.
Kalyan Jewellers : Possible Head & Shoulders Pattern ?This is the daily timeframe chart of Kalyan Jewellers.
The stock is moving within a well-defined parallel channel, with a strong support zone near the 440–460 range, which has already been respected as the stock bounced back from this level.
Currently, the stock is providing price-action support near the 470–480 zone.
If this level sustains and a bullish move begins from here, it will confirm that the stock has formed a Head & Shoulders pattern.
The potential target for this pattern lies in the 640–650 range.
Thank You !!

USD/JPY Rejection Signals Possible Drop Toward 154.300USD/JPY is reacting from a strong resistance zone, showing signs of rejection after multiple failed breakouts. Price is expected to pull back toward the Fair Value Gap (FVG) and may extend further down toward the 154.300 target, aligning with the mapped order block below.

CDSL !! Time to Be Cautious! Bearish Signals Getting StrongerThis is the Daily Timeframe Chart Analysis of CDSL
CDSL is currently forming a Rising Wedge pattern near the key resistance zone of 1680–1700. A breakout above this level with strong volume could lead to an upside target around 1800.
However, if the stock fails to break this resistance and the zone holds, we may witness a downside move. In that case, CDSL could retrace towards the range-bound support area of 1500–1520.
Thank you.

Silver Price Ready for Lift-Off: Bullish Channel Silver (XAG/USD) is consolidating within a rising channel, with strong Ichimoku cloud support hinting at a potential bullish breakout. After a brief pullback to the lower channel boundary, price action shows signs of rebound momentum targeting the $54 resistance zone. A confirmed break above $53 could trigger an upward move equal to the channel height, continuing the bullish trend. Traders are watching for a breakout confirmation above the midline for a potential long setup.
🧭 Chart Overview
Timeframe: 30-minute chart
Indicator: Ichimoku Cloud (9, 26, 52, 26)
Price: $52.67 (as of the chart time)
Trend Channel: Rising (ascending parallel channel)
---
📊 Price Action Analysis
1. Trend Structure:
The chart shows Silver trading inside a well-defined ascending channel, respecting both upper and lower boundaries.
Price recently bounced off the lower channel support, which often acts as a bullish signal within an ongoing trend.
2. Ichimoku Cloud (Kumo):
The price is hovering around the top of the Ichimoku cloud, suggesting neutral-to-bullish sentiment.
The cloud’s future span (Senkou Span A > Span B) points slightly upward — a sign of potential continuation of the uptrend.
Support lies near the $52.50–$52.60 zone, which aligns with both the lower channel line and the top of the cloud — a strong confluence area.
3. Momentum Observation:
The recent correction looks more like a healthy retracement than a reversal.
Buyers are likely waiting for confirmation before pushing higher.
4. Breakout Levels:
Immediate Resistance: $53.40 (mid-channel + previous top).
Major Resistance: $54.00 (upper channel target).
Support Zone: $52.50–$52.00 (Ichimoku + trendline confluence).
---
🚀 Bullish Scenario
If price closes above $53.40, it would confirm a breakout of the short-term consolidation pattern.
The projected move (based on the channel height) suggests a target near $54.50–$54.60.

Chart Analysis on SPY. Week of November 17 will be ImportantChart Analysis on SPY. Week of November 17 will be Important. Spy could go down to next support or next major resistance. Next week will be very interested

NVDA chart AnalysisI am sharing my NVDA chart analysis with other traders on how it can react or what potential prices it can go
