USD/CAD Bullish Setup: Key Support Holding for Potential Upside This chart represents a technical analysis of the USD/CAD currency pair on the 1-hour timeframe. Here's a breakdown of the key elements:
Key Indicators & Levels:
Exponential Moving Averages (EMA):
200 EMA (Blue Line): 1.43906 (Long-term trend indicator)
30 EMA (Red Line): 1.43859 (Short-term trend indicator)
Support & Resistance Zones:
Support Zone (Purple Area, Lower): Around 1.43658
Resistance Zone (Purple Area, Upper): Around 1.44500
Trade Setup:
Entry Point: Near 1.43753 (Current Price)
Stop Loss: Below 1.43658 (Red zone at 1.43158)
Take Profit Target: 1.45425 - 1.45433 (Blue zone)
Potential Trade Direction:
The price is expected to bounce from the support zone and move upwards.
A break above the resistance zone (~1.44500) would confirm bullish momentum.
The projected target is 1.45425 - 1.45433.
Conclusion:
Bullish Outlook: If the price respects the support zone and breaks above 1.44500.
Bearish Risk: If the price falls below 1.43658, the setup would be invalid.
EMA Perspective: The price is fluctuating around the 200 EMA, suggesting a potential trend shift.
Would you like a more detailed breakdown or any additional insights
Chatpatterns

Gold (XAU/USD) 30-Minute Analysis – Bearish Breakdown Towards $2Gold (XAU/USD) 30-Minute Analysis – Bearish Setup 📉
Key Observations:
Rising Wedge Breakdown:
The price has been moving within an ascending channel (EA TRADE LINE).
A potential breakdown is forming as the price approaches resistance.
EMA Levels:
30 EMA (Red, 2,986.22): The price is hovering near this level, showing potential weakness.
200 EMA (Blue, 2,950.00): This is the first major support level in case of a decline.
Bearish Projection:
A break below current levels could trigger a sharp drop.
The target zone is around 2,902.73 – 2,902.41, aligning with prior support.
Risk Management:
Stop-loss (Red Zone): Placed above 2,990.86 to protect against invalidation.
Take-Profit (Green Zone): Set near 2,902, offering a strong risk-to-reward ratio.
Conclusion:
Bearish Bias: A drop seems likely if the price fails to reclaim higher levels.
Confirmation Needed: A clean break of 2,980 could accelerate the move.
Risk Factor: If price reclaims 2,990+, the bearish setup might be invalid.
Would you like a refined entry strategy or more confirmation signals?

Bitcoin (BTC/USDT) Short Trade Setup | 30-Min Chart AnalysisThis chart is a Bitcoin (BTC/USDT) 30-minute timeframe trading setup from Binance on TradingView, showing a short (sell) trade setup with a stop loss, entry, and multiple take profit (TP) levels.
Key Observations:
Indicators Used:
200 EMA (blue line at 83,177.82 USDT) – Long-term trend indicator.
30 EMA (red line at 84,064.45 USDT) – Short-term trend indicator.
Trade Setup:
Entry: 84,423.01 USDT
Stop Loss: 85,315.76 - 85,330.89 USDT (Above the recent high)
Take Profit Levels:
TP1: 84,064.45 USDT
TP2: 83,953.94 USDT
TP3: 83,439.48 USDT
Final Target: 81,850.69 USDT
Market Context:
Price recently tested the 30 EMA and is potentially rejecting it.
Bearish outlook: If price fails to break higher, it may drop to TP levels.
Risk-to-Reward Ratio (RRR): Favorable since the potential reward is significantly greater than the risk.
Possible Trading Plan:
✅ Entry at 84,423.01 USDT
✅ Stop Loss at 85,315.76 USDT (to protect capital)
✅ Take Profits at TP1, TP2, TP3, or full exit at 81,850.69 USDT
Would you like further insights or adjustments on this trade?

GBP/USD 30-Minute Bearish Trade Setup & Analysis200 EMA (Blue) at 1.29285 – Represents long-term trend support/resistance.
30 EMA (Red) at 1.29329 – Represents short-term trend direction.
Trade Setup:
Entry: The trade seems to enter near the 30 EMA after price rejects a resistance zone (highlighted in purple).
Stop Loss: Placed above the resistance zone at around 1.29564 - 1.29568.
Take Profit Levels:
TP1: ~1.29250
TP2: ~1.28996
TP3: Final target at ~1.28827
Market Analysis:
The price has rejected the 30 EMA, signaling potential bearish movement.
The downtrend projection suggests a possible break below 1.29250, aiming for the lower support levels.
The risk-to-reward ratio appears favorable, with a tight stop loss and multiple profit-taking points.
Possible Scenarios:
Bearish Case (High Probability): If price stays below the 30 EMA, it may continue down towards the target points.
Bullish Case (Low Probability): If price breaks above the resistance zone, it could invalidate the short setup, triggering the stop loss.
Would you like a deeper analysis or confirmation with another indicator?

Gold (XAUUSD) 15-Minute Chart Analysis – Bullish Trade SetupGold (XAUUSD) 15-Minute Chart Analysis
Key Observations:
Price Action:
The price is currently at $2,981.96.
The price has been in an uptrend, forming higher highs and higher lows.
Moving Averages:
EMA 30 (red line): At $2,965.00, acting as a dynamic support level.
EMA 200 (blue line): At $2,935.17, indicating a long-term bullish trend.
Trade Setup:
Entry Level: Around $2,981.96.
Stop Loss: Placed at $2,966.81.
Take Profit Targets:
TP1: $2,985.86
TP2: $2,992.23
TP3: $2,998.08
Final Target: $3,005.50
Risk-Reward Ratio:
The risk is defined by the distance between the entry price and the stop loss.
The reward is defined by the distance between the entry price and each take-profit level.
Given the setup, the trader is aiming for a favorable risk-to-reward ratio.
Trading Perspective:
Bullish Bias: The trend is strongly bullish, supported by the EMA 30 and EMA 200.
Confirmation Needed:
If the price sustains above $2,985, it increases the probability of hitting higher targets.
A break below $2,970 could invalidate the trade setup.
Would you like a deeper analysis with Fibonacci levels or volume data?

Hi! Let’s analyze Cardano (ADA) and create a trading strategy!Current Price: $1.120
All-Time High (ATH): $3.10
RSI: Approaching the overbought zone, which could lead to a short-term pullback.
What’s on the chart?
Cardano is maintaining its strong upward momentum, moving confidently within a bullish trend. The breakout of key resistance levels is supported by increasing trading volumes. However, technical indicators suggest that a short-term correction might occur before the next upward move.
When I analyze the market, I always focus on a few critical aspects:
1️⃣ Trend: ADA is currently in a strong uptrend, supported by increasing volumes and strong buyer activity.
2️⃣ Support and Resistance Levels: Key resistance is around $1.30, while support is located at $1.10 and $1.00.
3️⃣ Volume: Rising trading volumes confirm the strength of the current trend.
4️⃣ Indicators: RSI (Relative Strength Index) is nearing the overbought zone, signaling the possibility of a short-term correction.
I rely heavily on Midas Multi Indicator, which helps me see:
Entry and exit points.
Market manipulations by big players.
Support and resistance levels.
This tool saves time and provides a clearer understanding of the market. However, it’s important to remember that it’s just a tool, not a magic button. You still need to think critically and analyze the market yourself.
My Trading Plan:
Buying Strategy:
Enter partially at the current levels.
Set limit orders at $1.10 and $1.00 to average in case of a short-term correction.
Selling Strategy:
Take partial profits around $1.50 - $1.65 (the next resistance zone).
Hold the remaining position for a potential move back to $3.10 (ATH) or even higher if the trend continues.
Important Reminder:
I’m sharing my actions and strategy, but this is not financial advice. Every decision you make should be well-thought-out. I trade with my own capital and take full responsibility for my mistakes.
Trading based solely on other people’s signals is not a sustainable approach. No one can choose the perfect entry or exit points for you. Tools like Midas Multi Indicator can help you better understand the market, but it’s essential to use your own logic and analysis alongside them.
Risks and Opportunities:
Risk Level: Moderate (a correction could happen at any time).
Timeframe: 2–6 weeks.
Potential Profit: +165% if ADA retests its ATH.
Let’s Discuss!
What are your entry points and targets for ADA? Share your thoughts in the comments — let’s analyze and find the best opportunities together!
And, of course, don’t forget to like this post 🚀 if you found it useful! Your feedback motivates me to share even more valuable insights.

GOLD TECHNICAL UPDADE GO AND >READ THE CAPTAN BuddyS Dear friend 👋
Gold trading signals technical analysis fundamental analysis Update)
BuddyS Gold 1D Time Frame 🖼️ looks like high Volume Buying said technical analysis looks fisrt testing supply zone 2686📈
That is big resistance level pullback down trand 🙊📉 down trand target 🎯 2506 long time Trade ) First Hit limit trade entry ☺️
signals 🚀 buying side 2622
Target 2640 2680 OANDA:XAUUSD TVC:DXY
Signals selling side 2686
Target 2650 2500
Follow risk management ❤️
Support ✴️ My hard analysis setup like And Following Me 🤝 that star ⭐ off game 🎮 📉📈

EUR JPY Trade Setup 30 mins timeframe. EUR JPY has formed an head and shoulders pattern on the 30 mins timeframe.
This pattern was formed at the 4 hour resistance level.
Now we need to see a soild candlesticks confirmation pattern before going short.
Don't trade all the time, trade forex only at the confirmed trade setups.

GOLD 3 H TIME FRAM Full ? UPDATE READ THE CAPTION)Hello traders what do you think about Gold pair
Gold pair technical analysis
Gold pair price all time high 2267 resetting low support levels 2228) buyers reject level 2227) Gold pair price pullback bullish RSL 2267) now market breakdown of resistance levels 2267) I think 💬 Gold pair price if the 2270 possible for confirm Next Movie 2300)
Berish diamond levels buyer's
don't reject this resistance 2267 I think Gold pullback Berish fall same big support levels of 2228 breakout Next support 2205
2183 _ 2123
Gold sell 2300
TP ^ 2280
TP ^ 2270
SL. 2306
Gold sell. 2261
TP ^ 2250
TP ^ 2240
TP 2230
SL. 2267 .
Follow Must risk management
Safe trade don't forget like this analysis.

🤽♂EURUSD bullish pullbackEUR/USD Technical Analysis 📉📈📊
Current Price: 1.08360 🟢
Recent Pullback: The EUR/USD pair retraced from the level of 1.07980.📉📈📊
Retest of Support: It's currently retesting the support level around 1.08260, indicating a potential bullish sentiment.
Trade Target: The next significant resistance level lies at 1.08881, which presents an attractive target for bullish momentum.📉📈📊
Trading Plan:
- Entry: Consider entering a long position if the price breaks convincingly above the resistance level at 1.08260.
- Stop Loss: Place a stop loss below the support level to manage risk in case of a reversal.
Take Profit Aim for a take profit level near the resistance at 1.08881, capturing potential upward movement.
Risk Management Always adhere to proper risk management principles, ensuring that potential losses are controlled and manageable relative to the trading account size. ❤️👍 Good luck 🤞
Pales safe trade 🙏❤️ don't forget like and comments

#XAI/USDT SPOT LONG ENTRY#XAI/USDT SPOT LONG ENTRY
Leverage: 1x
Entries: $1.1703
Take profit 1: $1.3003
Take profit 2: $1.5026
Take profit 3: $1.9794
Stop Loss: $0.9854
NOTE: This is just my prediction. Be sure to use STOPLOSS and remember that I am not a financial adviser. your money, your risk!
Thanks
The sroced.

💥🔥GBPJPY ) analysis) retest Rsl)hello trader’s what do you think about gbpjpy)?
gbpjpy a good time for buying zoon
retest hitting bearish analysts patterns now wai if breakout moves)
key levels 184.309
key levels 185.498
key levels 187.360

🚀🚀 Tesla bullish analysis )💥💥Hello trader’s what do you think about Tesla)
traders Tesla market share prices breaking down retest prices up Rsl)
key levels 248.20
key levels 270.17
key levels 278.01
key levels 297.89
t's year-end and Tesla is in the midst of its final push to meet Wall Street expectations for a record quarter. It won't be easy for the battery-electric vehicle leader to sell almost half a million cars amid higher interest rates and more EV competition. Instead of price cuts, Tesla is using a new tool to move metal: Incentives.
Barron's looked at incentives on Tesla vehicles in inventory. Buyers can get almost $4,000 off several Model Y vehicles plus six months of free supercharging. The charging benefit can be worth roughly $900 or more, depending, of course, on how committed any driver is to using the free charging.
Total incentives can amount to more than 8% of the transaction price. The average incentive on new U.S. car sales in October was about 5% of the transaction price, according to automotive data provider Kelly Blue Book.
That's lower than Tesla, but Tesla's average incentive levels would be lower than 8%. Most Tesla vehicles are ordered with specific configurations from the company's website.
U.S. auto industry incentives have been creeping up for months. They averaged less than 3% of transaction prices for much of 2022, historically low levels, and down from about 9% of the average transaction price in October 2022.
Today, incentives at Tesla span its lineup of vehicles. Incentives on some Model 3 vehicles can amount to almost 10% of the price, including free charging benefits. Tesla is also offering some Cybertruck reservation holders $1,000 off Model S and X vehicles.
(Some Cybertruck orders won't be delivered until 2025. Reservations holders might be interested in another vehicle meanwhile.)
Tesla is trying to have a bounceback quarter after delivering about 435,000 vehicles in the third quarter, down from about 466,000 delivered in the second quarter. Wall Street is looking for about 475,000 units for the fourth quarter, which would be a record for the company.
Tesla delivered about 405,000 units in the fourth quarter of 2022. Wall Street was looking for about 420,000 units and the stock fell more than 12% on the first trading day of 2023. Slowing deliveries also foreshadowed Tesla's 2023 price cuts.
The performance version of a Model Y started at about $63,000 late in 2022. It starts at about $52,500 now.
Tesla stock has weathered the price cuts. Shares started 2023 at about $123 a share. They dropped to almost $100 a share after the disappointing delivery results and subsequent price cuts. Shares enter the week at almost $244 each, up more than 100% from 2023 lows. The strong performance raises the stakes for a fourth-quarter delivery number that typically gets reported on Jan. 2.
After digesting the delivery figure, investors will have to evaluate what higher incentives mean for profit margins. Third-quarter operating profit margins were 7.6%, down almost 10 percentage points year over year.
Wall Street expects operating profit margins in the fourth quarter to come in at about 9%. Doing that with rising incentives will be another challenge for Tesla.🙏💥

Gold next move 💥💥👇hello trader’s what do you think about Gold usd ) analysis ideas 💡??
…………………………………………………🧐
Gold usd …………………………….🧐
Analysis …………………………………🧐
Support levels………2068———🎚️
Support levels………2026———🎚️
Resistance levels ………2147
Trader’s follow support and )resistance levels 👍🏻💡)
Pales like 👍🏻 and comments)

Shibaiusdt... chart analysis In the 30-minute time frame, we will go up to the extent of the previous peak, but around the numbers 965 to 1000, which is Shiba's resistance, it is not clear whether it can go up or quickly go up after the pullback.

ETHUSD may be possible go down side May be possible ETHUSD can b fall approx. 40-50 points from here through my analysis

CAD JPY SET UP Hello guys,
CAD JPY has been moving in an ascending channel, and the price has reached the support trend line. Do you think the price will break through or bounce? I expect a bounce, so I'm waiting for the BUY confirmations.
If the price breakthrough, I will be looking to go short after the retest of the broken support level, tell me what you think guys.

UNI USD Bullish Trend Based on S & R LevelBINANCE:UNIUSDT UNI USDT Bullish Trend Entries Based on Support and Resistance Level. if Market Move upward then Buy Stop Execute. if Market move down side our Sell Stop Order is Execute

GBPAUD I took a buyGuys, what else is needed to get entry, what do you think Please tell me in the comment and tell me your Opinion. If you like my aynalisis plz like comment 👍👍👍❤️❤️

LINAUSDT shows a bullish trend in 15 Min TFLINA broke the previous Higher High with high volume. After creating a higher high, we are now entering an accumulation phase. I expect LINA to break the Previous High and create another Higher High. The reason LINA can't make the lower low last 24 hours. It's a good sign.

GBPJPY 4 Hr Analysis: Mid-Week UpdateHey guys :)
So, after seeing some bullish movement this week, we are now waiting for price to retrace a bit deeper to that fib below and then show us what it wants to do from there.
As per my analysis, I would like to see price retrace anywhere between 159.500 and 158.500 within the fib drawn above. It may not even retrace much further at all and just continue bullish from there. But I would like to see it pull back further into the fib if I am going to consider taking a trade.
There are obviously many pathway options that price may take but these are just the main 2 that I would personally like to see at the moment. If price does not give me either of these I will Of course readjust and plan accordingly. :)
Option 1:
If price pushes higher into the fib and removes liquidity from the previous highs, then it is likely that price is just enticing and accumulating buyers before it drops and continues bearish. I would like to price push higher to about 162.500 or 163.500 before reversing as that will also satisfy and fill the imbalance to our left - But Of course it doesn't have to.
Buyers will see it break the previous highs and think that price has broken Market Structure and is continuing bullish causing them to place buys left, right and center.
Little do they know; price is only retracing further into the Higher Timeframe Bearish Fib, removing liquidity, and in fact, NOT breaking Market Structure. Basically, just performing the good old 'strike and reverse'.
Option 2:
Price will just retrace around the same area (162.500 or 163.500) instead of reversing and continue bullish for the time being.
Again, these are not verbatim. As price changes and moves as it wants, I will react accordingly and make the corrections needed for my analysis and projections. :)
Remember, it is not about being right or wrong. I know I always say this - but there is absolutely nothing wrong with being inaccurate in your analysis.
The problem lies with those who can't ACCEPT being wrong and they try to hold on to their analysis regardless knowing that price is going against them.
People think it's embarrassing to be 'wrong'. What's embarrassing is watching your stop loss being hit all in the name of your family, friends and Neighbours thinking you are right.
Ego will get you absolutely nowhere in these markets and you WILL be humbled and fast!
I can guarantee that there is nobody out there who is 100% right 100% of the time - And if there is, it's from YEARS of wins, losses, trials and error.
Adaptation is the key to survival if you want success in this job.

CADJPY 4HHey traders, in today's trading session i'm are monitoring CADJPY for a selling opportunity around 98.513 zone, once I will receive any bearish confirmation the trade will be executed.

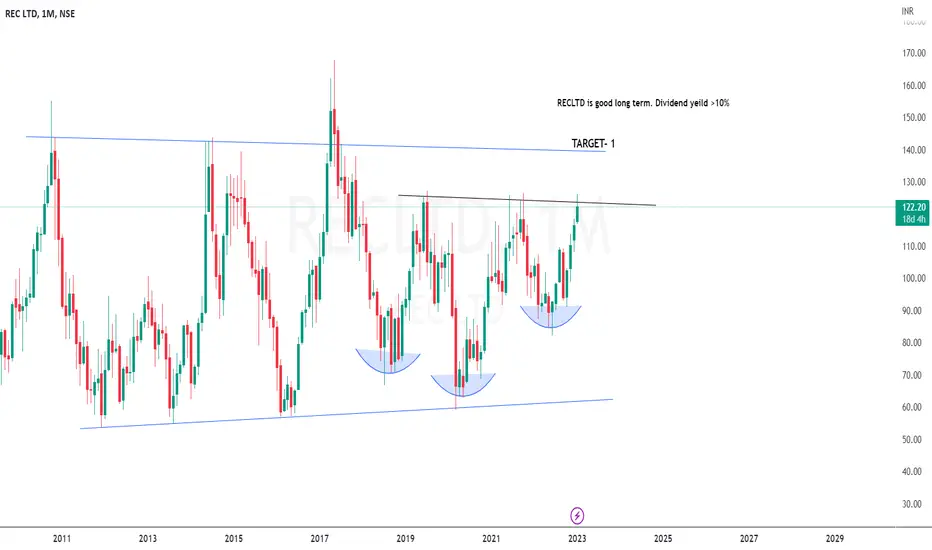
RECLTD is forming head and shoulder patternIf stock not move in your direction hold it for long term. It gives >10% dividend yield. Plan for long term perspective