chf jpy cup and handle patternits forming a cup and handle pattern expecting it to break the handle and trend upwards
Chfjpylong

ChfjpyThe short-term uptrend line is broken and has a correction of 61.8% and is tangent to the long-term uptrend line.Are you agree?

Trading Idea Regarding CHFJPYRight Now this Currency Pair is in Neutral Phase
1- It is making Cup & Handle Chart Pattern on Daily Time Frame Indicating its Bullish Behavior
2-It is Moving in Parallel Channel Chart Pattern on Daily Time Frame and Right Now heading towards bottom of the channel indicating Bearish Behavior
3- When Considering Fibo Levels after breaking 38.2 % Fibo Level Price touches top of the parallel channel and came back down and start moving around 23.6 level So, there are two possibilities at this point either it bounce back and continue moving up or it will came down to retest 38.2 fibo level
4- It is making Symmetrical Triangle Chart Pattern on 4 Hour Time Frame also indicating possibilities of moving in either direction
Note:
If this pair break above Symmetrical Triangle Chart Pattern it is also possible price plunge down from 126.226 level to 38.2 fibo level which is also bottom of parallel channel by fallowing Quasimodo chart pattern

💡Don't miss the great buy opportunity in CHFJPYTrading suggestion:
". There is a possibility of temporary retracement to the suggested support line (125.13).
. if so, traders can set orders based on Price Action and expect to reach short-term targets."
Technical analysis:
. CHFJPY is in an uptrend, and the continuation of the uptrend is expected.
. The price is above the 21-Day WEMA, which acts as a dynamic support.
. The RSI is at 60.
Take Profits:
TP1= @ 125.67
TP2= @ 126.00
TP3= @ 126.31
TP4= @ 126.70
TP5= @ 127.07
SL= Break below S2
❤️ If you find this helpful and want more FREE forecasts in TradingView
. . . . . Please show your support back,
. . . . . . . . Hit the 👍 LIKE button,
. . . . . . . . . . Drop some feedback below in the comment!
❤️ Your support is very much 🙏 appreciated!❤️
💎 Want us to help you become a better Forex / Crypto trader?
Now, It's your turn!
Be sure to leave a comment; let us know how you see this opportunity and forecast.
Trade well, ❤️
ForecastCity English Support Team ❤️

💡Don't miss the great buy opportunity in CHFJPYTrading suggestion:
". There is a possibility of temporary retracement to the suggested support line (125.13).
. if so, traders can set orders based on Price Action and expect to reach short-term targets."
Technical analysis:
. CHFJPY is in an uptrend, and the continuation of the uptrend is expected.
. The price is above the 21-Day WEMA, which acts as a dynamic support.
. The RSI is at 59.
Take Profits:
TP1= @ 125.67
TP2= @ 126.00
TP3= @ 126.31
TP4= @ 126.70
TP5= @ 127.07
SL= Break below S2
❤️ If you find this helpful and want more FREE forecasts in TradingView
. . . . . Please show your support back,
. . . . . . . . Hit the 👍 LIKE button,
. . . . . . . . . . Drop some feedback below in the comment!
❤️ Your support is very much 🙏 appreciated! ❤️
💎 Want us to help you become a better Forex / Crypto trader ?
Now, It's your turn !
Be sure to leave a comment; let us know how you see this opportunity and forecast.
Trade well, ❤️
ForecastCity English Support Team ❤️


CHF/JPY AnalysisWe can easily expect the creation of a higher high
Monthly:
We have an impulse and correction respecting precious resistance now turn support. When we have an impulse and correction we can definitely expect another impulse.
Weekly:
In weekly we have an impulse correction pattern. Also price is respecting .50 fibonacci level. We could expect a creation of a higher high at least to the price of 126.435.
Daily:
The price is in a consolidation period. The price is most likely creating liquidity before the continuation to the upside. We can definitely expect more continuation according to our multi-time frame analysis.

CHFJPY LongHey Traders, in tomorrow's trading session we are monitoring CHFJPY for a buying opportunity around 123 zone, once we will receive any bullish confirmation the trade will be executed.
Trade safe, Joe.

A brilliant story.Don't forget to click on the follow button for more professional daily analysis, also if you have any questions, please do ask them!
The CHF brings up a very nice story, for me.
I used to go there a lot years back and I went again in november.
This is because I and my family like it there. Its a place we return to,
Just like this, the price is back where it has flown up from again And that is why we are RE buying here.

CHFJPY Multi-timeframe Analysis & Trade IdeaHello everyone, if you like the idea, do not forget to support with a like and follow.
We can see on the COT - Commitment of Traders, which is what Hedge funds and the non commercials so the biggest in the market are doing. Where we can see that CHF's net positions have been decreasing, where we went from having positive 9,678 net positions to down to minus -17,584 we can see that in CHF is weak, but JPY is weaker from minus -55,190 to minus -102,734, where there has been a lot of shorts being added, we can see that JPY is weaker, hence we are looking for a SELL to BUY trade.
We also have a W formation on the Monthly & Weekly where we have 2 sets of trades as seen below. We are looking into a neckline retracement before the move to the upside.
Sell is from the M pattern entry on the daily and the correction Buy on the Monthly & Weekly.
All entries are on the break and retest of the structure.
Trade Signals
SELL 1
Entry: 124.338
Take Profit: 119.850
Stop Loss: 124.808
SELL 2
Entry: 124.338
Take Profit: 121.194
Stop Loss: 124.808
BUY 1 (Weekly W Pattern - Neckline reversal)
Entry: 119.861
Take Profit: 127.331
Stop Loss: 118.564
BUY 2 (Monthly W Pattern - Neckline reversal)
Entry: 121.193
Take Profit: 127.087
Stop Loss: 119.458
Good luck!
All Strategies Are Good; If Managed Properly!
~FX_SHIFTER

UPDATE: CHFJPY Multi-timeframe Analysis & Trade IdeaHello everyone, if you like the idea, do not forget to support with a like and follow.
We still have a W formation on the Monthly & Weekly where we have 2 sets of trades as seen below. We are looking into a neckline retracement before the move to the upside. We are also looking for a sell reentry before the reversal on the Monthly or Weekly long.
BUY 1 (Weekly W Pattern - Neckline reversal)
Entry: 119.861
Take Profit: 127.331
Stop Loss: 118.564
BUY 2 (Monthly W Pattern - Neckline reversal)
Entry: 121.193
Take Profit: 127.087
Stop Loss: 119.458
Good luck!
All Strategies Are Good; If Managed Properly!
~FX_SHIFTER

A divergence signal appeared with CHFJPYH4 time frame.
Structure: Uptrend.
At the price of 122,500 CHFJPY formed a divergence signal with the MACD indicator.
Wait for the price to break the Key level at 123,700 and appear a confirmation signal, then you can find a buying opportunity.
The profit target is the price zone of 126,000.
-----------------------------------------------------------------------------------------------
Wish you all have a good trading day!

CHF/JPYBuy: CHF / JPY
Sell limit: 122.560
SL @ 121.890
TP @ 123.400
Max Risk: 2%
(When calculating, do not forget about different spreads from Brokers)
Leave comments or likes to keep our content free and alive.
Have a good week to everyone
It is not an investment recommendation

CHFJPY LONG - Buy Entry - H4 ChartCHFJPY LONG - Buy Entry - H4 Chart
Symbol: CHFJPY
Timeframe: H4
Type: BUY
Entry Price: Buy @ Market
Stop Loss: 122.340
Take Profit: 124.483
🔺 DISCLAIMER
🔺 For educational informational purposes only.
🔺 Analysis may change at any time without notice.
🔺 You must research and create your own trading plan.

CHFJPY Trend Analysis OANDA:CHFJPY
Bullish Indications
Bullish piercing candle at Major 1D Support area at 122.566, Pair has been retraced to 0.382 Fib level on 4H. Bullish Divergence is seen on 1H RSI(14). This pair has been bullish 80% of the time in month of December for last 15 years.
Daily timeframe shows bearish trend, which has been supported from current price level.
I am long biased. However, two plans are given for either direction.
Plan A
Buy at 122.743 with Stop loss 122.397, Target 1 = 123.186, Target 2 = 123.457, R/R ratio 1.3
Plan B
Sell if closed below 122.566, Stop Loss 123.045, Target 1 = 121.567, Target 2 = 120.568
Please comment below for any suggestion, follow and support if you like the idea.
Thanks and Good luck for trade

CHFJPY inverse HSas the title says, an inverse shoulder head shoulder formation can occur here.
Most trades this after breaking the neckline, but I think it is more interesting to grab this opportunity before with the Fibonacci level.

ChfJpy- To reverse from support?Like most Jpy pairs, November was a correction month also for ChfJpy(so far) and the pair dropped from its 125 recent high
An H&S pattern is pretty obvious on lower time frame charts, but in my opinion, this will not pay off.
A short dive under this H&S support is not out of the question, but in the medium term, my opinion is that we'll have a new leg up above 125

CHFJPYA wave of correction is evident in the time frame of 4 hours of positive divergence I predict the price will correct 50% of the previous fall to prepare for the fall again

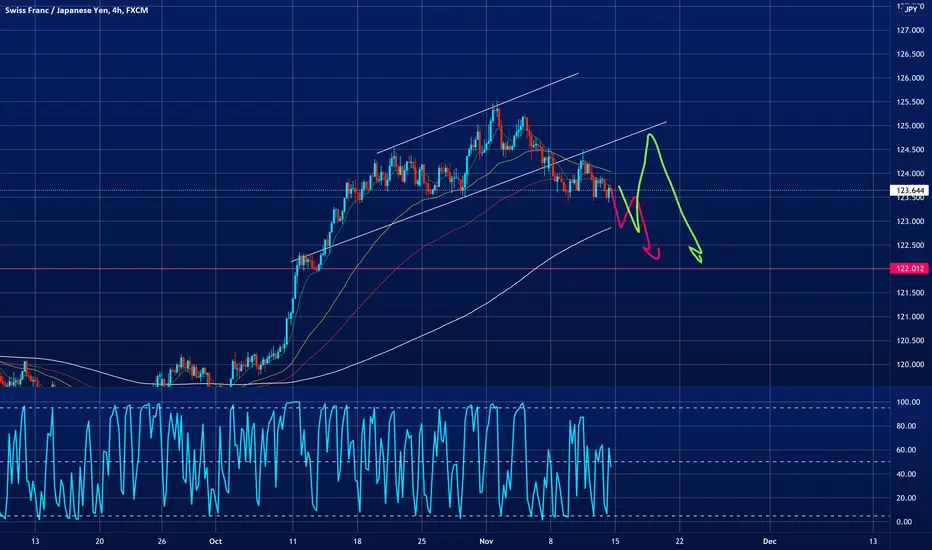
Hope u took the short, CHFJPYThe swiss yen broke down farther after breaking the channel and testing the bottom of the channel, we expect to see more downside this week. But the white line(200ma) serves as a strong support. If you're in a short take some profits at around there and re-enter again at a better price.
BEAR CASE
Price to go farther down to ~122.9, there we can see some support. Our ultimate target is ~122
BULL CASE
We expect price to test at least 122.9 but the support can be stronger than expected, do not be surprised if we bounce to 125 from there before another big leg down.

chfjpyCHFJPY - Rejected the structure and WFB as we said , running over 80 pips, you can enter again by breaking the black trendline , look at the link below

CHFJPY Trendline Test UnderwayIn this update we review price action in the CHFJPY identifying a high probability trading strategy
