CL Daily Long Idea. Will support holdThe CL daily time frame has pushed bullish off
the monthly support price point 74.40. The market
pushed bullish above the inner trend line and is
showing signs of a potential bullish trend to form.
There is another level of resistance above the
market at price point 88.31 about +810 ticks
above the market. As long as the market stays
above 74.40. It will be a good idea to turn to the
one hour time frame and look for low prices
in the buy zone.
CL

Financial Wave. CLCL
Our preferable scenario for CL is to drop the price to $68. The $83-$86 range is key for the CL, the $86 price move cancels our scenario.

CL back to $90 a barrel?Following price cap on Russian oil, Opec+ is likely to cut oil supply for the second time.
Technically, CL has broken above the downtrend resistance and now in a correction wave.
Getting filled at $77 will give us the ideal RRR in this trade.

Oil - will price hit TP2 or TP3?USOUSD - Forex - OIL - Price bounced off the $75 level - Will this swing to the up side continue or is it over for now? What are your thoughts on oil?

Financial Wave. CLOur preferable scenario changed after the price of CL went below $76.20. To complete the downward movement, the price may drop below $70. A rise above $79 will resume the upward move and cancel our view.

CL and XLE divergence - 11/25/2022Why is there a divergence between CL and XLE?
XLE usually leads first. So does that mean CL going to catch back up after SPR depletes? Bullish on CL?

crude oil : doble bottom pattern, going to 86.00oil if dont break low,has poweful buy now ,so we advice buy it now but put SL in low,,,if low break downtrend can start
note: trade oil need minimum 5 year practice on demo , it is very complex and trendy market
good luck

Crude Oil is BearishNYMEX:CL1!
Crude Oil futures marked on the 4h chart
After being neutral the past week due to ranging behavior, CL has just possibly shown its hand on where it is headed to in the short term.
Confluences
Overall bearish order flow since the summer.
Liquidity grab at the double top (marked with the X line).
Market Structure Shift (MSS) by breaking the short term low at ~87.60.
Retraced into 4h imbalance and rejected it, thus showing it is respecting a premium price and now seeking a discount.
In premium of September 26 - October 9 dealing range as shown by the fibonacci.
Looks like bread-and-butter sell model in the making.
Current signs show oil is intending to go lower. I am anticipating at least 81.30 as a target level because there is a liquidity void resting below it.

CL Daily up TrendThe CL daily time frame broke the short term
down trend line and has entered into the buy
zone. The market has an up Fibonacci with an
extension price point 104.39 about +1,909 ticks
above the market. As long as the market stays
in the buy zone above the short term down trend
line. It will be a good idea to turn to the one
hour time frame and to look for low prices in the
buy zone.

Financial Wave. CLAs long as the price of CL is above $84, the possibility of growth to $91 remains, this is a preferable scenario in this case.
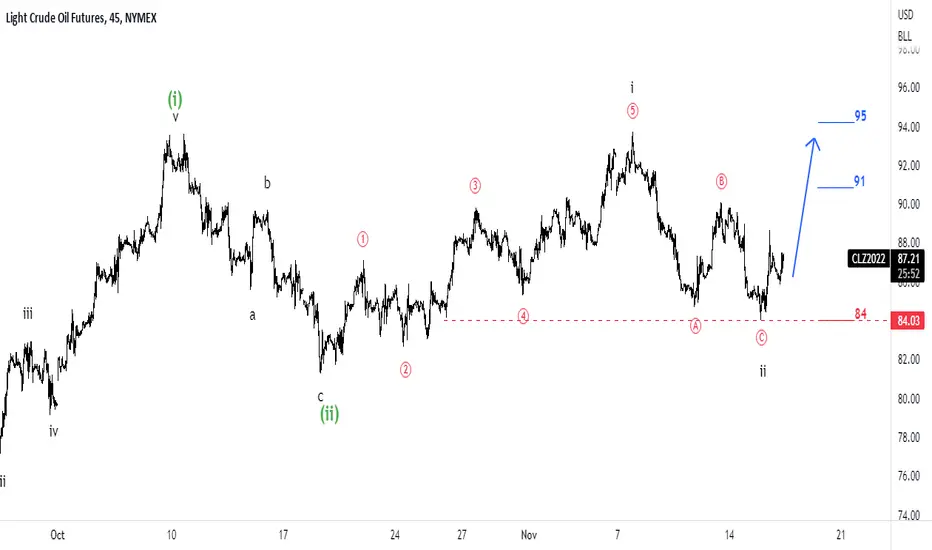
Elliott Wave View: Oil (CL) Has Started New Leg HigherShort term Elliott Wave view in Oil suggests the rally from 9.26.2022 low is unfolding as a 5 waves diagonal. Up from 9.26.2022 low, wave (1) ended at 93.64 and pullback in wave (2) ended at 82.11. The rally then resumes and Oil has broken above wave (1) peak suggesting the next leg higher has started. It also shows a bullish sequence from 9.26.2022 low, favoring further upside.
Wave (3) higher ended at 93.74 with internal subdivision as 5 waves impulse Elliott Wave structure. Up from wave (2), wave 1 ended at 90.36 and pullback in wave 2 ended at 87.60. Wave 3 higher ended at 92.87, and pullback in wave 4 ended at 90.40. Final leg higher wave 5 ended at 93.74 and this also completed wave (3) in higher degree. Wave (4) pullback is now in progress to correct cycle from 10.18.2022 low before the rally resumes. Near term, as far as 10.18.2022 pivot at 82.11 stays intact, expect dips to find support in 3, 7, or 11 swing for more upside. Potential target higher is 100% – 161.8% Fibonacci extension from 9.26.2022 low which comes at 99.7 – 110.5.

Because of the break of area x and the decline of the macdi indiBecause of the break of area x and the decline of the macdi indicator, it is possible for the price to reach area 1 and then it can continue its way towards area 2

Fed may destroy Oil Demand - Stay CautiousAs soon as the US Fed shifted into rate increases - traders should have suddenly elevated their protection tactics.
The Fed's objective is to beat inflation and remove the easy money mentality. In order to do that, they may have to break consumers, industry, global economics, and the general demand cycle for cars, homes, credit/debt, and more.
What happens when the Fed raises rates to a point where the global economy comes to a crashing halt? Consumers react by pausing or stalling travel/spending plans - creating demand destruction for Oil, Lumber, and other commodities.
In my opinion, it is just a matter of time before Crude Oil collapses downward, headed into a typical seasonal cycle (winter). I believe we may be entering a period of very dangerous demand destruction as the US Fed may have pushed rates too high (again).
Stock up. Things could get really WONKY.
Follow my research.

Crude OIL Weekly Volatility Forecast 31/10 - 04/11 2022 Crude OIL Weekly Volatility Forecast 31/10 - 04/11 2022
Currently the volatility for this week is around 6.5% , up from expected 5.47% last week.
According to ATR calculation, currently the volatility is located around 80th percentile.
Under this circumstances the expected movement of the candle is :
BEAR : 5% from the opening point of the weekly candle
BULL : 4.75% from the opening point of the weekly candle
At the same time, currently there is 15.6% that the movement within this weekly candle is going to
break and close either above or below the next channel:
TOP: 93
BOT: 83.5
Lastly, taking into account the previous weekly high and low there is a :
70% chance that we are going to touch the previous week high
30% chance that we are going to touch the previous week low

ATTENTION ! Free insightATTENTION! We have a solid opportunity to buy silver, accumulate it, and make millions.

oil quick analyses my analyses indicate that the market in bullish phase for now but the market will keep pushing in the main trendline wich is bearish so In short, the market is in a bullish corrective phase, but I do not recommend buying because it will be the opposite of the main trend wich is bearish well wait untill we have sign to sell wait for upgrade

DAY TRADE Market ConditionDay Trade Market Condition, Jesse Livemore "There is only one side to stock market; and it is not the bull side or the bear side, but the right side" :
NQ, ES, CL, BTC (a day trader on NQ, markets I pay attention with);
Market Condition show on a table of each chart
Rally, long position offers higher success
SHOPzone, price fluctuate randomly between Supply/Demand levels (traders get burden mostly, day trading)
Drop, short position offers higher success
BULL, up trend for the week
Cumulating , keep eyes on left column (the first top 3 above)
BULL, down trend for the week
Top down approach for day trade, quoted from Jesse Livemore, "I must buy on a rising scale. I don't buy long stocks on a scale down I buy on a scale up."

Is Crude going to fall below $69 over before the end of 2022?You tell me? My analysis is that Asia/Europe will contract demand as high Natural Gas and other economic constraints pull purse strings throughout the Christmas Holidays/Winter.
If this happens, we may see a demand destruction cycle take place in Oil that could be 40~50% of the demand destruction that took place when COVID hit.
The new strains of COVID are already making news and any pump in infections throughout Asia/EU/Africa may send 65% of the world into LOCKDOWNS again.
Don't get too bullish as it appears Crude is attempting to settle below $69 ppb.
FYI.
Follow my research.

Looking for Long Idea on CL The CL daily time frame is near a low price
hitting the long term up trend line. If support
holds. It is expected the market will push bullish
above the short term down trend line entering
into the buy zone. Once or if the market breaks
and closes above the short term down trend line
and enters into the buy zone. I twill be a good idea
to apply up Fibonacci to find the next bullish
Fibonacci price target then turn to the one hour
time frame to look for low prices in the buy
zone. Until then. It is better to be out of the
market wishing to be in than to be in the
market wishing to be out.

Long opportunity for CL Long opportunity for CL
Entry : 77.85
SL : 76.12
TP1 : 86.58
TP2 : 89.75
TP3 : 93.86
If You Like My Idea Support me With Like :)

CL or UCO Oil Idea Oil going up. this is only the beginning. prepare yourselves. SPR drains stop after the November mid term elections. not a lot left in it anyways. production cuts, combined with a global energy crunch from a Green transition coming too early before viable technology. Great reset agenda. confluence of bullish ideas. DXY not cooling off until 118. Oil was only down so far to price in the recession. so many factors. 12-18 months of bull market coming for all commodities, still imo. not financial advice

cl1! long nowThis market is witnessing an unusual movement and the possibility of a rise is very high
My advice is to buy

LIGHT CRUDE OIL FUTURES longNYMEX:CL1!
This market is witnessing an unusual movement and the possibility of a rise is very high
My advice is to buy
