USOIL 2/MAY/2023It is anticipated that the Federal Reserve, which is responsible for managing the US's monetary policy, will raise interest rates again. This could potentially cause the US economy to slow down and enter a recession later this year.
In recent weeks, concerns about a banking crisis have affected the oil market. The US government took over First Republic Bank, and JPMorgan purchased most of its assets, causing alarm as three other US banks have previously collapsed: Signature Bank, Silvergate Bank, and Silicon Valley Bank. If more banks encounter difficulties, it may lead to a banking crisis that could cause a recession and a decrease in oil demand. Additionally, voluntary production cuts of about 1.16 million barrels per day by OPEC+ countries, including Russia, will take effect in May, impacting oil prices.
On a positive note, the US's manufacturing industry is improving, and with rising demand and employment, this has slightly boosted oil prices.
Crude Oil Futures WTI (CL1!)

WTI Light Sweet Crude Oil, 5/2/23For Tuesday, both 73.98 and 77.54 can firmly contain intraday activity, beyond which the next notable level is attainable intraday.
Downside, breaking/opening below 73.98 allows 71.76 intraday, able to contain selling through May, once tested the market poised for recovery to 81.48 within 1 - 2 months.
A daily settlement below 71.76 would signal 62.14 over the next 3 - 5 weeks.
Upside Tuesday, pushing/opening below 77.54 allows 78.66, where the market can place a daily high.
A settlement today above 78.66 indicates the 79.84 - 81.48 region within several days, able to contain buying into June, once tested the market prone to fall back to 71.76 within 1 - 2 months.

Day Trade Market Condition may 01, 2023this is may 01, 2023 levels for NQ ES CL BTC
watch the table left side for trade, right side for trend
NQ 13500 ES 4260 those levels making the bull not so easy, however, as long as price above vwap on daily chart check out Volume Profile by QTECHtrading markets try testing the levels.

Crude Oil (WTI): Detailed Structure Analysis🛢️
Here are the key levels that I spotted on WTI Crude Oil.
Resistance 1: 76.6 - 77.0 area
Resistance 2: 78.6 - 79.9 area
Resistance 3: 83.2 - 83.5 area
Support 1: 69.8 - 71.6 area
Support 2: 64.4 - 66.9 area
Consider these structures for pullback/breakout trading this week.
❤️Please, support my work with like, thank you!❤️

WTI Light Sweet Crude Oil, 5/1/23The 81.48 level can contain buying through June, below which 71.76 is likely to be tested over that time horizon and able to contain monthly selling pressures when tested, as well as the point to settle below for yielding 62.14 within 3 - 5 more weeks, where the broader market can bottom out through summer.
Upside, a weekly settlement above 81.48 signals 95.29 within 2 - 3 months, able to contain buying through summer activity and a meaningful upside continuation point into later year.
-
For Monday, 75.28 can contain session weakness, above which 78.66 remains a 2 - 3 day target, possibly yielding 79.90 within the week, the start of a range of meaningful resistance up to 81.48 able to contain buying into June, once tested the market prone to fall back to 71.76 within 1 - 2 months.
Downside Monday, breaking/opening below 75.28 signals 73.98, while closing today below 75.28 indicates 71.76 within 3 - 5 days, able to contain selling through May, once tested the market poised for recovery to 81.48 within 1 - 2 months.

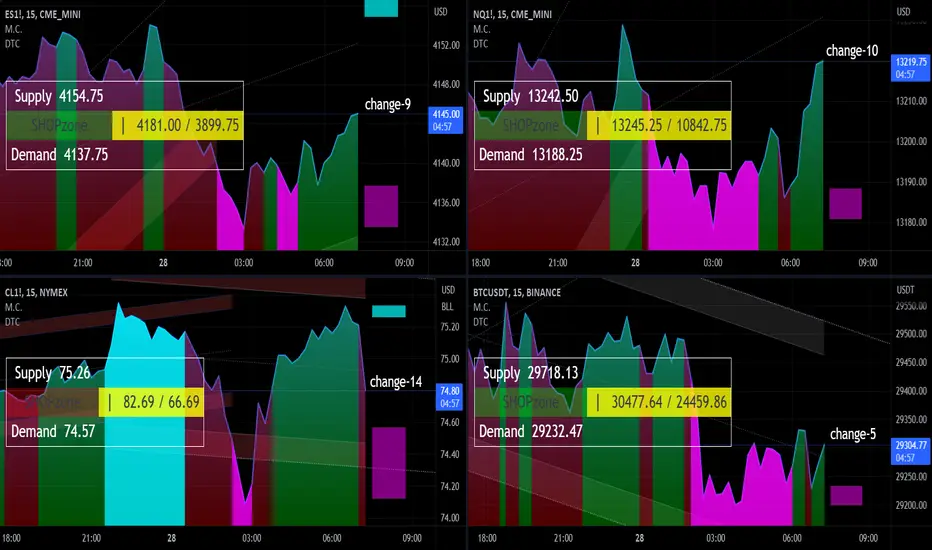
Day Trade Market Condition apr 28, 2023this is apr 28, 2023 levels for NQ ES CL BTC
watch the table left side for trade, right side for trend
important note: NQ/ES trade below yesterday POC (high liquidity area), pull back? I could be wrong, it is not a favorite location for day trading
WTI Light Sweet Crude Oil 4/28/23For Friday, 76.20 can contain buying into next week, below which 71.76 targeted midterm support is likely over the next 3 - 5 days, where the market can bottom out through May.
A weekly settlement today below 71.76 would, on the other hand, indicate 68.06 by the end of next week, 62.14 within 3 - 5 weeks.
Upside Friday, pushing/opening above 76.20 signal 77.60 intraday, while closing back above 76.20 indicates 79.95 by the end of next week, potentially yielding a test of 82.29 long-term resistance within 1 - 2 weeks.

Day Trade Market Condition apr 27, 2023this is apr 27, 2023 levels for NQ ES CL BTC
watch the table left side for trade, right side for trend

WTI CRUDE OIL: Aggressive sellingWTI Crude Oil is on a strong selloff that was accurately anticipated by our firm on the 1D MA200 rejection, making a LH on the long term Channel Down and providing us with the most optimal sell entry. The 4H technicals are oversold but the 1D remains on standard bearish price action (RSI = 42.644, MACD = 0.240, ADX = 42.786) and we don't expect this selling to take a pause before the 1D RSI tests the S1 (39.50).
Our short term target has always been 74.00 and after a short lived rebound we expect 72.00. Unless 1D closes a candle above the 1D MA50, in which case a bigger rebound is possible to 80.00 before an even deeper fall to 66.00.
Prior ideas:
## If you like our free content follow our profile to get more daily ideas. ##
## Comments and likes are greatly appreciated. ##

Day Trade Market Condition apr 26, 2023this is apr 26, 2023 levels for NQ ES CL BTC
watch the table left side for trade, right side for trend

WTI Light Sweet Crude Oil 4/26/23For Wednesday, 80.06 can contain weekly buying pressures, below which 76.20 remains a 3 - 5 day objective able to contain selling through the balance of the week.
A daily settlement below 76.20 signals a good weekly high, the longer-term target at 71.76 by the end of next week, where the market can bottom out through May and a meaningful downside continuation point over the same time horizon.
Upside Wednesday, closing above 80.06 signals 82.29 within several days, long-term resistance able to contain buying into summer, and below which 71.76 remains a 3 - 5 week objective.
Inversely, a weekly settlement above 82.29 would indicate 95.91 over the following 2 - 3 months.

Day Trade Market Condition apr 25, 2023this is apr 25, 2023 levels for NQ ES CL BTC
watch the table left side for trade, right side for trend
NQ/ES shop zone, trade likely reacting to supply level and demand level

CRUDE OIL (WTI) Detailed Structure Analysis 🛢
Here are the key levels to watch on WTI Crude Oil this week.
Resistance 1: 79.0 - 79.85 area
Resistance 2: 83.17 - 83.5 area
Support 1: 75.5 - 75.8 area
The market is in an attempt to fill the gap.
I am bearish biased and expect the gap to be filled.
❤️Please, support my work with like, thank you!❤️

CL1! OilOil is looking good to buy after the correction, the triggers for entry are a breakdown of the downtrend, a consolidation breakdown and the high of 78.35, where there were large cluster volumes. The price remains above the breakdown so I opened a long position at 78.7, with an exit under the lower consolidation boundary below 76.7. The first target is 80, then 81.5-82.5-83.4.
Support for the author subscription ✅ and rocket start 🚀.
Good luck and profit to all.

WTI Light Sweet Crude Oil 4/25/23For Tuesday, 80.11 can contain weekly buying pressures, below which 76.20 remains a 3-5 day target able to contain selling through the balance of the week. A daily settlement below 76.20 signals a good weekly high, the targeted 71.76 then expected by the end of next week, where the market can bottom out through May and a meaningful downside continuation point over the same time horizon. Upside Tuesday, closing above 80.11 signals 82.29 within several days, long-term resistance able to contain buying into summer, and below which 71.76 remains a 3- 5 week objective. Inversely, a weekly settlement above 82.29 would indicate 95.91 over the following 2-3 months.

Day Trade Market Condition apr 24, 2023this is apr 24, 2023 levels for NQ ES CL BTC
watch the table left side for trade, right side for trend

Day Trade Market Condition apr 21, 2023this is apr 21, 2023 levels for NQ ES CL BTC
watch the table left side for trade, right side for trend

CRUDE OIL (WTI) Time to Fill The GAP?! 🛢
Important update for WTI Oil.
Recent bearish movement explained.
Trading plan & trading recommendations.
❤️Please, support this video with like and comment!❤️

WTI may correct temporarily before continuationWTI, profit taking correction may take over before continuing up.
SEEDED S to 80.55 target 74 area.
Overextension to the upside is possible so be mindful.
TAYOR.

Day Trade Market Condition apr 19, 2023this is apr 19, 2023 levels for NQ ES CL BTC
watch the table left side for trade, right side for trend

CL1! Will Fall! Short!
Please, check our technical outlook for CL1!.
Time Frame: 1D
Current Trend: Bearish
Sentiment: Overbought (based on 7-period RSI)
Forecast: Bearish
The market is testing a major horizontal structure 79.46.
Taking into consideration the structure & trend analysis, I believe that the market will reach 73.95 level soon.
P.S
The term oversold refers to a condition where an asset has traded lower in price and has the potential for a price bounce.
Oversold refers to market scenarios where the instrument is traded considerably higher than its fair value. Overvaluation is caused by market sentiments when there is positive news.
Like and subscribe and comment my ideas if you enjoy them!

CL1! Technical Analysis! BUY!
My dear subscribers ,
I analysed this chart on CL1!, and concluded the following:
The market is trading on 81.07 pivot level.
Bias - Bullish
Technical Indicators: Pivot Points High/ anticipates a potential price reversal.
Super trend shows a clear buy, giving a perfect indicators' convergence.
Goal - 85.40
Recommended Stop Loss - 78.47
About Used Indicators:
For more efficient signals, super-trend is used in combination with other indicators like Pivot Points.
———————————
WISH YOU ALL LUCK

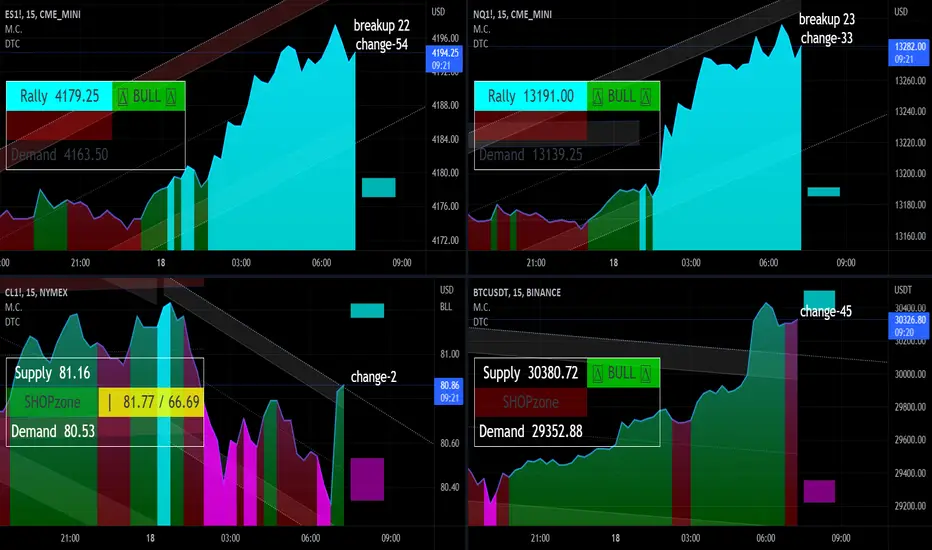
Day Trade Market Condition apr 18, 2023this is apr 18, 2023 levels for NQ ES CL BTC
watch the table left side for trade, right side for trend
ES+NQ Bullish