USOIL: Will Go Up! Long!
My dear friends,
Today we will analyse USOIL together☺️
The recent price action suggests a shift in mid-term momentum. A break above the current local range around 58.463 will confirm the new direction upwards with the target being the next key level of 59.265 and a reconvened placement of a stop-loss beyond the range.
❤️Sending you lots of Love and Hugs❤️
Commodities

PATIENCE WILL PAY OFF 〉LONG TERM BUY COMING SOON.As illustrated, I'm trying to visualize what the next couple of weeks could look like.
Taking into consideration the fact that May + June are corrective months for gold historically (don't believe me; check the seasonality tool...) , Is likely for price to range up and down within quite a wide range anywhere between 3300 and 3100 before it enters a bullish continuation impulse by the end of June and into first week of July.
( I have illustrated 2 potential buying areas; one closer to price and another extended one lower )
That being said, one must adapt to such market conditions that will only offer certain structure offering a few intraday trades, but mostly short term trades or quick scalping moves all within a same trading session, simply because as each session comes in, they will target previous sessions highs or lows (ranging back and forth in an uncomfortable manner and without a clear direction).
Asia would target Sydney's open, then London might target Asia's open, then NY might target any low or high in the opposite direction... and so on back and forth without truly holding a bullish or bearish structure longer than a few hours to a full calendar day before it turns around (sideways behavior).
As price reaches "stronger psychological" price levels like 3150, 3100, 3050 and potentially 3000; then you might start seeing evident rejections within higher timeframes (4H and 1D); ideally seeing rejection wick/s followed by a nice push up showing true power and volume to the upside, potentially signaling the bottom of this correction phase.
TIME should be aligned with this market behavior; that means that checking the seasonality tool. every year (on average 5, 10 and 15 years), gold makes a bottom during the first week of JULY ...
So... market structure, price, and time must be aligned correctly and it will all make sense whenever that moment comes; hence, the title of this idea.
I am personally not worried about any sort of economic event; news are only gas for the market to move and create liquidity and volatility.
AT THIS POINT, THE ONLY THING THAT COULD TRIGGER A SIGNIFICANT MOVE IN GOLD, IS A GEOPOLITICAL EVENT THAT WOULD TRULLY TRIGGER UNCERTAINTY IN THE MARKETS... .
--
GOOD LUCK!
Persaxu

GOLD - Price can grow to $3370 resistance levelHi guys, this is my overview for XAUUSD, feel free to check it and write your feedback in comments👊
Recently, price entered to pennant, where it at once bounced from support line and started to grow, but soon corrected.
After this movement, Gold made upward impulse, and broke $3205 level, after which it made retest and continued to move up mext.
Soon, it reached $3370 level, broke it and then rose to resistance line of pennant, after which started to fall.
In a short time, price declined below $3370 level, breaking it again, and then some time traded below.
Later, Gold continued to fall and declined to support level, which coincided with support line of pennant.
Now, I think that price can bounce up from support level to $3370 level, exiting from pennant pattern.
If this post is useful to you, you can support me with like/boost and advice in comments❤️

USOIL SENDS CLEAR BEARISH SIGNALS|SHORT
USOIL SIGNAL
Trade Direction: short
Entry Level: 64.59
Target Level: 60.50
Stop Loss: 67.30
RISK PROFILE
Risk level: medium
Suggested risk: 1%
Timeframe: 12h
Disclosure: I am part of Trade Nation's Influencer program and receive a monthly fee for using their TradingView charts in my analysis.
✅LIKE AND COMMENT MY IDEAS✅

GOLD (XAU/USD, 4H) updateOn the 4-hour chart, GOLD has broken below the lower boundary of a pennant pattern on increasing volume, signaling potential for continued downside. Despite this, the asset remains within the confines of a bullish megaphone structure, whose boundaries are still intact. The EMA indicators (20/50/100/200) are aligned in a bearish sequence, exerting downward pressure. The price is consolidating below the $3295 level and is approaching key demand zones.
Near-Term Downside Targets:
- $3177 — Intermediate demand zone
- $3063 — Major support level
Technical Highlights:
- Breakdown from bearish pennant confirmed by volume
- Price action continues within the bullish megaphone pattern
- EMA 20/50/100/200 positioned above price, indicating overhead resistance
- Volume increases observed during downward moves
- Key buyer interest zone: $3060–$3080
- Resistance zone: $3295–$3305
Following the breakdown from the consolidation pattern, gold is exhibiting a downward trajectory targeting support zones at $3177 and $3063. The bearish scenario is technically confirmed as long as the price remains below $3295. However, the movement within the bullish megaphone structure warrants close monitoring for potential shifts in momentum.

BRIEFING Week #18 : Waiting for RotationHere's your weekly update ! Brought to you each weekend with years of track-record history..
Don't forget to hit the like/follow button if you feel like this post deserves it ;)
That's the best way to support me and help pushing this content to other users.
Kindly,
Phil

De-Dollarization Debunked: Why BRICS Can’t Dethrone the USD!The Dollar’s Throne—Shaky or Rock-Solid?
Picture this: a gang of economic rebels—Brazil, Russia, India, China, South Africa, and their new BRICS+ pals—plotting to topple King Dollar from its global throne. The headlines scream “De-Dollarization!” as if the U.S. dollar is about to be dethroned by a shiny new BRICS currency, backed by gold, blockchain, or sheer ambition. Sounds like a blockbuster, right? Except, here’s the twist: the dollar’s throne isn’t just solid—it’s practically welded to the global economy. So, why does the BRICS crew think they can pull off this heist? And why are they doomed to trip over their own ambitions? Buckle up for a 5,000-word joyride through the wild world of global finance, where the dollar reigns supreme, BRICS dreams big, and the numbers tell a story funnier than a sitcom.
Act 1: The Dollar’s Superpower—Why It’s Still King
Let’s start with a jaw-dropping stat: the U.S. dollar accounts for 88% of international transactions through the SWIFT system and 59% of global central bank reserves as of 2024. That’s not just dominance; it’s the financial equivalent of the dollar flexing its biceps while other currencies watch from the sidelines. The euro? A distant second at 20% of reserves. China’s yuan? A measly 2.3%. The dollar’s grip is so tight, it’s practically giving the global economy a bear hug.
Why does the dollar rule? It’s not just because Uncle Sam prints greenbacks like they’re going out of style (though the U.S. debt is a whopping $34 trillion in 2025). The dollar’s superpower lies in trust, liquidity, and infrastructure. The U.S. has deep, liquid financial markets, a stable (ish) legal system, and no capital controls—things no BRICS nation can match. Want to trade oil? Dollars. Settle a cross-border deal? Dollars. Hide your cash from your dictator boss? You guessed it—dollars. The greenback is the world’s financial comfort food, and everyone’s got a craving.
But here’s where it gets juicy: BRICS thinks they can crash this party. At the 2024 Kazan Summit, Russia’s Vladimir Putin called the dollar a “weapon,” while China’s Xi Jinping pushed for a BRICS “Unit” currency. Sounds spicy, but let’s unpack why this plan is less Ocean’s Eleven and more Three Stooges.
Act 2: BRICS’ Big Dream—And Bigger Problems
The BRICS Fantasy: A Currency to Rule Them All
BRICS (Brazil, Russia, India, China, South Africa, plus newbies like Iran, Saudi Arabia, and the UAE) wants to ditch the dollar for a new currency or a basket of their own—maybe even a gold-backed “Unit.” The pitch? Reduce reliance on the dollar, dodge U.S. sanctions, and flex their collective muscle (they represent 28% of global GDP and 44% of crude oil production). In 2023, one-fifth of oil trades sidestepped the dollar, a shift driven by Russia and China settling in rubles and yuan. That’s a bold move, right?
Except, here’s the punchline: creating a BRICS currency is like herding cats while riding a unicycle and juggling flaming torches. Let’s break down why their dream is a logistical nightmare.
Problem #1: No Trust, No Party
BRICS nations don’t exactly exchange friendship bracelets. India and China? They’ve got border disputes so tense, their soldiers once threw rocks at each other. Russia and China might cozy up to dodge sanctions, but Brazil and India aren’t thrilled about Beijing calling the shots. A common currency needs trust—think the eurozone, where Germany and France (mostly) play nice. BRICS? It’s more like a reality show where everyone’s secretly voting each other off the island.
X posts sum it up: “BRICS replacing the dollar? Mutual distrust and weak legal systems will kill any shared currency initiative.” Without trust, no one’s pooling their reserves or agreeing on who controls the money printer.
Problem #2: The Yuan’s Not Ready for Prime Time
China’s yuan is the closest BRICS has to a dollar rival, but it’s got stage fright. Only 7% of foreign exchange trading involves the yuan, and China’s capital controls keep it on a tight leash. Want to invest your yuan globally? Good luck—Beijing’s not keen on letting cash flow freely. Morgan Stanley’s strategists put it bluntly: “China would need to relax control of its currency and open the capital account. That’s not happening soon.”
Plus, China’s economy isn’t exactly inspiring confidence. Consumer demand is sagging, and the property crisis is dragging on like a bad soap opera. The yuan’s share in global payments via SWIFT is up to 6.4% in 2024, but that’s still pocket change compared to the dollar’s dominance.
Problem #3: Oil’s Not Enough
BRICS+ produces 44% of global crude oil, so why not price it in their currencies? Saudi Arabia’s riyal is pegged to the dollar, and even their flirtation with yuan-based oil deals hasn’t gone far. Why? Oil is only 15% of global trade, and the dollar’s used for everything else—tech, cars, coffee, you name it. Even if BRICS prices oil in rubles or rupees, the rest of the world’s still paying for iPhones in dollars.
And here’s a kicker: at the 2024 BRICS Summit, Russia advised attendees to bring dollars and euros because local banks preferred them over rubles. Talk about an own goal
Act 3: The Dollar’s Kryptonite—Does It Exist?
Let’s play devil’s advocate. Could BRICS pull off a miracle? They’ve got some tricks up their sleeves: blockchain-based payment systems like BRICS Bridge, gold-backed reserves (BRICS+ holds 42% of global FX reserves), and a push for local currency trade. Russia and China already settle 95% of their trade in rubles and yuan. That’s not nothing.
But here’s the reality check: these moves are like bringing a water gun to a tank fight. The dollar’s dominance isn’t just about transactions; it’s about network effects. The greenback’s infrastructure—SWIFT, Wall Street, Treasury bonds—is a fortress. BRICS’ alternative, like the mBridge CBDC platform, is promising but embryonic. It connects China, Hong Kong, Thailand, the UAE, and Saudi Arabia, but it’s nowhere near replacing SWIFT’s global reach.
And gold? BRICS loves it—gold’s 10% of their reserves, half the global average—but it’s not a currency. You can’t pay for Netflix with gold bars, and central banks aren’t keen on lugging bullion around. The Atlantic Council’s 2024 “Dollar Dominance Monitor” says it best: “The dollar’s role as the primary global reserve currency is secure in the near and medium term.”
Act 4: Trump’s Tariffs and the De-Dollarization Drama
Enter Donald Trump, stage right, with a megaphone and a tariff hammer. In 2025, he’s threatening 100% tariffs on BRICS nations if they push de-dollarization. “Any BRICS state that mentions the destruction of the dollar will lose access to America’s markets,” he thundered. Sounds like a plan to keep the dollar king, right?
Wrong. Here’s the irony: Trump’s aggressive tactics might accelerate de-dollarization. Sanctions and tariffs make BRICS nations double down on alternatives. China’s been diversifying reserves and pushing yuan trade for years, partly because of U.S. pressure. As one analyst put it, “Trump’s threats are a rallying cry for BRICS to act.”
But don’t hold your breath. Tariffs hurt BRICS economies (China’s exports to the U.S. are 15% of its total), but they don’t solve BRICS’ internal chaos. India’s External Affairs Minister S. Jaishankar said it plainly: “India has never been for de-dollarization.” Brazil’s also lukewarm, fearing a China-dominated BRICS. Without unity, their currency dreams are just hot air.
Act 5: The Numbers Don’t Lie—Dollar’s Here to Stay
Let’s crunch some numbers to seal the deal:
SWIFT Transactions: Dollar: 88%. Euro: 20%. Yuan: 7%.
Global Reserves: Dollar: 59%. Euro: 20%. Yuan: 2.3%.
Oil Trade: 80% in dollars in 2023, down from 100%.
Global Trade: 50% dollar-denominated.
BRICS GDP: $28.5 trillion (28% of global). U.S.: $25.5 trillion (24%).
The dollar’s share is slipping—reserves dropped from 72% post-WWII to 59%—but it’s still laps ahead. BRICS’ push for local currencies is gaining traction (Russia-China trade is 80% non-dollar), but scaling that globally is a pipe dream. The euro flopped as a dollar rival; the yuan’s too controlled; and a BRICS “Unit”? It’s a concept, not a currency.
Act 6: Thought-Provoking Twist—What If BRICS Succeeds?
Let’s indulge in a wild “what if.” Imagine BRICS pulls it off: a gold-backed Unit currency, blockchain payments, and oil priced in yuan. The dollar crashes, inflation spikes, and Americans pay $10 for a coffee. Scary, right? Former White House economist Joe Sullivan warned BRICS could swing an “economic wrecking ball” at the dollar.
But here’s the catch: a BRICS win hurts BRICS too. Their economies rely on dollar-based trade—China holds $3 trillion in U.S. Treasury bonds. A dollar collapse tanks their assets. Plus, who trusts a BRICS currency when China’s calling the shots? As Ray Dalio noted, de-dollarization is “financial risk management,” not a revolution. BRICS wants options, not chaos.
Act 7: The Funny Finale—BRICS’ Comedy of Errors
Picture BRICS at a poker table, bluffing with a bad hand. Russia’s got rubles nobody wants. China’s yuan is chained to Beijing’s whims. India’s like, “I’m just here for the snacks.” Brazil’s dreaming of free trade, and South Africa’s wondering why they RSVP’d. Meanwhile, the dollar’s dealing cards, smirking, “You sure you wanna bet against me?”
The de-dollarization saga is a comedy of errors—big talk, small results. BRICS’ heart is in it, but their heads are in the clouds. The dollar’s not perfect (hello, $34 trillion debt), but it’s the only game in town. As Morgan Stanley’s James Lord said, “When global markets fall, you want dollars.”
Epilogue: Keep Your Eyes on the Dollar
So, what’s the takeaway? De-dollarization is a catchy buzzword, but BRICS can’t dethrone the dollar anytime soon. The greenback’s too entrenched, BRICS too divided, and the world too hooked on dollar-based trade. Will BRICS chip away at the edges? Sure—expect more yuan trades and blockchain experiments. But a dollar-free world? That’s science fiction, not finance.
For traders, here’s a tip: watch DXY’s inverted head-and-shoulders pattern. A breakout above 100 could signal another dollar rally. For everyone else, laugh at the BRICS hype, stash some dollars under your mattress, and enjoy the show. The dollar’s throne isn’t going anywhere—yet.

Summary of the Crude Oil Market This WeekThis week, the crude oil market witnessed a significant decline. Brent crude oil dropped by a cumulative 8.3%, and WTI crude oil fell by 7.5%. Both recorded their largest single-week declines since the end of March.👉👉👉
OPEC+ convened a production meeting ahead of schedule and planned to discuss the production increase plan for June. The market bets that the probability of a production increase is as high as 70%. Previously, OPEC+ unexpectedly announced in April that it would increase daily production by 411,000 barrels starting from May, which is three times the original planned increase. This move aimed to punish member states that had overproduced oil. If production is further increased in June, it will further intensify the supply pressure on the market.
Although the geopolitical tensions in the Middle East region have intensified, such as the postponement of the fourth round of nuclear negotiations between the United States and Iran, which has, to a certain extent, provided support for oil prices, judging from the overall market situation this week, this supporting effect has failed to offset the impact of increased supply and decreased demand.
Overall, this week, under the intertwined influence of factors such as increased supply, uncertain demand prospects, and changes in the geopolitical situation, the crude oil market showed a significant downward trend. The market's expectations for crude oil prices are rather pessimistic, and it is expected that crude oil prices will still face certain downward pressure in the coming period. However, if OPEC+ changes its production increase plan, or if there is an unexpected improvement in the global economy, crude oil prices may rebound.

Will the Fed or Trade Talks Move the Needle?🔎 GOLD WEEKLY SETUP – Will the Fed or Trade Talks Move the Needle?
As we head into a pivotal week, gold finds itself boxed between macro pressures and structural indecision. After bouncing between 3,204 and 3,277 last week, all eyes are now on what could be the two biggest catalysts in months: the FOMC decision and renewed trade signals from Washington and Beijing.
🧭 The Bigger Picture
🇨🇳 China’s surprise SGX:40B tariff waiver suggests de-escalation and improving sentiment.
🇺🇸 US Nonfarm Payrolls came in stronger than expected — adding to hawkish Fed pressure.
💵 DXY & Bond Yields remain strong. As long as the USD holds above 105, upside for gold may remain limited.
🔔 This Week’s Macro Triggers
📆 FOMC Meeting & Powell’s Press Conference
➤ A dovish shift = bullish for gold
➤ Status quo or hawkish tone = room for further downside
📉 US–China Trade Headlines
➤ Continued easing = bearish pressure on gold
➤ New tensions = potential safe-haven bid
📊 Technical Landscape (H4/D1 Chart Focus)
Price action is forming a clear descending wedge, with major support still intact around the 3,204 – 3,224 zone. Previous highs at 3,277 capped last week’s rally and now act as the first barrier to reclaim.
We’re likely to see breakout potential increase mid-week as volatility kicks in post-FOMC.
🎯 Trade Plan – Week of May 6th
🔵 BUY ZONE A:
Entry: 3,204 – 3,202
SL: 3,198
TPs: 3,208 → 3,212 → 3,216 → 3,220 → 3,225 → 3,230
🔴 SELL ZONE:
Entry: 3,276 – 3,278
SL: 3,282
TPs: 3,272 → 3,268 → 3,264 → 3,260 → 3,250 → 3,240
⚠️ Risk Watchlist
🏛 Fed’s tone on rates
📉 DXY approaching 106.5
🌍 Surprise geopolitical or tariff-related news
🧠 Final Thoughts:
This is not a week to predict.
It’s a week to respond.
Gold is coiling. Structure is clear.
Discipline over bias — wait for confirmation, execute with precision.
📌 Follow for midweek intraday updates and real-time FOMC response plans.

The Golden Grain: Trading Corn in Global Markets🟡 1. Introduction
Corn isn’t just something you eat off the cob at a summer barbecue — it’s one of the most widely traded agricultural commodities in the world. Behind every kernel lies a powerful story of food security, global trade, biofuels, and speculative capital.
Whether you’re a farmer managing risk, a trader chasing macro trends, or simply curious about how weather affects global prices, corn futures sit at the crossroads of agriculture and finance. In this article, we’ll explore what makes corn a global economic driver, how it behaves as a futures product, and what traders need to know to approach the corn market intelligently.
🌎 2. Where Corn Grows: Global Powerhouses
Corn is cultivated on every continent except Antarctica, but a handful of countries dominate production and exports.
United States – By far the largest producer and exporter. The “Corn Belt” — spanning Iowa, Illinois, Indiana, Nebraska, and parts of Ohio and Missouri — produces the majority of U.S. corn. U.S. exports also set global benchmarks for pricing.
Brazil & Argentina – These two South American powerhouses are crucial to the global corn supply, especially during the Northern Hemisphere’s off-season.
China – Though a top producer, China consumes most of its own supply and has become a key importer during deficit years.
Corn is typically planted in the U.S. between late April and early June and harvested from September through November. In Brazil, two crops per year are common — including the important safrinha (second crop), harvested mid-year.
Understanding where and when corn is grown is vital. Weather disruptions in any of these regions can ripple through the futures market within hours — or even minutes.
💹 3. Corn as a Futures Market Power Player
Corn is one of the most liquid agricultural futures markets in the world, traded primarily on the CME Group’s CBOT (Chicago Board of Trade). It attracts a diverse set of participants:
Producers and Commercials: Farmers, ethanol refiners, and food manufacturers use corn futures to hedge price risk.
Speculators and Funds: Hedge funds and retail traders speculate on corn price direction, volatility, and seasonal patterns.
Arbitrageurs and Spreads: Traders bet on relative price differences between contracts (e.g., old crop vs. new crop spreads).
The deep liquidity and relatively low tick size make corn accessible, but its price is highly sensitive to weather, government reports (like WASDE), and international trade policies.
🏗️ 4. CME Group Corn Futures: What You Can Trade
The CME Group offers both standard and micro-sized contracts for corn. Here’s a quick overview:
o Standard Corn
Ticker: ZC
Size = 5,000 bushels
Tick = 0.0025 = $12.50
Margin = ~$1,050
o Micro Corn
Ticker: XC
Size = 1,000 bushels
Tick = 0.0050 = $2.50
Margin = ~$105
⚠️ Always confirm margin requirements with your broker. They change with market volatility and exchange updates.
The availability of micro corn contracts has opened the door for smaller traders to manage risk or test strategies without over-leveraging.
📊 5. Historical Price Behavior & Seasonality
Corn is deeply seasonal — and so is its price action.
During planting season (April–May), traders watch weekly USDA crop progress reports and early weather forecasts like hawks. A wet spring can delay planting, leading to tighter supply expectations and early price spikes.
Then comes pollination (July) — the most critical stage. This is when heatwaves or drought can do serious damage to yield potential. If temperatures are unusually high or rainfall is scarce during this window, markets often react with urgency, bidding up futures prices in anticipation of reduced output.
By harvest (September–November), prices often stabilize — especially if production matches expectations. But early frost, wind storms, or excessive rain during harvest can still trigger sharp volatility.
Many experienced traders overlay weather models, soil moisture maps, and historical USDA data to anticipate season-driven price shifts.
Even international factors play a role. For example, when Brazil’s safrinha crop suffers a drought, global corn supply tightens — impacting CME prices even though the crop is thousands of miles away.
🧠 6. What Every New Trader Should Know
If you’re new to corn trading, here are some key principles:
Watch the Weather: It’s not optional. Daily forecasts, drought monitors, and precipitation anomalies can move markets. NOAA, Open-Meteo, and private ag weather services are your friends.
Know the Reports: The WASDE report (World Agricultural Supply and Demand Estimates), USDA Crop Progress, and Prospective Plantings reports can shake up pricing more than you might expect — even if changes seem small.
Mind the Time of Year: Seasonality affects liquidity, volatility, and trader behavior. March–August tends to be the most active period.
Understand Global Demand: The U.S. exports a huge portion of its crop — with China, Mexico, and Japan as major buyers. A tariff tweak or surprise Chinese cancellation can cause wild price swings.
🛠️ Good corn trading is 50% strategy, 50% meteorology.
🧭 This article is part of a broader educational series exploring the relationship between agricultural commodities and weather patterns. In the upcoming pieces, we’ll dive deeper into how temperature and precipitation affect corn, wheat, and soybeans — with real data, charts, and trading insights.
📅 Watch for the next release: “Breadbasket Basics: Trading Wheat Futures.”
When charting futures, the data provided could be delayed. Traders working with the ticker symbols discussed in this idea may prefer to use CME Group real-time data plan on TradingView: www.tradingview.com - This consideration is particularly important for shorter-term traders, whereas it may be less critical for those focused on longer-term trading strategies.
General Disclaimer:
The trade ideas presented herein are solely for illustrative purposes forming a part of a case study intended to demonstrate key principles in risk management within the context of the specific market scenarios discussed. These ideas are not to be interpreted as investment recommendations or financial advice. They do not endorse or promote any specific trading strategies, financial products, or services. The information provided is based on data believed to be reliable; however, its accuracy or completeness cannot be guaranteed. Trading in financial markets involves risks, including the potential loss of principal. Each individual should conduct their own research and consult with professional financial advisors before making any investment decisions. The author or publisher of this content bears no responsibility for any actions taken based on the information provided or for any resultant financial or other losses.

GOLD D1 Chart Update For Shorter Term TradingRead all levels mentioned in chart carefully as we have 2 directions
Right now GOLD standing at turning point
GOLD remains in BUY trend as long as stays above 2900-3000 Zone

Gold's Symmetrical Triangle Near Break – Support Test Imminent!Gold ( OANDA:XAUUSD ) moved as I expected in my previous post and attacked the Support zone($3,282-$3,245) and Support lines for the second time . The question is, can Gold break the Support zone($3,282-$3,245) and Support lines or not!?
Please stay with me .
Gold is moving between Support zone($3,282-$3,245) and Resistance zone($3,386-$3,357) again . In fact, it can be said that Gold has been moving in a range for the past 5-6 days .
From a Classical Technical Analysis perspective, Gold appears to be forming a Symmetrical Triangle Pattern. A break of either line could indicate the next direction for Gold, but since the Symmetrical Triangle Pattern is a Continuation Pattern , the lower line is more likely to break .
In terms of Elliott Wave Theory analysis , it seems that we still have to wait for the next five downwaves .
------------------------------------------
Today, important U.S. data — JOLTS Job Openings and CB Consumer Confidence — will be released.
Let’s quickly review their potential impact on Gold:
JOLTS Job Openings :
If the number comes lower than expected , it signals a weakening labor market, increasing the chances of a dovish Fed → Bullish for Gold .
If the number is stronger than expected , it indicates a robust labor market, pushing the Fed to stay hawkish → Bearish for Gold .
CB Consumer Confidence :
A drop in consumer confidence reflects economic worries , driving demand for safe-haven assets like Gold → Bullish .
A rise in consumer confidence shows economic strength, reducing the appeal of Gold → Bearish .
Historical Impact :
Both indices have caused strong intraday moves in Gold recently, especially if the figures surprise the market.
Summary :
Weak JOLTS and low Confidence → Gold bullish
Strong JOLTS and high Confidence → Gold bearish
Be prepared for high volatility during the releases. Always manage your risk carefully!
------------------------------------------
I expect Gold to attack the Support zone($3,282-$3,245) and Support lines for at least the third time , and if it breaks, the next target could be $3,223 .
Note: If Gold can move above $3,393, we can expect more pumps and maybe make a new All-Time High(ATH).
Gold Analyze ( XAUUSD ), 1-hour time frame.
Be sure to follow the updated ideas.
Do not forget to put a Stop loss for your positions (For every position you want to open).
Please follow your strategy; this is just my idea, and I will gladly see your ideas in this post.
Please do not forget the ✅' like '✅ button 🙏😊 & Share it with your friends; thanks, and Trade safe.

NATGAS Resistance Ahead! Sell!
Hello,Traders!
NATGAS is growing sharply
But the price is nearing a
Strong horizontal resistance
Around 3.80$ so after the
Retest on Monday we will be
Expecting a local bearish
Correction as Gas is already
Locally overbought
Sell!
Comment and subscribe to help us grow!
Check out other forecasts below too!
Disclosure: I am part of Trade Nation's Influencer program and receive a monthly fee for using their TradingView charts in my analysis.

GOLD WILL GO DOWN|SHORT|
✅GOLD is going down now
After a breakout a retest
A and a pullback from the
Key horizontal level
Of 3280$ so we are bearish
Biased and we will be expecting
A further bearish move down
SHORT🔥
✅Like and subscribe to never miss a new idea!✅
Disclosure: I am part of Trade Nation's Influencer program and receive a monthly fee for using their TradingView charts in my analysis.

Bearish Rejection at Resistance – Potential Drop Incoming🔍 Chart Analysis Summary
1. Key Zones
Resistance Zone: ~$3,340 – $3,360
Price has been rejected multiple times from this area, showing strong selling pressure.
Support Zone: ~$3,200 – $3,240
Strong historical support level, previously held during a pullback after the last rally.
2. Moving Averages
EMA 50 (Red): Currently at ~$3,340
Price is fluctuating around it, indicating short-term indecision or a possible retest.
EMA 200 (Blue): Currently at ~$3,300
Acting as a mid-term support level. Price previously bounced from this region.
3. Pattern and Price Action
Fakeout Potential:
The chart suggests a possible false breakout above the resistance followed by a sharp drop—highlighted by the arrow. This is a common bull trap setup.
Bearish Outlook Indicated:
The projected path suggests a rejection from resistance and a drop to the support zone (~$3,200). This would create a lower high, a bearish sign.
4. Trading Bias
Bearish Setup if:
Price fails to hold above $3,340 (EMA50).
Price gets rejected from the resistance zone and breaks below $3,300 (EMA200).
Bullish Invalidated if:
Price closes convincingly above the $3,360 resistance with volume, flipping it into support.
📉 Potential Trade Idea
Short Entry: Around $3,350–$3,355
Stop Loss: Above $3,365 (above resistance zone)
Target: $3,220–$3,230 (support zone)

Gold trend layout in the evening after the release of NFP data🗞News side:
1. Pay attention to the recent trade situation and news about the Fed's interest rate cuts
2. Be wary of DXY trends
3. The situation of the Russian-Ukrainian war and the follow-up events of the India-Pakistan conflict
📈Technical aspects:
The short orders in hand have already been profitable, and gold is now back near 3250, while the US dollar index has once again fallen by 100, reaching around 99.6, and the 1H moving average is currently showing signs of turning upward. The upper and lower shadow lines of the 1H K-line closing look like cross stars of equal length, which means that things may go wrong, and gold may rebound upwards in the short term. We can still focus on the resistance of 3260-3270 above, and further focus on the first-line resistance of 3280-3286, while the bottom has never been able to effectively break through the first-line support of 3240. If this week closes at 3240, then the market outlook next week will be conducive to long trading.
Intraday operation suggestions
🎁SELL 3260-3270
🎁TP 3245-3240
🎁BUY 3230-3240
🎁TP 3260-3270
If you agree with this point of view, or you have a better idea, please leave a message in the comment area. I look forward to hearing different voices.
OANDA:XAUUSD FX:XAUUSD FXOPEN:XAUUSD FOREXCOM:XAUUSD TVC:GOLD
Bearish Reversal Setup: Resistance Rejection Targeting Key Chart Overview:
Asset: Unspecified (likely XAU/USD or an index based on price levels)
Indicators:
EMA 50 (red) — currently around 3,306.84
EMA 200 (blue) — currently around 3,300.54
Key Zones:
Resistance Zone: ~3,320 to 3,360
Support Zone: ~3,190 to 3,240
Technical Analysis:
Trend Context:
The asset previously had a strong bullish run, peaking above 3,400.
After the peak, it shifted into a lower high structure, indicating potential distribution.
Price is currently fluctuating below the resistance zone but above the support zone, suggesting range-bound conditions.
Moving Averages (EMA Analysis):
The 50 EMA is currently below the 200 EMA, signaling short-term bearish pressure.
Price is hovering around these EMAs, suggesting indecision and the possibility of a breakout or breakdown.
Resistance Behavior:
Price is projected to retest the resistance zone (~3,340–3,360) before a major drop.
The resistance zone has already acted as a strong supply area multiple times, reinforcing its significance.
Support Expectation:
After rejection from the resistance zone, price is expected to decline sharply toward the support zone (~3,200).
The drawn arrows suggest an expectation of a rapid sell-off after the final fake-out at resistance.
Structure and Price Action:
The forecasted scenario shows a liquidity grab above resistance (fake breakout) followed by a strong bearish reversal.
This is typical in a "distribution phase" where market makers induce breakout traders before reversing the move.
Summary:
Primary Bias: Bearish
Setup: Short from resistance rejection after liquidity sweep.
Target: Support zone around 3,200.
Invalidation: A clean breakout and retest above the resistance zone (~3,360) would invalidate the bearish idea.
Risk Management: Ensure proper stop loss above resistance to mitigate risk in case of a genuine breakout.

GOLD → Correction before NFP. What are the chances of a decline?FX:XAUUSD strengthens amid dollar correction. The market is correcting ahead of NonFarm Payrolls, trying to accumulate potential before high volatility.
Gold recovers ahead of US employment report
On Friday, gold rebounded from a two-week low, recouping some of its losses ahead of the release of US labor market data (NFP), which could set the tone for prices going forward. Amid optimism over trade talks and a strong dollar, gold ended its worst week in two months, but geopolitical tensions and a potentially weak jobs report could boost demand for safe-haven assets again.
The correction in the dollar gives gold a small chance to strengthen. However, fundamentally, the overall trend has already set the tone and gold may continue to fall.
Resistance levels: 3268, 3285, 3295
Support levels: 3227, 3204
The correction may reach a local zone of interest (money pool) — liquidity above 3270, or the 0.7 Fibonacci zone, after which the price may continue its course along the new trend — down to 3193.
However, unpredictable and unexpected data could disrupt the structure and push the price up to 3320-3350.
Best regards, R. Linda!

The decisive day of major data (USOIL)
Yesterday, it was pointed out in the analysis circle: The support of 58 needs to be tested. Sure enough, buying at low levels continued to expand profits. The current price is 59.6. From the pressure analysis, the market is still affected by data that oversupply, and institutions will not reduce production in a short time. Therefore, oil prices will fall further,
The oil price broke through 59. Due to supply reasons, the market still has a downward range. 60-61 is a good choice to sell in succession.
tp58-57

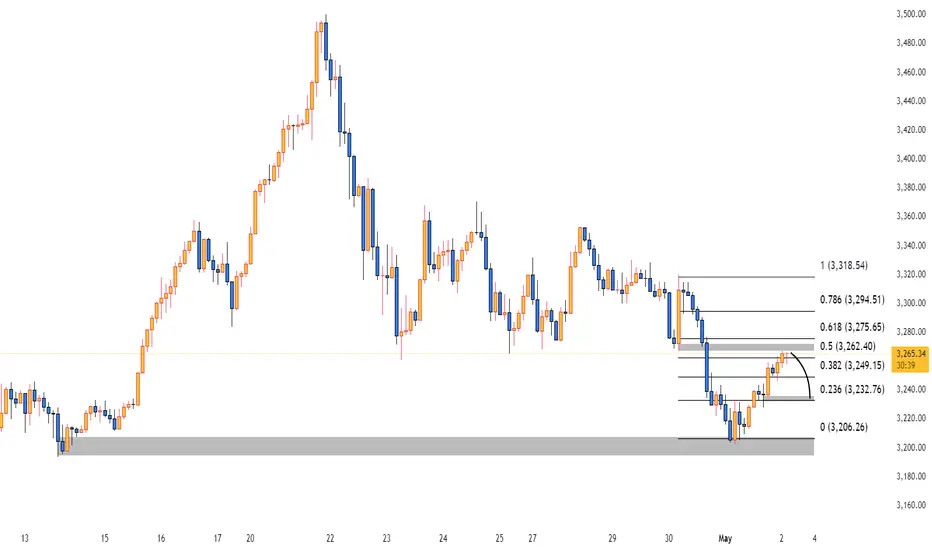
XAUUSD Analysis🟡 XAUUSD Analysis – May 2, 2025
Chart Overview:
Price is reacting near the 0.5–0.618 Fibonacci retracement zone (~3262–3275), a key supply area.
A bearish rejection candle is forming at 3264.51, showing resistance.
The projection curve on the chart suggests a potential pullback to the 0.236 (3232.76) or even 0 (3206.26) level.
🧠 Fundamental Catalyst (Today’s NFP):
If the NFP comes out weak (138K or lower) as expected:
USD may weaken → gold could break above 3275 and aim for 3294 or higher.
If NFP beats expectations significantly (e.g., above 200K):
Strong USD → This bearish setup could play out → Gold may drop toward 3232 or 3206.
📉 Signal (Short-term idea):
Bias: Bearish below 3275
Entry: Sell near 3265–3275 (supply zone)
TP1: 3232
TP2: 3206
GOLD ROUTE MAP UPDATEHey Everyone,
Great finish to the week, after completing both our Bullish and Bearish target yesterday, we then finished off with our retracement range gaps.
We also stated that we will look for a cross and lock below this level to open the swing range or failure to lock, will see support and bounce on this level.
This played out perfectly with no lock confirming the rejection and then the bounce allowing us to buy the dip. We are now seeing the level retested again and respecting it perfectly for another bounce.
We will keep the above in mind when taking buys from dips. Our updated levels and weighted levels will allow us to track the movement down and then catch bounces up.
We will continue to buy dips using our support levels taking 30 to 40 pips. As stated before each of our level structures give 20 to 40 pip bounces, which is enough for a nice entry and exit. If you back test the levels we shared every week for the past 24 months, you can see how effectively they were used to trade with or against short/mid term swings and trends.
BULLISH TARGET
3343 - DONE
BEARISH TARGETS
3282 - DONE
EMA5 CROSS AND LOCK BELOW 3282 WILL OPEN THE FOLLOWING BEARISH TARGET
3224 - DONE
EMA5 CROSS AND LOCK BELOW 3224 WILL OPEN THE SWING RANGE
SWING RANGE
3190 - 3138
We will now come back Sunday with our updated Multi time-frame analysis, Gold route map and trading plans for the week ahead.
Have a smashing weekend!! And once again, thank you all for your likes, comments and follows, we really appreciate it!
Mr Gold
GoldViewFX

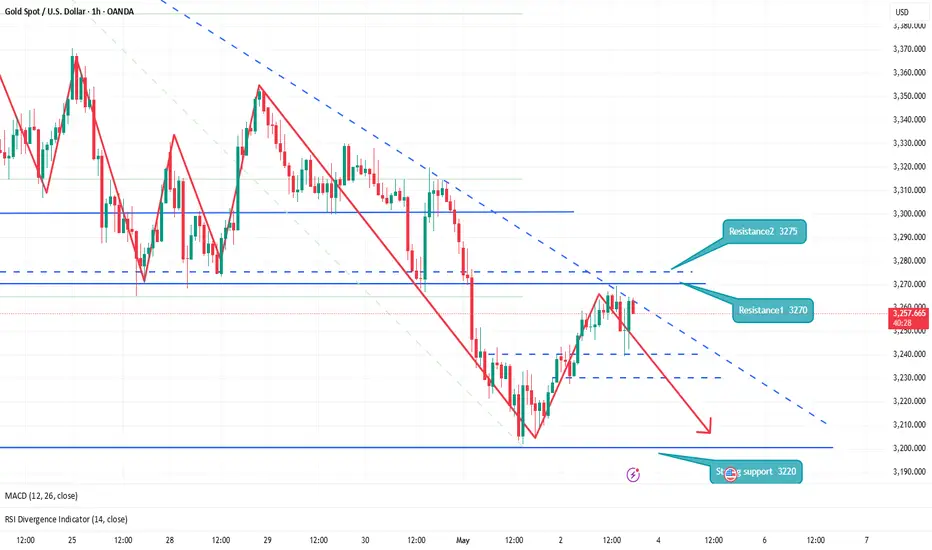
Analysis of the latest gold trend on May 2:
Key technical signal confirmation
Trend break: 4-hour chart confirms breaking below the bottom of the 3270-3260 box, 1-hour moving average dead cross (such as MA5 crossing MA20), short momentum increases.
Resistance conversion: The previous support 3260-3270 (trading concentration area) turns into strong resistance, and a rebound to this point can be regarded as a short-selling opportunity.
Weakness sign: If the rebound cannot reach 3260, it indicates that the market is extremely weak and may accelerate the decline.
Today's operation strategy
Short opportunity
Ideal short-selling area: 3260-3270 (reverse pressure position after the box breaks), stop loss set above 3280, target down to 3220→3200.
Aggressive short-selling: If the price rebound is weak, enter the market in batches at 3245-3255 (1-hour moving average suppression area), stop loss 3265, target the same as before.
Long positions should participate cautiously
Short-term rebound only: If the support of 3190-3200 is touched for the first time (previous low of the daily line or Fibonacci retracement level), a light position can be used to rebound, with a stop loss of 3180 and a target of 3220-3230.
Key points:
First resistance: 3245 (dynamic pressure of 1-hour MA20 moving average)
Strong resistance: 3260-3270 (break conversion position).
Support below:
First target: 3200 (short-term psychological barrier)
Strong support: 3165-3175 (weekly support band).
Market sentiment and risk management
Short sellers dominate: The 4-hour MACD is heavy in volume below the zero axis, and the RSI is below 40. You need to be alert to oversold rebounds but do not blindly buy the bottom.
Data risk: If there is sudden news in the European or US market (such as a pullback of the US dollar or geopolitical conflicts), the stop loss needs to be adjusted flexibly.
Summary: The market is mainly rebounding and high-altitude during the day. The market remains bearish below 3260. Long orders are only used as a quick entry and exit aid. Traders need to confirm the entry timing based on real-time price momentum (such as the 15-minute K-line engulfing pattern) and strictly control their positions.

GOLD - WAVE 4 CORRECTION TO $2,800 (UPDATE)We've seen a nice melt off on Gold this week. We're seeing a little push higher today as its the end of the week. But don't forget Gold is still in a downside correction in the mid term. SELL THE PUMPS.
Still looking for some form of 'Simple 3 Sub-Wave (A,B,C)' or 'Complex 5 Sub-Wave (A,B,C,D,E)' correction towards our longer term buying target at $2,800📈
