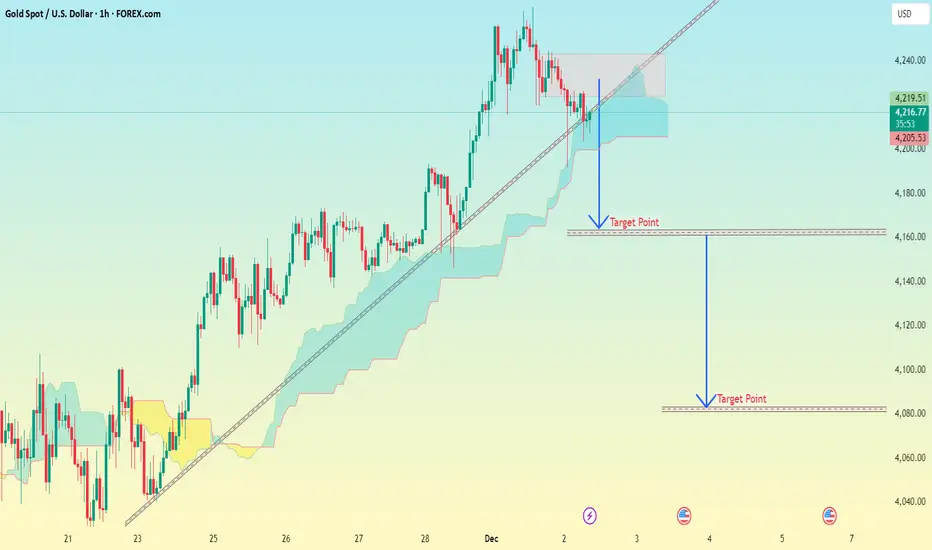
Xauusd 1H chart Pattern..Here is a clean professional analysis with accurate targets based on the chart I'm shared (trendline break + cloud retest + liquidity zones):
---
📉 XAUUSD Analysis & Targets
Market Structure
Price broke the ascending trendline
Currently retesting the cloud support zone
Sellers are strong from 4235–4245 supply zone
Liquidity is resting below 4180 & 4160
---
🎯 Target Levels (Based on Analysis)
🔻 TP1: First Breakdown Target
4185 – 4178
Reason: First liquidity pocket + trendline retest.
---
🔻 TP2: Major Support Target
4165 – 4155
Reason: Imbalance fill + cloud lower band + horizontal demand.
---
🔻 TP3: Extended Drop Target
4120 – 4105
Reason: Large imbalance area + my lower drawn target zone.
---
🔻 TP4 (Deep Target / Final)
4095 – 4085
Reason: Strong historical demand + liquidity sweep zone.
---
📌 Summary
Target Level
TP1 4185–4178
TP2 4165–4155
TP3 4120–4105
TP4 4095–4085
Commodities
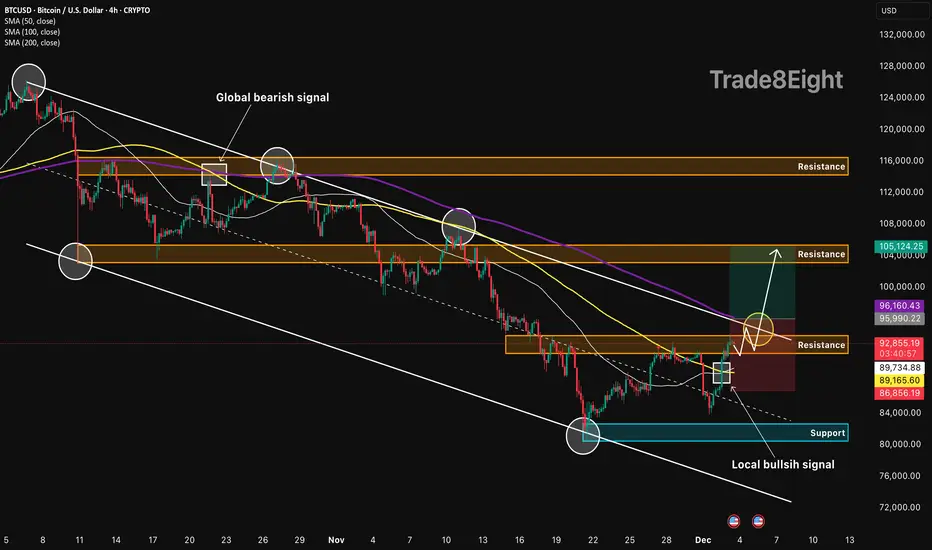
BTCUSD: channel breakout setup🛠 Technical Analysis: On the 4-hour timeframe, Bitcoin (BTCUSD) is trading within a descending channel but has recently printed a "local bullish signal" after bouncing from the 82,000 support zone. The price is currently compressing against the channel's upper trendline and the immediate resistance block at 92,877, with the moving averages (SMA 50, 100) flattening to support a potential reversal. The projected trade setup anticipates a high-momentum breakout above the SMA 200 and the diagonal resistance, targeting the liquidity pool at the 105,000 level.
❗️ Trade Parameters (BUY) ❗️
➡️ Entry Point: Buy on confirmed breakout of resistance (approx. 95,500 – 96,200)
🎯 Take Profit: 104,500 – 105,120
🔴 Stop Loss: Below SMA (approx. 86,850)
⚠️ Disclaimer: This is a potential trade idea based on current analysis; market conditions and price direction are subject to change based on news factors and volatility.
SILVER Will Go Lower From Resistance! Sell!
Please, check our technical outlook for SILVER.
Time Frame: 4h
Current Trend: Bearish
Sentiment: Overbought (based on 7-period RSI)
Forecast: Bearish
The market is testing a major horizontal structure 5,852.3.
Taking into consideration the structure & trend analysis, I believe that the market will reach 5,592.7 level soon.
P.S
Overbought describes a period of time where there has been a significant and consistent upward move in price over a period of time without much pullback.
Like and subscribe and comment my ideas if you enjoy them!

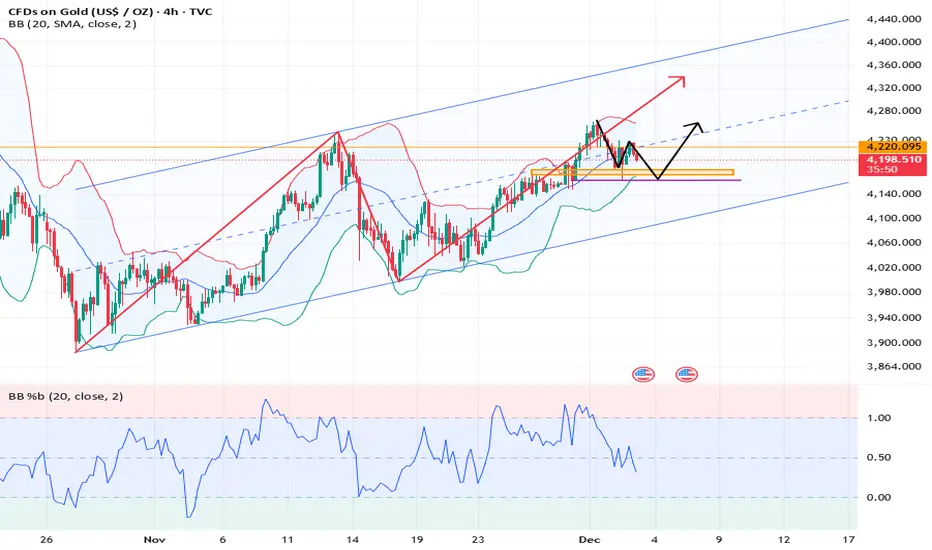
Gold (XAUUSD) – Eyeing a Sweep Toward 4273–4281Gold continues to show intraday strength after holding above recent higher-low structure.
The current bullish leg appears corrective in nature, with price aiming toward the
4273–4281 supply zone highlighted on the chart.
From a fundamental perspective, demand for gold remains supported as markets weigh
the possibility of softer U.S. economic data and expectations of future Fed easing in 2026.
Risk-off flows have also kept buyers active on dips. As long as price holds its internal
bullish structure, a push into the overhead imbalance remains likely.
I’ll be watching how price reacts once it reaches the 4273–4281 zone — this area could
offer a reaction or potential short-term reversal depending on order flow.

Gold Potential UpsidesHey Traders, in today's trading session we are monitoring XAUUSD for a buying opportunity around 4,185 zone, Gold is trading in an uptrend and currently is in a correction phase in which it is approaching the trend at 4,185 support and resistance area.
Trade safe, Joe.

GOLD BEARS WILL DOMINATE THE MARKET|SHORT
Hello, Friends!
GOLD is making a bullish rebound on the 4H TF and is nearing the resistance line above while we are generally bearish biased on the pair due to our previous 1W candle analysis, thus making a trend-following short a good option for us with the target being the 4,132.94 level.
Disclosure: I am part of Trade Nation's Influencer program and receive a monthly fee for using their TradingView charts in my analysis.
✅LIKE AND COMMENT MY IDEAS✅

BTC 100K Breakout or Rejection Next? | Follow for more insightsBITSTAMP:BTCUSD is approaching a key support zone near $87,500–$88,000. If price holds and bounces from this zone, the next upside target could be $95,000 — with possible follow‑through toward $100,000+ if bulls regain strength.
On the flip side — a decisive break below $87,500 would raise risk toward $80,000.
Watch for a clean daily close and volume confirmation before entering. Manage risk carefully; avoid chasing a bounce.
Silver = to the moon??? September 03, 2025Who’s Loading Up:
A top dog at Pan American Silver Corp., a heavyweight in North American silver digs, just scooped up a hefty chunk of shares.
Deal Size: This exec grabbed 50,000 shares at $22.50 a pop on August 28, 2025, dropping $1.125 million—talk about putting skin in the game!
Company Lowdown
Pan American Silver Corp. runs 10 mines across the Americas, packing 468 million ounces of silver and 6.7 million ounces of gold. Based out of Vancouver, they’ve got cash flowing like a river, fueling big bets like La Colorada Skarn and Escobal.
Sector Vibes:
• The Silver Institute’s calling for a fifth straight supply crunch in 2025, with photovoltaics and AI tech demand hitting all-time highs.
• Tariff threats, green energy boom, and a possible Fed rate cut in September 2025 could send silver soaring.
Big Funds Jumping In
Last quarter (June–August 2025), heavy hitters like Sprott Asset Management (+8% in Pan American), BlackRock Inc. (+5% in iShares Silver Trust), and Invesco Ltd. (+6% in VanEck Silver Miners ETF) piled into silver.
Buzz on X says Saudi Central Bank’s dipping its toes into silver via iShares Silver Trust (SLV), ditching its gold-only playbook.
London Vaults Drying Up
The LBMA’s silver stash is under siege from a supply deficit. With 150 million ounces short in 2024, the Silver Institute hints reserves might shrink 5–10% yearly if demand keeps raging, setting the stage for a price explosion.
1979 Boom & 2025–2026 Wild Cards
1979 Flashback: The Hunt Brothers’ silver grab, plus inflation and oil chaos, rocketed silver from $6 to $50/oz (+700%). Gold jumped from $300 to $850/oz on similar vibes.
2025–2026 Triggers:
Inflation’s sticky above 3%, the USD’s wobbling from tariffs, and a Fed cut looms in September 2025. Watch for U.S.-China trade wars, Middle East flare-ups, or a BRICS metals exchange—any could ignite a 1979-style silver rocket if deficits worsen.
Price Targets:
Short-Term (3 months): $60.00 (+46.9%)
Mid-Term (6–12 months): $120.00 (+193.7%)
Long-Term (18–24 months): $240.00 (+487.5%)
🤔🤔🤔🤔🤔🤔🤔🤔

While Gold Stalls, Silver Eyes The 60-Record Silver has broken above a 45-year resistance, turning the 54-barrier into a potential support level moving forward. If silver continues to hold above this multi-decade structure, a new era for the metal could unfold in alignment with triple-digit long-term forecasts supported by the expansion of technology and green-energy industries — including solar panels, electric batteries, and industrial tech use cases.
From a weekly perspective, silver’s price action is aligned with the upper bound of a duplicated up-trending channel respected between August 2022 and September 2025. The 60 zone remains a key psychological resistance level — and a potential retracement trigger. Beyond that, Fibonacci extension measurements from the July 2025 low and the October 2025 high-and-low sequence outline the next upside zones near 64 and 69.
On the downside, if a reversal emerges below the daily low of 56.20 and the previous 2025 record at 54.30, retracement risks may extend toward the mid-zone of the new channel between 51.80 and 50.80. A confirmed hold below this area could pave the way for deeper declines toward 45 and 43.90 — aligning with a historical resistance zone connecting consecutive higher highs between January 2023 and October 2024, before silver possibly resumes its bullish course.
Written by Razan Hilal, CMT

WTI Outlook: Downtrend Bias vs. Bullish HoldFrom a weekly timeframe perspective, crude’s price action has been trending within a downward-sloping parallel channel since October 24, inside a larger downtrending channel from June 2025, which itself sits within an even broader downtrend dating back to December 2023. This multi-layered structure frames the overall bias as bearish and defines the key levels that must be breached to shift the outlook from short-term movements toward a more favorable long-term structure.
Starting with the one-month channel:
• Key upside breakout levels lie at the 60-mark.
• The next resistance sits near the upper boundary of the six-month channel at 62.60.
• A confirmed close above this level could extend gains toward the two-year channel boundary at 66.40 first, then 70, before confirming a longer-term bullish breakout structure.
On the downside, beginning with the one-month channel again:
• A sustained hold below 56 is expected to extend declines toward the six-month channel support at 55.
• A confirmed close below 55 could extend losses toward the original long-term channel boundary at 49, offering another potential buy-the-dip opportunity.
A possible double-bottom reversal pattern could emerge, either from the 55 low or from the 49 low, for a longer-term rebound. However, as long as price remains within the bounds of the downtrending channel established since 2023, the broader bearish bias is expected to persist.
The key levels mentioned above remain the main dividing lines between structural bullish and bearish shifts in crude oil, despite the complex mix of fundamental drivers shaping the market.
- Razan Hilal, CMT

XAU/USD Daily OutlookYesterday’s session reminded us of the importance of adaptability.
As mentioned earlier, I did not expect 4193 to be invalidated, but once it broke during the New York session, I adjusted and entered short at 4190, targeting 4155 and 4135.
Due to limited bearish conviction, I managed trades manually and closed at 4182 and 4174.
Overall, a disciplined and productive Tuesday.
Today’s Technical Setup
Tokyo High: 4229
Previous Day High: 4236.50
As long as this resistance belt remains intact, I’ll stay away from buy positions.
If this zone is invalidated, I will act accordingly.
Yesterday’s price action suggests gold is attempting to form a higher low, but bearish momentum is limited - partly due to fundamentals.
London Session Plan:
Look for sell opportunities below 4200
Target: 4165
ADP Nonfarm Employment Change (Nov) release during the New York session will likely drive volatility and set the tone for the day.
Fundamental View
Gold’s downside remains capped by geopolitical tensions and expectations of Fed rate cuts, which reduce the opportunity cost of holding gold.
However, strong U.S. labor data could strengthen the dollar and pressure gold lower.
Conversely, weaker data would reinforce bullish sentiment and increase the likelihood of a breakout above the 4230–4236 zone.

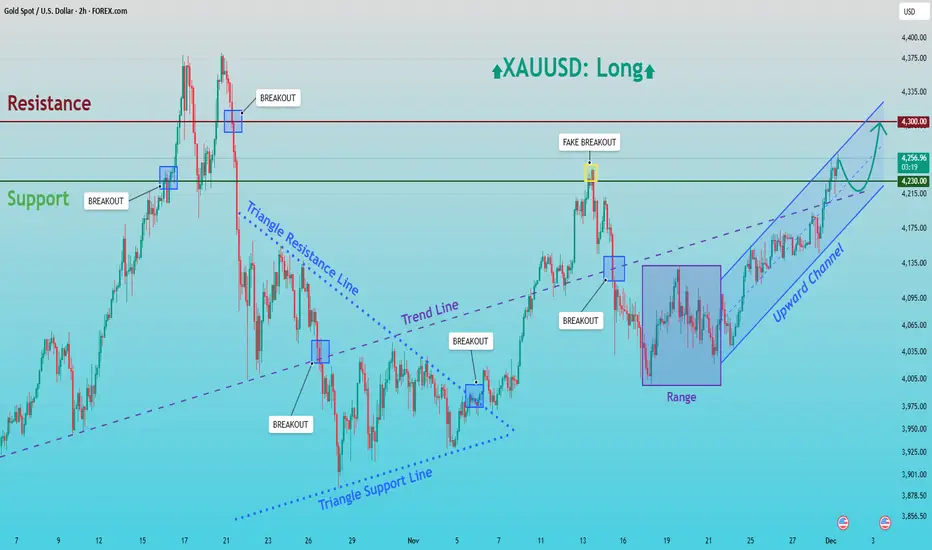
XAUUSD: Buyers Eye Retest of the $4,300 Resistance ZoneHello everyone, here is my breakdown of the current XAUUSD setup.
Market Analysis
Gold continues to trade within a well-structured bullish environment following a strong recovery from the lower Triangle Support Line earlier in the month. After a prolonged corrective phase inside a symmetrical triangle, price eventually broke above the Triangle Resistance Line, shifting the market structure from consolidation into bullish continuation. This breakout created a clear trend shift, supported by a steady sequence of higher highs and higher lows. After the breakout, XAUUSD entered a temporary Range phase, suggesting accumulation from buyers before the next impulsive move. Once price broke out of that range to the upside, the market formed a clean Upward Channel, showing sustained bullish pressure. A notable fake breakout above the Resistance Zone around 4,260 occurred recently, indicating strong seller activity at the top of the zone, but buyers quickly regained control and continued to push price upward within the channel.
Currently, gold is trading near the mid-upper area of the Upward Channel, approaching the 4,300 key Resistance Zone. The broader technical picture shows clear bullish market structure, with trendline support and channel dynamics favoring further upside as long as the channel remains intact.
My Scenario & Strategy
My scenario is bullish, supported by the strong rebound within the Upward Channel and the consistent higher-low structure. As long as price remains above the 4,215–4,230 Support Zone and respects the channel’s lower boundary, buyers hold a clear advantage. My expectation is that XAUUSD may make a minor pullback toward the mid-channel zone near 4,230 to gather liquidity before continuing the upward movement.
Therefore, the primary bullish target remains the 4,300 Resistance Zone, where a retest is highly probable. A clean breakout above 4,300 would open the door for a stronger rally and signal continuation of the broader bullish cycle. However, if gold fails to break the resistance and forms a deeper correction, the Upward Channel support and the prior breakout zone at 4,215 will be key levels to watch. The bullish bias remains valid as long as these supports hold. For now, the structure favors a long scenario with attention on the move toward 4,300 and potential bullish continuation beyond that level.
That's the setup I'm tracking. Thank you for your attention, and always manage your risk.
GOLD 1H GOLD 1H
A structured approach to market analysis combining Fibonacci retracement levels with key Support & Resistance zones.
Price action is monitored to identify reaction points, liquidity zones, and potential reversal or continuation setups.
The analysis focuses on high-probability confluence areas where Fibonacci ratios align with historical structure levels, helping traders spot optimal entry points, stop-loss zones, and profit-taking targets.

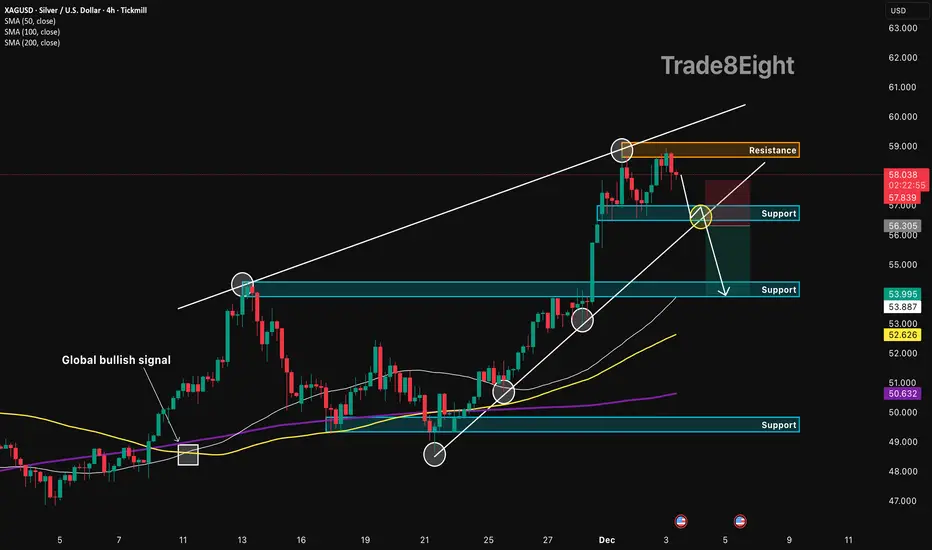
XAGUSD: reversal from resistance🛠 Technical Analysis: On the 4-hour timeframe, silver (XAGUSD) rebounded from the important resistance level of 59.00, signaling a potential bearish reversal. Currently, the price is likely to test the nearest support at 56.30, a confirmed break of which would provide a potential sell entry. The trading setup suggests a correction toward the demand zone at 54.00, which coincides with the support area marked on the chart.
❗️ Trade Parameters (SELL) ❗️
➡️ Entry Point: Sell on breakdown of support (approx. 56.30)
🎯 Take Profit: 53.90 – 54.00 (Support Zone)
🔴 Stop Loss: Above local resistance structure (approx. 57.85)
⚠️ Disclaimer: This is a potential trade idea based on current analysis; market conditions and price direction are subject to change based on news factors and volatility.
EUR/USD | What to expect? (READ THE CAPTION)Hello everybody, Amirali here, back with another analysis.
By examining the 4H chart of EURUSD, you can see that yesterday, EURUSD dropped all the way to 1.15900 before going back up to 1.16520 and then consolidated below 1.16500, before closing the supply zone. and going up to 1.16600 There's an old New Week Opening Gap (NWOG) between 1.1651 to 1.1667, I believe that if it fails to go through there, it might drop all the way to 1.16250. If it manages to go through the NWOG, a rise to 1.17000 is possible.

XAGUSD: countertrend setup🛠 Technical Analysis: On the 1-hour timeframe, Silver (XAGUSD) is forming a classic "Head and Shoulders" reversal pattern, signaling a potential shift from the recent uptrend to a bearish correction. Price is currently testing the critical neckline support around 56.600; a confirmed breakdown below this level would validate the pattern. The projected trade aims for a decline toward the confluence of the ascending trendline and the 100 SMA near the 54.750 support zone.
🌍 Fundamental Analysis: The metal is facing selling pressure as traders book profits ahead of crucial US economic data due this week, specifically the ISM Services PMI and the Non-Farm Payrolls (NFP). Market sentiment suggests that any signs of resilience in the US labor market could bolster the Dollar and bond yields, thereby weighing on non-interest-bearing assets like Silver. Additionally, year-end portfolio rebalancing in December often triggers volatility and corrective moves in commodities.
❗️ Trade Parameters (SELL) ❗️
➡️ Entry Point: Sell on breakdown of the neckline support (approx. 56.300 – 56.600)
🎯 Take Profit: 54.059
🔴 Stop Loss: Above the right shoulder resistance (approx. 57.903)
⚠️ Disclaimer: This is a potential trade idea based on current analysis; market conditions and price direction are subject to change based on news factors and volatility.

XAUUSD: Market Analysis and Strategy for December 3rd.Gold Technical Analysis:
Daily Resistance: 4300, Support: 4131
4-Hour Resistance: 4245, Support: 4160
1-Hour Resistance: 4230, Support: 4180
Technically, the "hammer" candlestick pattern on the daily chart from the previous trading day indicates strong buying pressure on dips. Both the daily and 4-hour charts maintain an upward channel, and the moving average correction is largely complete, suggesting a continuation of the upward trend. The next key resistance level to watch is the 4245/4250 area; a decisive break above this level is crucial for short-term gains. The MACD/KDJ correction is also largely complete, with support around 4180.
Combined with the 1-hour chart, the price has pulled back after a surge. We await a bottoming out before looking for buying opportunities.
During the NY session, we plan to buy on a pullback to around 4180/4170.
BUY: 4180near
BUY: 4170near
More Analysis →
GOLD ANALYSIS 13/02/2025Fundamental Analysis:
a) Economy:
• USD:
The USD slightly rebounded after a deep decline due to profit-taking flows during the week, but the broader trend remains weakening as the market expects the FED to keep or cut rates in upcoming meetings, supporting gold.
• US Stock Market:
Wall Street rose slightly; capital is leaning toward risk assets but not strongly. This prevents gold from being heavily sold and helps maintain stable buying momentum.
• FED:
FED officials signal maintaining a stable policy stance, with no signs of rate hikes returning. This continues to support gold in the medium term.
• TRUMP:
The Trump administration is applying trade pressure in multiple regions, creating a certain degree of uncertainty → gold benefits from geopolitical risks.
• Gold ETF (SPDR):
SPDR sold 1.72 tons as a probing move yesterday, showing institutional profit-taking. A negative signal for gold.
b) Politics:
• Geopolitical tensions in the Middle East and several hotspots remain unstable.
• New tensions in Europe regarding energy and borders.
→ These factors support gold in maintaining its upward bias.
c) Market Sentiment:
• The market is in a mild risk-off state, with defensive flows returning after yesterday’s sharp 70-dollar drop.
• Strong dip-buying appeared densely around the support area, causing price to rebound quickly.
• Gold demand in Asia rises during the year-end season, supporting gold.
→ Current sentiment leans toward buying when price corrects.
Technical Analysis:
M15 timeframe:
• Gold sharply flushed 70 dollars down to the support zone at 4,164 and bounced back.
• The bullish structure remains intact, not yet broken.
• MA20 – MA50 are converging, preparing to restore upward momentum.
• RSI bounced from the 30 zone → showing a clear counterattack from buyers.
• The neckline around 4,186 is being retested.
• If it breaks above 4,231 → next targets: 4,274 → 4,320 → 4,380.
→ Overall, the model still signals a continuing uptrend; yesterday’s drop was only a market reset.
→ When gold flushes, do not catch the falling knife, do not chase sells (Sell orders are dangerous because selling comes from panic, buying comes from greed). Wait for price to hit strong support and show bullish signals, then buy strongly. Still captures the move but safely.
RESISTANCE: 4,231 - 4,274 - 4,320
SUPPORT: 4,200 - 4,186 - 4,164
Market Recap (Dec 2):
• Gold dropped sharply by 70 dollars due to profit-taking and thin liquidity in the US session.
• Then it rebounded strongly, proving the uptrend has not been broken.
• SPDR’s probing sell indicates gradual profit-taking near ATH.
Strategy for Today (Dec 3):
🪙 SELL XAUUSD | 4277 – 4275
SL: 4281
TP1: 4269
TP2: 4263
🪙 BUY XAUUSD | 4191 – 4193
SL: 4187
TP1: 4199
TP2: 4205

GOLD → The battle for zone 4200. Bullish trend FX:XAUUSD is forming a local trading range of 4180-4230, trying to stay above 4200 after yesterday's correction ahead of important US employment and services data.
The dollar is weakening amid expectations of a Fed rate cut on December 11. News concerning Powell, namely Fed chair candidate Kevin Hassett (a well-known “dove”), is supporting gold. Geopolitical risks (stagnation in Russia-Ukraine negotiations) are increasing demand for safe-haven assets.
• In focus today: ADP employment data and ISM Services PMI.
• Weak indicators will strengthen bets on Fed policy easing and support gold.
Gold retains its upside potential. The release of US data could either accelerate growth to $4300 or trigger a correction in the event of strong indicators.
Resistance levels: 4230, 4260
Support levels: 4185, 4175
Gold is testing 4200 for strong support. Local trading range 4180 - 4230. A false breakout of support amid a bullish trend and a weak dollar could support gold's growth.
Best regards, R. Linda!

Could we se a reversal from here?Gold (XAU/USD) is reacting off the pivot and could drop to the 1st support which aligns with the 61.8% Fibonacci retracement.
Pivot: 4,263.04
1st Support: 4,097.06
1st Resistance: 4,364.63
Disclaimer:
The opinions given above constitute general market commentary and do not constitute the opinion or advice of IC Markets or any form of personal or investment advice.
Any opinions, news, research, analyses, prices, other information, or links to third-party sites contained on this website are provided on an "as-is" basis, are intended to be informative only, and are not advice, a recommendation, research, a record of our trading prices, an offer of, or solicitation for, a transaction in any financial instrument and thus should not be treated as such. The information provided does not involve any specific investment objectives, financial situation, or needs of any specific person who may receive it. Please be aware that past performance is not a reliable indicator of future performance and/or results. Past performance or forward-looking scenarios based upon the reasonable beliefs of the third-party provider are not a guarantee of future performance. Actual results may differ materially from those anticipated in forward-looking or past performance statements. IC Markets makes no representation or warranty and assumes no liability as to the accuracy or completeness of the information provided, nor any loss arising from any investment based on a recommendation, forecast, or any information supplied by any third party.

GOLD breaks out of accumulation phaseOANDA:XAUUSD has moved from a consolidation phase to an active bull run: spot is trading around ~$4,200/oz, supported by expectations of Fed easing (markets are pricing in ~89% probability of a 25bp cut in December), central bank buying and a still uncertain geopolitical backdrop. In this context, a $5,000/oz target is no longer a pipe dream but a conceivable scenario, but only if a number of technical and fundamental conditions align.
Analysis (fundamentals — geopolitics)
1. Fundamentals: Central banks’ net buying (WGC: strong net buying), a weaker USD and falling real Treasury yields are the three fundamentals supporting gold. Recent weak US economic data (weak manufacturing PMI, ADP and PCE potentials reinforce cooling sentiment) push the market to price in higher interest rate cuts, reducing the opportunity cost of holding gold.
2. Geopolitics: Russia-Ukraine negotiations remain uncertain; regional tensions (Middle East, US-Venezuela relations…) maintain safe-haven demand. External shocks could spur rapid and strong demand for gold.
Conditions for the $5,000 scenario (necessary & sufficient)
• Necessary: The Fed makes at least one 25 bps cut in the near term (December) or the market is certain of a rate cut cycle; real yields continue to fall; the USD remains weak; the central bank continues to buy net.
• Sufficient: Price breaks the $4,216–$4,226 resistance zone on higher than average volume, accompanied by a sustained decline in real yields (-real basket) and no sharp reversal in the USD. When all three factors (technical break, real yield decline, sustained official demand) are present, the $5,000 target becomes a trackable possibility in the medium-long term.
Risks
Bear case risks include: the Fed unexpectedly takes a hard/clear stance without cutting, the USD strengthens again (e.g. due to better employment data), or market liquidity declines leading to massive profit-taking by funds. These factors could push gold back below $4,000 and break the short-term bullish structure.
In summary, the journey to $5,000 is a structurally plausible scenario: the macro fundamentals and the official demand flow are tilted to the upside, but that scenario will only be triggered by a volume-driven technical breakout combined with a sustained decline in real yields. I maintain a cautiously positive stance, closely monitoring the underlying geopolitical developments and yield developments to assess the sustainability of this rally.
Technical analysis and recommendations OANDA:XAUUSD
Gold price is maintaining a clear bullish structure as it continues to follow the medium-term rising channel and holds the important support zone around 4,128 – 4,130 USD/ounce (Fibo 0.236). The price continuously making higher lows and bouncing back above the short-term MA shows that active buying power is still dominant. The most recent candlestick pattern shows strong absorption at the support zone, implying that money flow is protecting the uptrend.
With no break below 3,973 USD/ounce (Fibo 0.382), the bullish structure continues to be consolidated. The next target of the current cycle is 4,300 – 4,380 USD/ounce, corresponding to the top of the rising channel and the extended Fibo zone. RSI is recovering from the neutral zone, showing that the upside momentum still has room to grow.
SELL XAUUSD PRICE 4277 - 4275⚡️
↠↠ Stop Loss 4281
→Take Profit 1 4269
↨
→Take Profit 2 4263
BUY XAUUSD PRICE 4191 - 4193⚡️
↠↠ Stop Loss 4187
→Take Profit 1 4199
↨
→Take Profit 2 4205

Gold Looks Heavy,Downside Break Loading?📰 What’s happening:
Gold is losing strength because the market thinks rate cuts are not coming soon.
Strong USD = weak gold.
Simple.
📉 What the chart is showing:
Selling pressure is stacking up.
Market structure is leaning bearish.
We’re sitting right on a major support zone: $4,200
⚠️ Why this matters:
If this support cracks, gold could slide fast into the $4,100zone — that’s the next clean liquidity area.
📌 My view:
I’m watching for a break → retest → continuation to the downside.
Buyers look tired. Sellers look hungry.

XAUUSD – Long Bias on the 4H TimeframeXAUUSD continues to show strong bullish momentum on the 4-hour chart, with price action positioning toward the 4,300 level. Recent market liquidity developments, including a reported $13B liquidity injection by the Federal Reserve, have contributed to a softer U.S. dollar, providing additional support for precious metals.
Geopolitical tensions remain elevated, particularly following the recent rejection of a proposed peace agreement in the East, adding to risk-off sentiment and strengthening safe-haven demand for gold.
From a technical perspective, silver has printed new all-time highs, reinforcing bullish sentiment across the metals complex. Gold itself has confirmed a clean breakout and retest, maintaining structure above key support and validating the continuation bias.
Overall, fundamentals and technicals are currently aligned in favor of further upside.
