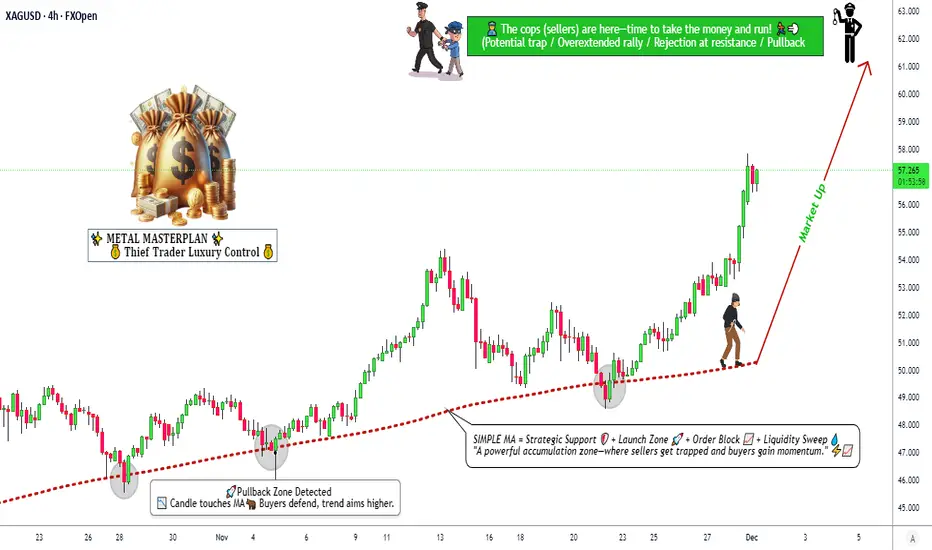
Strong Bullish Structure Developing in Silver🚀 XAG/USD (SILVER) Swing Blueprint | Bullish Structure Intact | Key Levels Mapped! ⚔️
🎯 Metals Market Opportunity: Silver (XAG/USD) Swing Trade Setup
📈 Direction: Bullish | Swing Trade
🏷 Asset: XAG/USD - Silver vs. U.S. Dollar
⚖️ Core Thesis: Silver is building a potential swing bullish structure, aiming for a significant resistance zone. This plan outlines the key framework.
📊 Trade Plan (Blueprint)
✅ Entry Zone: Consider entries on pullbacks or strength confirmation. (Any price level entry - discipline is key).
🛑 Stop Loss (Risk Management):
"This is thief SL @ 54" 💎
Dear Traders (The OG Crew), 👊
This is my protective level. YOU MUST adjust your SL based on YOUR OWN risk tolerance & strategy. I do not recommend using only my level. Manage your capital wisely.
🎯 Target Zone: @ 62 Area.
This aligns with a strong historical resistance + potential overbought/trap zone. 🪤 The strategy is to "escape with profits" as price approaches.
Note: This is my target. Take profits based on your own analysis and risk-reward goals.
🔍 Related Pairs & Market Correlations (Must-Watch) 🔗
Monitoring these pairs provides context for Silver's move:
🦅 TVC:DXY (U.S. Dollar Index):
Key Point: INVERSE correlation. A weaker TVC:DXY typically boosts commodities priced in USD, like Silver. Watch for DXY breakdowns for added Silver bullish confirmation.
🟡 XAU/USD (Gold):
Key Point: STRONG positive correlation. Gold is the leader. A strong, bullish Gold market often drags Silver higher (and vice-versa). Silver's moves can be more volatile ("Gold on steroids").
📈 US 10-Year Treasury Yields / TVC:TNX :
Key Point: General inverse relationship. Rising real yields can pressure non-yielding metals. Watch for yield pullbacks that may relieve pressure on Silver.
⛽️ Crude Oil ( BLACKBULL:WTI / ICMARKETS:XBRUSD ):
Key Point: Inflation/Commodity Sentiment Gauge. Rising oil can signal broader commodity strength and inflation fears, which can benefit Silver as a real asset.
📊 Copper ( CAPITALCOM:COPPER ) & AMEX:GDX (Gold Miners ETF):
Key Point: Industrial / Risk Sentiment. Copper confirms industrial demand outlook. AMEX:GDX strength confirms bullish precious metals sector momentum.
💎 Final Notes
This is a blueprint, not financial advice.
You are the captain of your own capital. 🧭
Always use proper position sizing.
Markets are dynamic—always monitor for structure breaks.
Let's get this bread... responsibly! 🥖
✅ Like & Follow if you find this detailed blueprint valuable! It helps the idea reach more traders. 💡
#SILVER #XAGUSD #TradingSetup #SwingTrading #Commodities #PreciousMetals #Forex #TradingView #DXY #GOLD #XAUUSD #Analysis
Commodities
USOIL Set To Grow! BUY!
My dear friends,
Please, find my technical outlook for USOIL below:
The instrument tests an important psychological level 58.48
Bias - Bullish
Technical Indicators: Supper Trend gives a precise Bullish signal, while Pivot Point HL predicts price changes and potential reversals in the market.
Target - 58.94
Recommended Stop Loss - 58.19
About Used Indicators:
Super-trend indicator is more useful in trending markets where there are clear uptrends and downtrends in price.
Disclosure: I am part of Trade Nation's Influencer program and receive a monthly fee for using their TradingView charts in my analysis.
———————————
WISH YOU ALL LUCK

Silver - Warning #1 IssuedSilver has seen uninterrupted gains for a period of over 1.5 years. It's going to just keep going up forever right? Not necessarily...
Our systems at Bullfinder-official have identified potential risk in MCX:SILVER1! ,
issuing Warning #1.
Silver has been moving aggressively to the upside for some time now, hitting +166% since Feb of 2024, with momentum deemed as Bullish since March of 2024.
Although this may not be the exact top of this run, we would like to make note that current regions present greater levels of risk and may warrant greater caution.
We're inspired to bring you the latest developments across worldwide markets, helping you look in the right place, at the right time.
Thank you for reading! Stay tuned for further updates, and we look forward to being of service along your trading & investing journey...
Disclaimer: Please note all information contained within this post and all other Bullfinder-official Tradingview content is strictly for informational purposes only and is not intended to be investment advice. Please DYOR & Consult your licensed financial advisors before acting on any information contained within this post, or any other Bullfinder-official TV content.

SILVER Will Grow! Long!
Here is our detailed technical review for SILVER.
Time Frame: 17h
Current Trend: Bullish
Sentiment: Oversold (based on 7-period RSI)
Forecast: Bullish
The market is testing a major horizontal structure 5,240.5.
Taking into consideration the structure & trend analysis, I believe that the market will reach 5,614.1 level soon.
P.S
Please, note that an oversold/overbought condition can last for a long time, and therefore being oversold/overbought doesn't mean a price rally will come soon, or at all.
Like and subscribe and comment my ideas if you enjoy them!

GOLD Will Move Higher! Buy!
Please, check our technical outlook for GOLD.
Time Frame: 9h
Current Trend: Bullish
Sentiment: Oversold (based on 7-period RSI)
Forecast: Bullish
The market is approaching a significant support area 4,165.22.
The underlined horizontal cluster clearly indicates a highly probable bullish movement with target 4,240.67 level.
P.S
Please, note that an oversold/overbought condition can last for a long time, and therefore being oversold/overbought doesn't mean a price rally will come soon, or at all.
Like and subscribe and comment my ideas if you enjoy them!

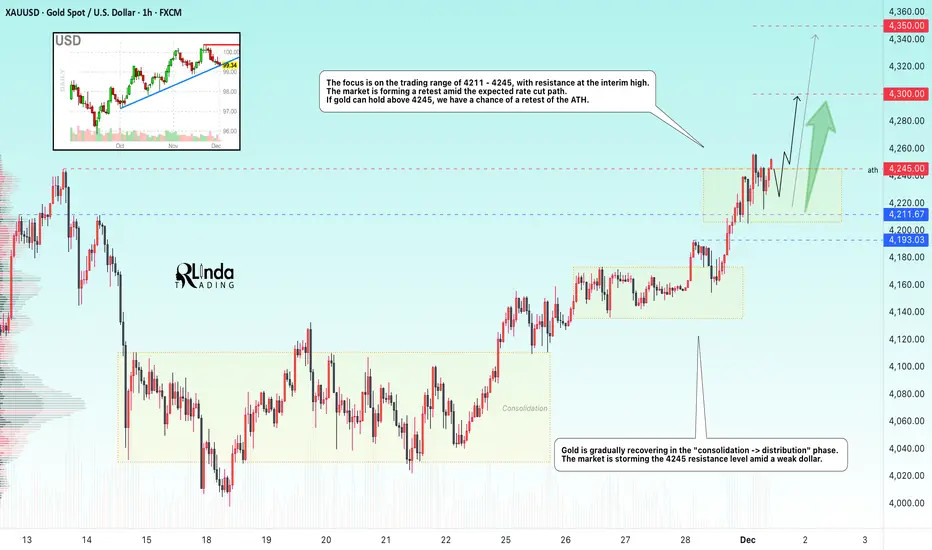
GOLD → The bullish trend continues. Retest of 4250FX:XAUUSD is trading at six-week highs near $4,250, supported by a weaker dollar and expectations of a Fed rate cut. The market is storming key resistance...
The probability of a December rate cut is 87%. The dollar is posting its worst week in four months after failing to consolidate above 100.0. A break in local trend support could trigger a decline in the index, which would support gold.
Today's focus is on the ISM Manufacturing PMI (forecast: 48.6). Weakness in the data could increase pressure on the dollar and support gold.
Gold maintains its upward trend, supported by loose monetary policy. Key data this week could boost momentum ahead of the Fed meeting.
Resistance levels: 4245, 4300
Support levels: 4211, 4193
A retest of 4245 could end with a pullback within the current consolidation at 4211 - 4245. Two scenarios: If the bulls hold the price above 4245, a rally to 4300 is expected. Otherwise, the market could retest 4215 - 4211 with the aim of a long squeeze before rallying. The trend is bullish, and the fundamental background is relatively positive.
Sincerely, R. Linda!
GOLD LONG FROM SUPPORT
GOLD SIGNAL
Trade Direction: long
Entry Level: 4,043.86
Target Level: 4,189.14
Stop Loss: 3,946.77
RISK PROFILE
Risk level: medium
Suggested risk: 1%
Timeframe: 9h
Disclosure: I am part of Trade Nation's Influencer program and receive a monthly fee for using their TradingView charts in my analysis.
✅LIKE AND COMMENT MY IDEAS✅

GOLD bounces back amid Fed signals and political turmoilOANDA:XAUUSD opened the Asian trading week with strong upward momentum, reflecting rising confidence that the Federal Reserve will cut interest rates as early as December. Spot gold reached $4,256.31/oz, gaining $37 within just a few hours — the highest level in five weeks.
Shifting rate-cut expectations remain the dominant driver. A series of dovish comments from Fed officials, combined with weakening economic data following the U.S. government shutdown, has led the market to price in an 87% probability of a rate cut, according to FedWatch. As the opportunity cost of holding gold decreases, capital is rapidly flowing into non-yielding safe-haven assets.
Long-term support remains intact: accelerating purchases by central banks and significant inflows into gold ETFs helped push prices to a historical peak of $4,380/oz in October. With an almost uninterrupted rally since the start of the year, gold is on track for its strongest annual performance since 1979.
However, the monetary-policy outlook is clouded by political uncertainty. President Trump announced he had chosen a successor to Chairman Jerome Powell and asked the nominee to commit to a more aggressive rate-cutting cycle.
Kevin Hassett, a senior White House economic advisor, is now estimated by markets to have a 64% probability of being appointed — a sharp rise from last week. A more politically influenced Fed could increase volatility across asset markets.
On the geopolitical front, early signs of reconciliation between the U.S. and Ukraine have temporarily reduced safe-haven demand, but not enough to slow gold’s upward momentum. Washington’s decision to send envoy Steve Witkov to Moscow this week signals a new diplomatic phase, though risk levels remain elevated.
Today’s main focus is the ISM Manufacturing PMI. A stronger-than-expected reading may support the USD in the short term, slowing gold’s advance. Conversely, weaker data would reinforce rate-cut expectations and continue to support the metal’s upward trend.
With rapidly changing policy expectations, firm technical momentum, and persistent geopolitical risk, the gold market enters December with a clearly bullish structure — but also heightened sensitivity as the Fed and the White House reshape policy direction simultaneously.
Technical Analysis & OANDA:XAUUSD Outlook
• Trend structure: Price is maintaining a medium-term ascending channel, continuously forming higher lows and higher highs, indicating that the primary uptrend remains intact.
• Key level has been reclaimed: Price closed above the 4,128–4,216 USD resistance zone (Fib 0.236 and horizontal resistance), while also holding above the short-term MA21. This satisfies both the necessary condition (holding above support/trendline) and the sufficient condition (breaking and confirming a key resistance zone) for an uptrend cycle to be considered underway.
• Momentum indicators: RSI has recovered above the mid-range and is not yet overbought, suggesting there is still room for upside momentum.
• Technical conclusion: With a close and sustained move above 4,216 USD, the bullish structure is confirmed. The next immediate technical target is to retest the all-time high around ~4,380 USD/oz, with the next extension zone near 4,500 USD in a strong capital-inflow scenario.
SELL XAUUSD PRICE 4331 - 4329⚡️
↠↠ Stop Loss 4335
→Take Profit 1 4323
↨
→Take Profit 2 4317
BUY XAUUSD PRICE 4191 - 4193⚡️
↠↠ Stop Loss 4187
→Take Profit 1 4199
↨
→Take Profit 2 4205

Triple Top - Double Bottom. Go Next Golden Shift4125 for a potential reload (supply area). 4275 - to make it all back.

Silver: A Sell Signal?COMEX: Micro Silver Futures ( COMEX_MINI:SIL1! )
What happened to the silver market? A previous all-time-high (ATH) record of $49.95 per ounce was set on January 17, 1980, and stood for 45 years until silver broke $50 in October 2025. Since then, silver prices kept climbing nonstop and setting new ATH records almost daily. Last Friday, November 28th, silver reached $56.86.
COMEX Silver Futures ( AMEX:SIL ) locked in an impressive 98% return year-to-date, which makes silver the top performer across all major asset classes year to date.
The strength of silver is supported by a confluence of factors including inflows into bullion-backed ETFs and expectations of a potential Federal Reserve interest rate cut. Investors rotated assets out of stock amid recent market weaknesses, benefiting the safe-haven assets gold and silver. In addition, gold purchases have slowed in recent months due to the record high prices. Some investors may choose silver as an alternative hedging asset.
However, a key metric suggests that the tide is about to change.
A Refresher:
In my writing published on April 28th, I introduced the Gold-Silver Ratio, a financial term that measures the relative value of gold to silver. The Gold-Silver Ratio may be used as a buying or selling signal.
When to Buy Silver : A high Ratio, typically above the 95:1 mark, suggests that silver is undervalued relative to gold. This is often interpreted as a buying signal for silver.
• Recalling that in the April 28th writing, we explored the idea of buying silver at $33 when the Ratio stood at 100. Silver prices went up 72% since then.
When to Sell Silver : When the Ratio is low, say around 80:1, it indicates that silver is relatively expensive. Investors might consider selling silver and buying gold.
• As silver caught up with gold with its recent rally, the Ratio is declining all the way down to 74. This is a level indicating silver is very expensive relative to gold. From a mean-reversing point of view, the Ratio may rebound back to the 80-90 range soon.
In my opinion, gold could show more strength compared to silver in the new year.
• Global central banks have slowed gold purchases recently. Gold getting expensive did not cause the pause. Annual budget depleting may be a more plausible reason. A new year comes with new budget, and I expect central bank buying to resume in 2026.
• Silver is part precious metal and part industrial metal. Global GDP in 2026 is projected to slow to 2.9% to 3.1%, with downside risks from geopolitical tensions and trade policy uncertainty, according to the IMF. Industrial use of silver could slow as well.
• Expectations of Fed rate cuts are rising. The stock market could rally again, causing investors to rotate money out of safe-haven assets. In my opinion, gold could stand its ground better than silver, with central bank purchases serving as a key support. In this scenario, the Ratio rises because silver falling faster than gold.
Trade Setup with Micro Silver
Traders could apply the insights from the Gold-Silver Ratio with trading strategies using COMEX Micro Silver Futures ( AMEX:SIL ). There are a number of reasons why shorting silver makes sense:
• Traders expect mean-reversion of the Gold-Silver Ratio will occur soon.
• Investors expect Fed rate cuts to be bullish for stocks and bearish for precious metals.
• Traders with portfolio of spot silver or silver ETF want to hedge their positions.
The big advantages of using futures contracts are capital efficiency and leverage. Micro Silver contracts have a notional value of 1,000 troy ounces of silver. With Friday settlement price of $57.455, each January contract (SILF6) has a notional value of $57,455. Buying or selling one contract requires an initial margin of $4,000 at the time of writing. This suggests a built-in leverage of 14.4 (= 57455/4000) for futures contracts.
By putting a deposit equivalent to 70 ounces, traders could gain the full exposure of 1,000 ounces of silver. If silver prices move down by 10%, a short position in Micro Silver futures would gain 144% (= (57455*0.1) / 4000).
Micro silver futures (SIL, 1000 oz) and standard-size silver futures contracts (SI, 5000 oz) contracts together form a deep liquidity pool. On November 28th, SI had trade volume of 109,967 contracts and an open interest (OI) of 155,222 contracts. SIL had volume and OI of 79,015 and 14,900 contracts, respectively, according to data from CME Group.
To hedge the risk of rising silver prices, a trader could set a stoploss on his short-silver order. For illustration, a short order is executed at 57.455 with a stoploss at 59.0. If silver goes up 10% to $63.2, the maximum loss will be $1,545 (= (59-57.455)*1000), well within the margin account balance of $4,000.
Happy Trading.
Disclaimers
*Trade ideas cited above are for illustration only, as an integral part of a case study to demonstrate the fundamental concepts in risk management under the market scenarios being discussed. They shall not be construed as investment recommendations or advice. Nor are they used to promote any specific products, or services.
CME Real-time Market Data help identify trading set-ups and express my market views. If you have futures in your trading portfolio, you can check out on CME Group data plans available that suit your trading needs www.tradingview.com

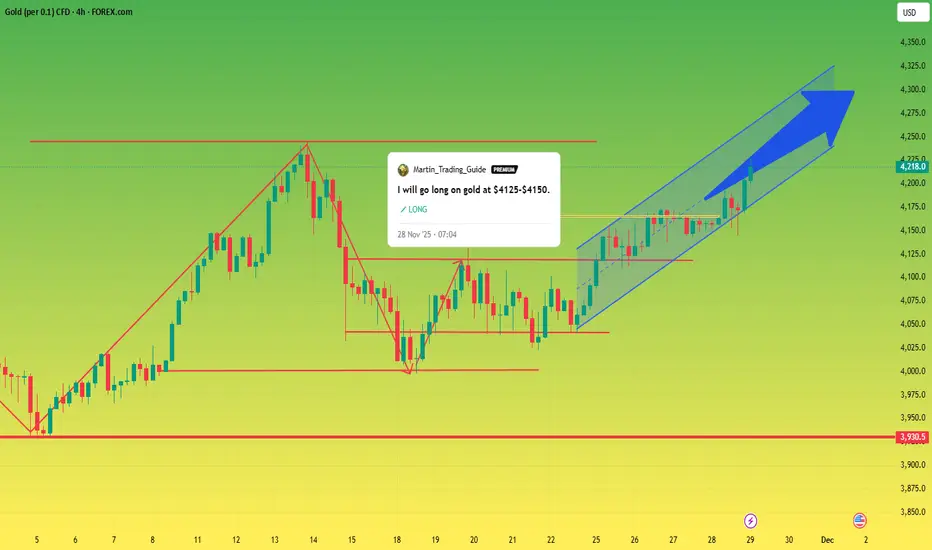
Go long on gold in the 4185-4205 range after the market opens!Last week, the gold market performed steadily overall, with prices rising steadily and limited intraday pullbacks, avoiding significant volatility and creating a favorable market environment for traders. In terms of trading strategy, we maintained a long position strategy for several trading days from opening to closing, aligning our overall approach with market trends. Our previous prediction that Friday's closing price would break through $4200 has indeed materialized. It's worth noting that we still have long positions established at the $4050 level in our account. Readers who have not followed this viewpoint can refer to historical analysis records to understand the complete logical context.
From a technical perspective, gold is gradually regaining its strength, with prices effectively recovering previous losses and continuing to approach previous highs. On the weekly chart, prices have stabilized above major moving averages, and the daily and hourly charts also show positive signals. Based on the current trend, the trading strategy after the market opens will still focus on going long. I plan to build positions in batches within the 4185 to 4205 range. This area has strong technical support and the risks are relatively controllable.
The above are personal analyses and opinions, for reference only. For investors who have not yet developed a clear trading system or lack independent market analysis capabilities, we welcome exchanges and discussions to jointly improve our professional skills. If significant changes occur in the market, relevant adjustments will be promptly announced through this channel.
Hellena | GOLD (4H): LONG to resistance area of 4382(Wave 3).In the past forecast, many have rightly pointed out that wave “4” went behind the high of wave “2” and yet we are not dealing with a diagonal.
This means that the waves have stretched and have a larger range of motion and now the correction in wave “2” is ending.
Essentially the upward movement is still prioritized and I expect two scenarios:
1) Continuation of the upward movement to the resistance area of 4382 (market entry)
2) Reaching the support area 3994.4, after which the correction can be considered complete and only then the movement to the area 4382 will start.
Manage your capital correctly and competently! Only enter trades based on reliable patterns!

Silver Cup and HandleAfter some consolidation silver has started showing immense strength. Silver is buy on dips. Take long positions in silver in any dip you get. Check the chart for the cup and handle pattern on the daily timeframe.
Support will be the low of the handle as seen on the chart for big risk takers and for small risk takers sl can be around 157000.
Target- One can look for all time highs as target and then 180000.
Disclaimer- This is just for educational purpose.
Jai Shree Ram

Gold remains bullish.From a technical perspective, the monthly chart continues its bullish trend, while the weekly and daily charts closed with significant gains. Last week, after testing the 10-day moving average (MA10) at 4050/40, the price regained support in that area. The daily chart also shows strength, with the MA10 and 7-day moving averages trending upwards, and the lows gradually moving higher. The price is trading within the upper Bollinger Band channel, and the RSI indicator is above the midline. The short-term 4-hour and 1-hour charts also show an upward-trending moving average system, with the Bollinger Bands expanding upwards. The initial trading strategy for gold at the start of the week should focus on buying on dips, followed by selling at key resistance levels.
In the short term, gold prices finally broke through the resistance at 4210, after which they pulled back slightly. Currently, a strong upward trend has formed on a smaller timeframe, and further gains are possible after the pullback. On the 4-hour chart, the main support level is at 4200. If the upward trend continues, a significant pullback is unlikely; therefore, it's important to watch for buying opportunities after a short-term bottom is established.
Key Levels:
First Support: 4208, Second Support: 4190, Third Support: 4172
First Resistance: 4260, Second Resistance: 4276, Third Resistance: 4298
Gold Trading Strategy:
BUY: 4195-4200, SL: 4185, TP: 422-4230;
SELL: 4270-4275, SL: 4285, TP: 4250-4240;
More Analysis →

Gold market {Trend Analysis}Last week we saw gold buy up to 4200's after a delayed bullish momentum until the close of last week's candle. Gold extended its bullish strength up till the 4220's where we closed off for last week. This week we saw gold continue on its bullish sentiment up till the 4250's before the ongoing bearish retracement.
fOLLOWING THE ANALYSIS, we see that gold mitigated its 50% trend channel on the 4hour time-frame before the bearish turnaround back to the 4220's. A break below this zone insinuates more lower liquidity grab back to the 4100's.
Further updates would be given as the market gains momentum

After the market opens, I will continue to go long on gold!The countdown to the opening of the gold market has begun! Before the market opens, let's review last week's market movements and trading strategies.
Last week's market performance was very stable compared to previous weeks, with an overall upward trend and relatively small intraday pullbacks without significant volatility. This kind of market movement is very favorable for traders. Our trading strategy, from opening to closing, focused on going long on gold for several trading days, with our thinking largely in sync with the market movement, including our prediction that Friday's closing price would be above $4200, which all came true. It's no exaggeration to say that I still have long positions held in my account, bought at $4050. For those who haven't followed me, you can check out my historical perspectives.
As seen from last week's price action, gold is regaining its strength, gradually recovering lost ground and approaching previous highs. The weekly price has rebounded above all major moving averages, and the daily and hourly charts also show strength. Therefore, after the market opens, our strategy will remain primarily long. I plan to enter the market in batches in the $4190-$4210 range, a level with strong support and relatively safe entry.
The above views represent my personal thoughts. If you do not yet have a clear trading strategy or the ability to independently analyze market trends, you are welcome to refer to them! Let's improve together! If the market changes, I will notify you in the channel!

Heading into key resistance?WTI Oil (XTI/USD) is rising towards the pivot, which acts as an overlap resitance and could reverse to the 1st support.
Pivot: 62.24
1st Support: 56.51
1st Resistance: 65.75
Disclaimer:
The opinions given above constitute general market commentary and do not constitute the opinion or advice of IC Markets or any form of personal or investment advice.
Any opinions, news, research, analyses, prices, other information, or links to third-party sites contained on this website are provided on an "as-is" basis, are intended to be informative only, and are not advice, a recommendation, research, a record of our trading prices, an offer of, or solicitation for, a transaction in any financial instrument and thus should not be treated as such. The information provided does not involve any specific investment objectives, financial situation, or needs of any specific person who may receive it. Please be aware that past performance is not a reliable indicator of future performance and/or results. Past performance or forward-looking scenarios based upon the reasonable beliefs of the third-party provider are not a guarantee of future performance. Actual results may differ materially from those anticipated in forward-looking or past performance statements. IC Markets makes no representation or warranty and assumes no liability as to the accuracy or completeness of the information provided, nor any loss arising from any investment based on a recommendation, forecast, or any information supplied by any third party.

XRP outcome!XRP did a drop in the Asian session after markets opened up. Possible reversal near this zone going to the London session or a reversal at the bottom of the channel or near it.

GOLD ANALYSIS (1 W)To understand the psychology in Gold,
I use only two tools:
Fibonacci retracement,
Trend-based Fibonacci extension.
We will use these two tools to measure the weekly cycles.
Since November 2022, Gold has been forming a pattern that can only be explained by Fibonacci principles.
Using Fibonacci retracement for each swing high and low, you'll realize that each retracement equals around 50%.
In only one example, we see that a higher low reaches the 61.8% level, which is also acceptable.
After these retracements, the next leg of the impulsive move always reaches around the 1.618 Fibonacci extension.
According to these two basic technical factors, Gold should first reach around $3,800, and then aim for the $6,600 level during the next impulsive leg in the coming years.
I’m not even going to list all the reasons why Gold tends to go up over time.
Most people reading this analysis are already aware of the fundamentals behind Gold’s long-term bullish nature.
Thanks for reading.

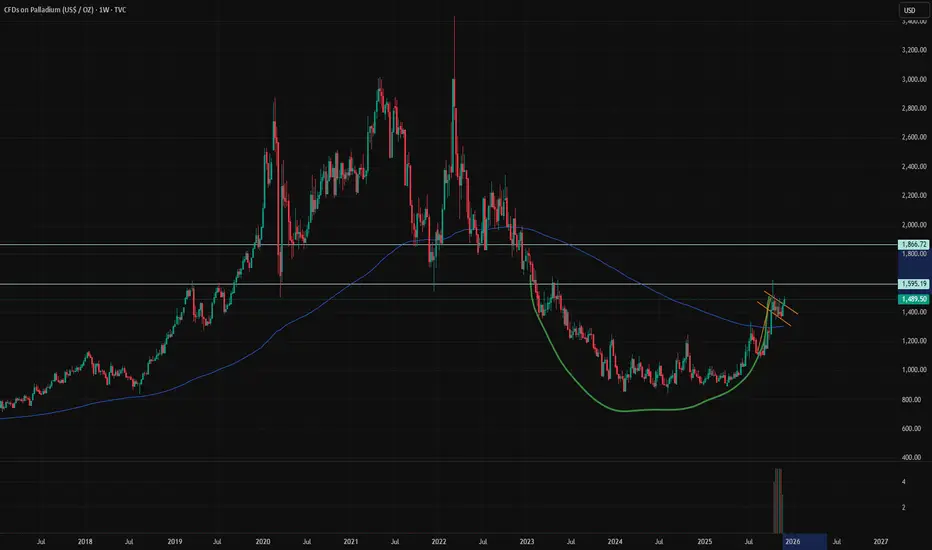
Cup & handle, bull flag - look for a breakoutCommodities are bullish right now if you didn't know.
Silver, Gold, Natural Gas, Palladium and more. They are all interesting right now. Commodities is the sector you should be looking at right now.
We had tech, weedstocks, cryptos, ai
now look for commodities for near term plays.
Speaking of Palladium, I love this chart. Beautiful.
We have a nice formation of a 2 year cup with a resistance at 1600$
Short term, we have near break out of bull flag at 1500$
The blue zone extending to may should be a zone where you have to keep close attention to this chart.
I'm expecting a breakout with target of 1870 ish on palladium. I'm early on this one, there is no breakout at the moment. I just follow the good sector and bet on the nice chart.
Natural Gas - New 52 Week High? Natural Gas appears to be setting up another bullish move this week.
A sweep of its 52 week high seems very likely.
If this sweep of the massive March 2025 high pivot occurs there is a very high probable day trade short scalp opportunity.
I'm watching the next inventory report on Thursday very closely.

Natural Gas | | Oil | Dollar | Silver | Gold Price ForecastNatural Gas | | Oil | Dollar | Silver | Gold Price Forecast
NYMEX:NG1! NYMEX:CL1! COMEX:GC1! COMEX:SI1!
