Potential Decline of Brent Oil Price to $50 in the Near Future.Brief Overview of Events and News Explaining the Potential Decline of Brent Oil Price to $50 in the Near Future.
➖ Increased OPEC+ Production:
On April 3, 2025, eight OPEC+ countries unexpectedly decided to accelerate production increases, adding 411,000 barrels per day starting in May. This decision triggered a price drop, with Brent falling 6.42% to $70.14 per barrel at the time.
Analysts like Amrita Sen from Energy Aspects noted that this move pressures “lagging” countries to meet quotas, but the market interpreted it as an oversupply signal.
Source: OilPrice.com, "OPEC+ to Raise Oil Production by More Than Expected in May," April 3, 2025 (oilprice.com)
➖ Decreased Demand Due to Economic Challenges:
On April 14, 2025, OPEC revised its 2025 oil demand growth forecast downward by 150,000 barrels per day to 1.3 million barrels per day, citing trade tensions and weak economic indicators. JPMorgan also raised the likelihood of a global recession to 60%.
Source: OilPrice.com, "OPEC Lowers 2025 Oil Demand Forecast on Trade Tensions," April 14, 2025 (oilprice.com)
➖ Trade Tariffs and Global Instability:
On April 3, 2025, U.S. President Donald Trump announced new tariffs on trading partners, heightening recession fears. Fitch Ratings described this as the highest level of U.S. import tariffs since 1910. Brent dropped 4% immediately following the announcement.
Source: OilPrice.com, "OPEC+ to Raise Oil Production by More Than Expected in May," April 3, 2025 (oilprice.com)
➖ Geopolitical De-escalation:
On April 25, 2025, reports emerged of progress in U.S.-Russia talks on Ukraine, as well as Iran’s openness to nuclear negotiations. This reduces geopolitical risks and increases the likelihood of higher oil supply on the market.
Source: OilPrice.com, "Oil Set For Weekly Loss on OPEC+ Supply Rumors," April 25, 2025 (oilprice.com)
Technical Analysis Section:
The monthly chart shows similarities between the 1999–2002 and 2020–2025 periods: an initial impulse, followed by a correction, and then a 6-year upward trend.
Nearest entry point targets at the 161.8% Fibonacci level:
• $52,46
• $49,06
• $46,50
Growth Potential
Medium-term:
• $138,00
Long-term:
• $500,00
Once the price of oil UKOIL reaches $52.46, a review for the entry point will be prepared.
Charts:
•
•
Commodities

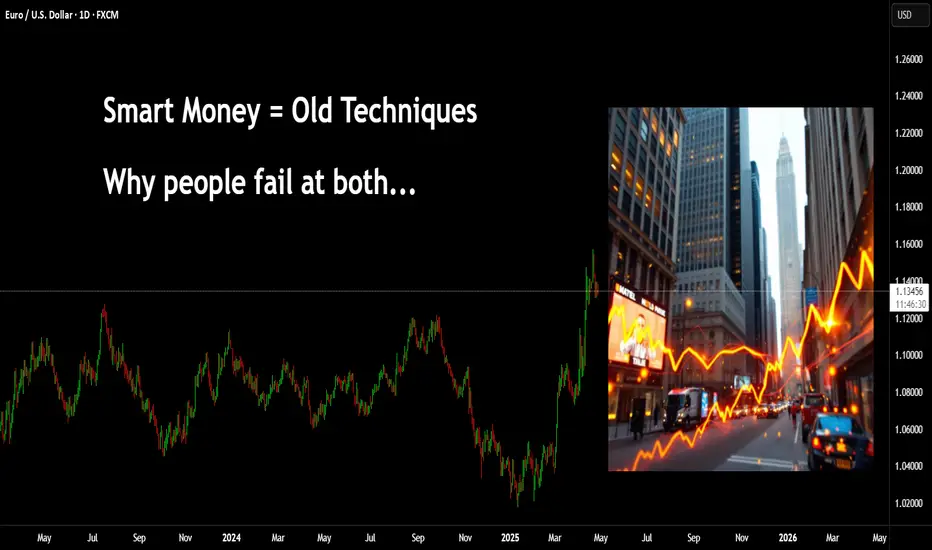
Why does it always go against you? You might be new to trading, you may have several years of experience. But, where a lot of people still seem to go wrong is in not realising the relationships.
I have posted hundreds of educational posts here on Tradingview from cartoons, trying to simplify techniques through to market relationships between technical systems such as Elliott Wave and Wyckoff.
Many new traders fall foul of social media posts covering "SMC - Smart Money Concepts" and are not seasoned enough to appreciate what or why these can work for some and not for others.
You have Elliott Wave traders, there is a saying along the lines of "if you put 10 Elliott traders in a room searching for a wave count you will come out with 11 different answers"
This isn't to say Elliott doesn't work, nor Smart Money.
The market seeks liquidity, it forms seemingly complex patterns that humans try to make sense of. We are great at that, seeing patterns even if they are not there. - Look, there's an upside-down butterfly 1.618 extension!
First, you need to appreciate Elliott Wave counts on smaller timeframe are pointless, especially in the age of algo's and bots. However, sentiment on the larger timeframes can't really be spoofed.
In this first image; you can see a market wave that is straight out of a textbook.
Let's also add some Wyckoff; if you were to visualise this - Wyckoff schematics would be visible on smaller timeframes, the Green boxes represent accumulation and the Red show distribution.
Let's overlay and Elliott Wave count -
Take that to the next level, this count is only part of a higher fractal count.
How does this fit into smart money concepts? well, it's more like - How does Smart Money fit into this?
Elliott waves and Wyckoff have been around for over 100 years. Many of the techniques shown on YT video's today can be traced back to these older concepts.
Now, if you can see how a 1-2 EW count pushes up for a 3. You can zoom in again and start to see what to expect when trading using SMC.
In this image you can see a drop, then a gap as price pushes back up (I haven't bothered drawing wicks for simplicity assume their inside the box)
Many traders would now anticipate a move that looks something like this.
Only to see price do this
Yeah - you're not the only one!
The next issue is where and how Supply and Demand is drawn.
Ok, the gap didn't hold, it must be the demand level there. GO AGAIN!!!
How did that play out? Trade 1, Trade 2 =
What about now?
Price holds the support
This time you are afraid to go in. Then one of two things happens.
1)
Or
2)
In the first image, we can see a sweep of prior liquidity and that creates momentum for a move up. In the second image, price simply melts away.
This is an easy fix. It all comes down to understanding what the charts are trying to tell you.
People love to talk about how "Smart Money" is the banks and institutional players - how they are playing against you on every click of the button.
The truth is, most people don't understand the market.
When larger players enter the market, the can leave a pretty obvious footprint. In addition to that - they leave behind orders they had but were unable to fill. These orders they will be defended with even more buying or selling (if they need to), and this is the premise for a rally and pullback or a drop to pullback.
Now, visualise a 1-2 Elliott Wave move. Why do you think 2 often comes back so deep?
What would you expect the move from 2-3 to do?
Powerful push, yes?
In this image, the move that created demand is simply the opposing colour candle before the power play. The significant move pushed up (showing institutional involvement). Hence, a location they will likely defend.
In addition to the push up, they pushed with so much money - it created a natural gap.
This type of example doesn't always have to be a power play 1-5 up, it could be visualised on pullback moves too.
Here's a great example recently on Euro.
The demand candle 'buy before the sell" is clearly targeted on the way up. Price fails to close above it, drops, goes back to retest - sweeps and drops. If you were to zoom in you will see on smaller timeframes evidence of a Wyckoff schematic with a UTAD.
Add a volume profile there.
As the price breaks above, after it's pullback you can see an acceleration in price and of course the area has the PoC.
Back to where people go wrong.
They will see this GAP created and assume price will come back here to reject and go. However, look closer and the demand that started the move is very near that gap.
Where is the juicy liquidity? PoC is another little clue.
Let's take this to another level.
In this image I have a range, using the prior high just to give the example in this post.
We are in an uptrend = we just broke the high, we expect a Pullback. Where would that likely target?
Zoom in again. This time I have added a fixed range volume tool.
What do you know?!
Anyways, once you get a handle on the bigger picture and understand the relationships, you can zoom into any timeframe you like - the game is always the same.
Have a great week all!
Disclaimer
This idea does not constitute as financial advice. It is for educational purposes only, our principal trader has over 25 years' experience in stocks, ETF's, and Forex. Hence each trade setup might have different hold times, entry or exit conditions, and will vary from the post/idea shared here. You can use the information from this post to make your own trading plan for the instrument discussed. Trading carries a risk; a high percentage of retail traders lose money. Please keep this in mind when entering any trade. Stay safe.
Potential Decline of Natural Gas Prices to $2.43–$2.74Brief Overview of Events and News Explaining the Potential Decline of Natural Gas Prices to $2.43–$2.74.
➖ Weather Forecast and Reduced Demand
On April 23, 2025, the U.S. National Weather Service forecasted milder-than-average weather across the U.S. for late spring and early summer 2025, particularly in key gas-consuming regions like the Northeast and Midwest.
Warmer weather reduces the demand for heating, a primary driver of natural gas consumption. This led to a 2.5% decline in Henry Hub natural gas futures, settling at $3.05 per MMBtu on April 24, 2025.
Source: Reuters
➖ High U.S. Natural Gas Inventories
The U.S. Energy Information Administration (EIA) reported on April 17, 2025, that natural gas inventories increased by 75 billion cubic feet (Bcf) for the week ending April 11, 2025, significantly exceeding the five-year average build of 50 Bcf. Total U.S. inventories are now 20% above the five-year average, indicating an oversupply that pressures prices downward.
Source: EIA, "Weekly Natural Gas Storage Report," April 17, 2025
➖ Weak Global LNG Demand
On April 22, 2025, Bloomberg reported a decline in demand for liquefied natural gas (LNG) in Asia, particularly in China, due to an economic slowdown and a shift to cheaper coal alternatives. China’s LNG imports in Q1 2025 dropped 10% year-over-year, reducing export opportunities for U.S. gas producers and adding pressure on domestic prices.
Source: Bloomberg, "China’s LNG Imports Fall as Coal Use Rises," April 22, 2025
Technical Analysis
Natural gas futures (NYMEX) are currently around $3.15 per MMBtu as of April 28, 2025, following a recent decline from a peak of approximately $4.90 in 2025.
Fibonacci retracement levels indicate correction targets at 38.2% ($2.74) and 50% ($2.43).
Fundamental factors, such as oversupply and reduced demand, support a bearish scenario that could drive prices to these levels in the near term.
Nearest Entry Point Target:
• $2.74
Growth Potential:
Long-term:
• $10
Screenshot:

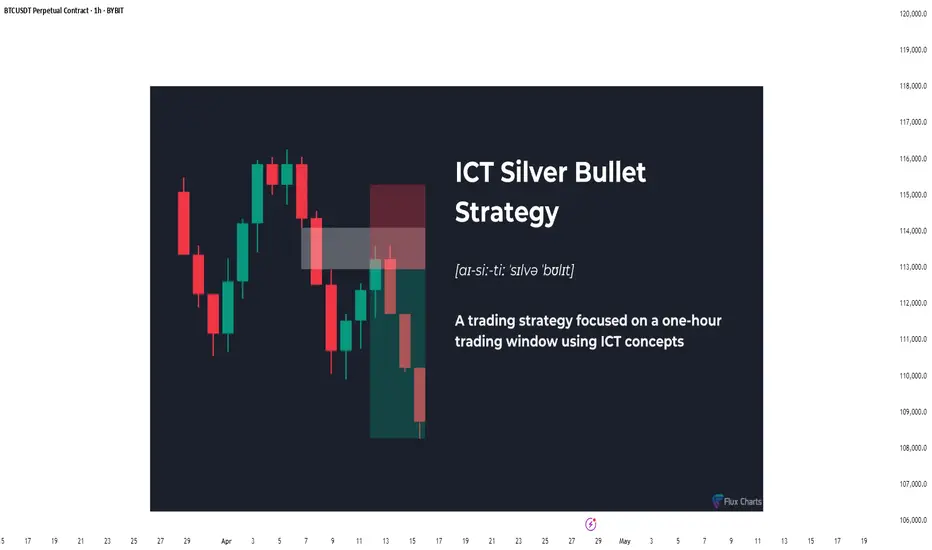
The Hidden Power of the Silver Bullet Strategy - Full GuideIntroduction
The Silver Bullet Strategy is a high-probability intraday trading technique popularized within the Smart Money Concepts community. It focuses on taking precision trades during specific times of the day when liquidity is most active. Mastering this strategy can help traders consistently capture high-quality setups with minimal risk.
In this guide, we will cover:
- What the Silver Bullet Strategy is
- Key Times to Watch
- Entry Models
- Target Setting
- Risk Management
- Real Chart Examples
---
What is the Silver Bullet Strategy?
The Silver Bullet Strategy is based on trading within a "window" of high-probability price action, typically during key liquidity times. It looks to capture moves after liquidity sweeps, order block mitigations, and Fair Value Gap (FVG) plays.
Key Principles:
- Focuses on high-probability windows (New York session especially)
- Waits for a liquidity grab and displacement
- Entries are often on FVGs, OBs, or MSS points
---
Silver Bullet Timing Windows
Timing is crucial to this strategy. The "Silver Bullet" typically occurs in these windows (New York time):
- First Window: 10:00 AM - 11:00 AM (New York)
- Second Window: 2:00 PM - 3:00 PM (New York)
These times capture major moves post-liquidity sweeps or reversals after news/market manipulation.
---
Silver Bullet Entry Model
The classic sequence for a Silver Bullet setup:
1. Identify Liquidity Sweep: Look for price to grab liquidity above a swing high or below a swing low.
2. Look for Displacement: A strong move away from the sweep, creating a Fair Value Gap (FVG) or Breaker Block.
3. Entry in FVG or OB: Enter on a retracement into the FVG or Order Block after displacement.
4. Confirmation: Use lower timeframe MSS or BOS to confirm the reversal.
Liquidity sweep and FVG at the 5m:
MSS + Displacement candle at the 1m:
So all 4 steps completed!
Example Entry Checklist:
- Liquidity sweep
- Strong displacement creating an FVG
- Price retraces into FVG or OB
- MSS/BOS confirmation
- Execute trade with tight stop-loss
---
Where to Set Targets
Targets should be logical based on market structure:
- First Target: Recent internal liquidity (equal highs/lows)
- Second Target: External liquidity zones (major swing highs/lows)
- Optional: Use 1R/2R/3R scaling based on risk-to-reward goals
---
Risk Management for Silver Bullet Trades
Golden Rules:
- Risk less than 1% per Silver Bullet setup
- Set stop-loss beyond the liquidity sweep (not too tight, not too loose) or above FVG
candle
- Stick to one or two trades per window maximum
- Avoid revenge trading outside the windows
---
Common Mistakes to Avoid
- Trading outside the specified time windows
- Entering without a confirmed sweep and displacement
- Overleveraging because the strategy "looks easy"
- Ignoring higher timeframe bias (HTF context is still critical!)
Pro Tip: Combine Silver Bullet entries with SMT Divergences, MSS, and IFVGs for maximum confluence.
---
Final Thoughts
The Silver Bullet Strategy is one of the cleanest ways to approach intraday trading. By mastering liquidity concepts, timing, and precision entries, traders can catch powerful moves with strong risk-to-reward setups.
Be patient, wait for your window, and always trade with discipline.
Happy Sniping!
Is this still the ‘Top Trade’ of 2025? (WTI crude oil)It’s not a big secret actually- I’m talking about crude oil!
In the final week of 2024, the team and I highlighted two versions of the WTI crude oil weekly chart and asked ‘is this the top trade of 2024?’
Version 1 has already happened, WTI crude hit $55 per barrel, the downside objective of the smaller triangle pattern on the chart.
Version 2 showed a much larger triangle pattern (which we show again this week) and had a downside target of nearly $30! It would take a lot of conviction to ride the price that far down, but could crude oil still move a lot lower this year?
What’s interesting is that this is still one of the ‘less talked about’ situations in the market today because of the huge volatility seen in both stocks, forex and fixed income.
And I like that nobody’st talking about it - because you don’t want everyone in on it - that means the move could already be over.
Crude oil hit a five-year low. That’s meaningful.
Strong markets don’t hit 5-year lows, weak markets do. And we like to sell weak markets.
Of course, ‘oversold markets’ hit 5-year lows too - and that largely explains the ‘bottom feeders’ who bought WTI crude oil at $55.
Downside volatility got extreme owing to Trump’s tariffs and mean-reversion helped it rebound on news of the 90-day pause, much like stock markets.
I am completely open to the idea that $55 is a multi-year low and essentially marked the bottom. The huge Hammer reversal candlestick pattern adds weight to that idea.
But with the price having hit $65 last week, buying the lows is yesterday’s trade. What do we do today?
We will be looking to do what we said in Week 53 of 2024 in case crude oil turns out to be the ‘top trade of 2025’ as we imagined.
By the way, Brent crude oil has a very similar setup so this is not a ‘US oil’ thing.
There are two parts to trading ‘planning the trade, and trading the plan’.
There isn’t much use in making a plan, and not taking the trade.
There are always reasons not to take a trade- but if it’s a ‘good trade’ that fits the rules of your trading strategy, then those reasons are usually just ‘noise’.
WTI Crude (USO/USD)
Long term chart (weekly)
Trend: Down
Phase: Re-test of breakdown
Resistance = $70
Support = $55
Price action: Price has broken down, rebounded and is now testing the breakdown level, while under the 30-week moving average. Should the price break back over the broken long term rising trendline then we know the idea, or at least the timing on the idea is not right.
View: Bearish while under broken up-sloping long term support

BTCUSD MARKET MOVEMENT BTCUSD current price. 94448
Support 1 .. 91231
Support 2.. 88681
Target 1.. 96000
Target 2... 99534
Youare likely looking for a move up towards 99534, with 91231 and 88681 acting as your SUPPORT ZONES in case of a pullback.
QUICK VIEW ;
. Price is closer to your target than the support.
.As long as BTCUSD holds above 91231, your bullish target stays valid.
.If it drops below 88681, youy might want to re_evaluate the trade.

XAUUSD MARKET BULLISH TREND Xauusd market currently on 3290 ACCORDING TIME FRAME H4 and also my analysis market is BULLISH trend my key point is 3320 if market reach on key point then my target is 3373
KEY POINT .. 3320
TARGET 1 .. 3325
TARGET 2.. 3373
SUPPORT LEVEL 3258
KEEP SUPPORT MY ANALYSIS

Actionable Gold insights: 28-APRIL-2025Rise and shine, traders! Start your day with actionable Gold insights. Let's grow your skills together, one chart at a time.

GOLD | Price close to 4H downward trendline.Gold came close to 4H downward trendline.
Recommendation:
Sell Gold till resistance level.
Stop loss: when 5M candle closes above trendline.

Heading into 61.8% Fibonacci resistance?WTI Oil (XTI/USD) is risng towards the pivot which has been identified as a pullback resistance and could reverse to the 1st suport which acts as a pullback support.
Pivot: 65.64
1st Support: 57.71
1st Resistance: 71.18
Risk Warning:
Trading Forex and CFDs carries a high level of risk to your capital and you should only trade with money you can afford to lose. Trading Forex and CFDs may not be suitable for all investors, so please ensure that you fully understand the risks involved and seek independent advice if necessary.
Disclaimer:
The above opinions given constitute general market commentary, and do not constitute the opinion or advice of IC Markets or any form of personal or investment advice.
Any opinions, news, research, analyses, prices, other information, or links to third-party sites contained on this website are provided on an "as-is" basis, are intended only to be informative, is not an advice nor a recommendation, nor research, or a record of our trading prices, or an offer of, or solicitation for a transaction in any financial instrument and thus should not be treated as such. The information provided does not involve any specific investment objectives, financial situation and needs of any specific person who may receive it. Please be aware, that past performance is not a reliable indicator of future performance and/or results. Past Performance or Forward-looking scenarios based upon the reasonable beliefs of the third-party provider are not a guarantee of future performance. Actual results may differ materially from those anticipated in forward-looking or past performance statements. IC Markets makes no representation or warranty and assumes no liability as to the accuracy or completeness of the information provided, nor any loss arising from any investment based on a recommendation, forecast or any information supplied by any third-party.

GOLD / XAUUSD | 15M | PENDING SELL ORDERHey there my dear friends;
SIGNAL ALERT
PENDING SELL ORDER - GOLD / XAUUSD > 3334,0
🟢TP1: 3328,0
🟢TP2: 3314,0
🟢TP3: 3296,0
🔴SL:3358,0
RR / 1,70
Dear friends, your likes are always my biggest source of motivation for me to share analysis. For this reason, I would like to ask each and every one of my followers; please do not miss your likes.
I sincerely thank everyone who supports me with their likes.

XAUUSD Downtrend Continues- Is 3,175 the Next Stop?OANDA:XAUUSD is currently trading within a well-defined descending channel, with price action consistently forming lower highs and lower lows. This structure reflects sustained bearish momentum, and sellers continue to dominate the overall direction.
The recent upward move appears to be a technical rebound, with price approaching a potential resistance zone near the upper boundary of the channel. This area may now serve as a supply zone after acting as previous support, making it an important region for potential rejection.
If the resistance holds, a rejection here could lead to the continuation of the bearish trend, with a potential move targeting the support area around 3,175, aligning with the lower boundary of the descending channel.
However, failure to hold below this level could invalidate the bearish scenario and increase the likelihood of a retest toward the upper boundary of the channel.
Traders should monitor for clear rejection signals at resistance, such as bearish engulfing candles or strong rejection wicks, or alternatively, wait for breakout confirmation before considering a trend shift. As always, proper risk management remains essential.

Gold price plummets, short-term analysisLast Friday, driven by hopes of easing global trade tensions, the US dollar index rose, eventually closing up 0.325% at 99.61, ending a four-week losing streak. US Treasury yields continued to fall, with the benchmark 10-year Treasury yield closing at 4.24%; the two-year Treasury yield, which is more sensitive to monetary policy, closed at 3.744%.
Given the cooling of risk aversion and the strength of the US dollar, spot gold fell, hitting a low of 3365.2, and finally closed down 0.9% at 3318.2, marking the first weekly decline since the announcement of the reciprocal tariffs.
Gold did not break through the high of $3370 last Friday, and the trend of falling was triggered! Gold started to fall in the Asian and European sessions, and fell further in the US session to a low of $3265, a single-day drop of more than $100! Very powerful market trend, gold rebounded at the end of the trading day and finally closed at $3317. The weekly line closed with a shooting star with a very long upper shadow line. After such a pattern, gold has the need to continue to correct. At the beginning of the week, gold rebounded and continued to short. Today, gold focuses on the upper resistance at $3352. Rebound and continue to short below this resistance. Look at the $3320 and $3300 levels below. If it falls below, look at the $3270 level!
Overall, today's short-term operation strategy for gold is mainly based on rebounding high altitudes. The upper short-term focus is on the 3370-3380 resistance line, and the lower short-term focus is on the 3330-3320 support line.
Buy range: 3260-3258, SL: 3248, TP: 3280-3290
Sell range: 3310-3312, SL: 3322, TP: 3280-3270
First support: 3260, second support: 3250, third support: 3240
First resistance: 3310, second resistance: 3320, third resistance: 3330

Gold maintains bullish mindsetThere is a fierce game between bulls and bears in gold prices, but we remain bullish in the long term. The intraday layout follows the general trend and focuses on the gains and losses of the 3260 support below. As long as it remains above 3260, we will maintain our bullish outlook and wait for the gold price to fall slightly to around 3275 before we can intervene and go long in batches!
Gold is long near 3275, stop loss 3260, target 3300
XAUUSD H4 | Bullish Bounce OffBased on the H4 chart analysis, the price is falling toward our buy entry level at 3245.68, a pullback support.
Our take profit is set at 3314, an overlap resistance
The stop loss is placed at 3212.68, a swing low support.
High Risk Investment Warning
Trading Forex/CFDs on margin carries a high level of risk and may not be suitable for all investors. Leverage can work against you.
Stratos Markets Limited (tradu.com):
CFDs are complex instruments and come with a high risk of losing money rapidly due to leverage. 63% of retail investor accounts lose money when trading CFDs with this provider. You should consider whether you understand how CFDs work and whether you can afford to take the high risk of losing your money.
Stratos Europe Ltd (tradu.com):
CFDs are complex instruments and come with a high risk of losing money rapidly due to leverage. 63% of retail investor accounts lose money when trading CFDs with this provider. You should consider whether you understand how CFDs work and whether you can afford to take the high risk of losing your money.
Stratos Global LLC (tradu.com):
Losses can exceed deposits.
Please be advised that the information presented on TradingView is provided to Tradu (‘Company’, ‘we’) by a third-party provider (‘TFA Global Pte Ltd’). Please be reminded that you are solely responsible for the trading decisions on your account. There is a very high degree of risk involved in trading. Any information and/or content is intended entirely for research, educational and informational purposes only and does not constitute investment or consultation advice or investment strategy. The information is not tailored to the investment needs of any specific person and therefore does not involve a consideration of any of the investment objectives, financial situation or needs of any viewer that may receive it. Kindly also note that past performance is not a reliable indicator of future results. Actual results may differ materially from those anticipated in forward-looking or past performance statements. We assume no liability as to the accuracy or completeness of any of the information and/or content provided herein and the Company cannot be held responsible for any omission, mistake nor for any loss or damage including without limitation to any loss of profit which may arise from reliance on any information supplied by TFA Global Pte Ltd.
The speaker(s) is neither an employee, agent nor representative of Tradu and is therefore acting independently. The opinions given are their own, constitute general market commentary, and do not constitute the opinion or advice of Tradu or any form of personal or investment advice. Tradu neither endorses nor guarantees offerings of third-party speakers, nor is Tradu responsible for the content, veracity or opinions of third-party speakers, presenters or participants.

$SPX Sell in May, Go Away, $5k, Dead Cat to $5.3k, $4.8k by EOMAlrighty. My forecast is as follows. I made a video explaining just a quick thought and here's the video in a written version for the most part. Basically, I'm a pattern chart trader and I spend the majority of my days looking for specific candlestick patterns that match candle for candle. I cannot find anything remotely close to today's Price Action besides October 2001. I have been and will continue to be doubted and that's okay. I am not here for anyone except myself and anyone that wants to gain a fresh unbiased perspective. People have called me a Permabear but that only pertains to my personality, which is that of a realist. I do not believe investing for the next 20-50 Years will work for everyone. You'd have to do it well and continuously contribute even during the down days. Either way. This is the analog I will be following. Fib is Extended way beyond Blow Off Top measurements imo. The market gained 50% in One Year and Three Months. I'd like to think that the uncertainty being priced in will cause these Deeper Fib Retracements. We already crashed down to the 1.61 GOLDEN POCKET from above and now bounce back to Secon Golden Pocket at 2.61. Based on the past behavior, now we move back to 2.0 for a move to the original extension of the 1.00 Fib. If we lose this, we start moving back to the 1.27 near $4.74k on SPX where I will then be looking for one final dead cat to $5300 by mid August, Every July dip being grabbed up ... Final Sell in August for an End of Year Crash to Mark 2025 as one of the worst years ever in Life as far as the Market goes. Good Luck everyone. Tips always welcome.

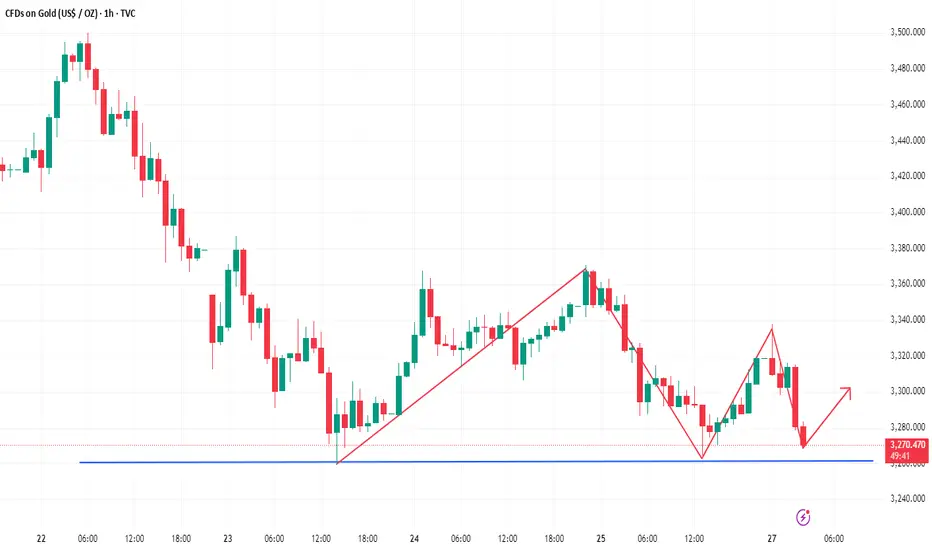
28 Apr - XABCD Pattern Signals Potential UpsideRecently, the expected Head and Shoulders pattern seems to be delayed — and possibly invalidated — as buyers successfully defended the line at $3,287, pushing the price up to $3,319 on Friday. As a result, a new bullish setup has emerged.
On the 1-hour chart, an XABCD harmonic pattern has clearly formed, offering two upside targets:
Target 1: $3,367
Target 2: $3,435
On the downside, $3,260 is now acting as the critical level. A break below this point could open the door for lower prices.
For now, the bias is long until Target 1 at $3,367 is reached. Traders should monitor short-term sentiment closely: if signs of weakness or a shift appear, the price could reverse earlier.
Important to note: the Head and Shoulders pattern remains a risk if price falls below $3,260 after reaching $3,370 and moves toward the neckline at $3,237.
📍 Summary:
Idea: Go long toward $3,367.
Risk: Head and Shoulders pattern could still complete if bearish momentum returns.
Stay sharp and manage your risk accordingly!
-------------------------------------------------------------------------
This is just my personal market idea and not financial advice! 📢 Trading gold and other financial instruments carries risks – only invest what you can afford to lose. Always do your own analysis, use solid risk management, and trade responsibly.
Good luck and safe trading! 🚀📊

Weekly Market Forecast: Buy Stocks! Sell Oil! Buy Gold!In this video, we will analyze the S&P 500, NASDAQ, DOW JONES, Oil, Gold and Silver futures, for the week of April 28 - May 2nd.
Markets are looking tradeable again.
The indices look bullish, creating +FVGs as they move higher.
Oil has corrected a bearish impulse, so it could be poised to move lower from the Daily and Weekly -FVG.
Gold took a breather last week and could move higher from the Weekly +FVG it just created.
Let's go!
Enjoy!
May profits be upon you.
Leave any questions or comments in the comment section.
I appreciate any feedback from my viewers!
Like and/or subscribe if you want more accurate analysis.
Thank you so much!
Disclaimer:
I do not provide personal investment advice and I am not a qualified licensed investment advisor.
All information found here, including any ideas, opinions, views, predictions, forecasts, commentaries, suggestions, expressed or implied herein, are for informational, entertainment or educational purposes only and should not be construed as personal investment advice. While the information provided is believed to be accurate, it may include errors or inaccuracies.
I will not and cannot be held liable for any actions you take as a result of anything you read here.
Conduct your own due diligence, or consult a licensed financial advisor or broker before making any and all investment decisions. Any investments, trades, speculations, or decisions made on the basis of any information found on this channel, expressed or implied herein, are committed at your own risk, financial or otherwise.

The relationship between gold, copper and the US10YFirst, can you tell me what you think the relationship between these two curves is? Clearly, these two curves have a strong negative correlation, meaning they move exactly opposite to each other. You can see in the image that their behavior is like a mirror image (from 2007 to before 2022).
You are familiar with the gold-to-copper ratio, right? Now, when this gold-to-copper ratio curve rises, it means that gold is giving better returns compared to copper. This indicates that the global economy is moving away from growth and heading toward a recession. Investors, instead of investing in production (where copper symbolizes production), choose to invest in a safe haven like gold. The opposite happens when this curve goes down.
The lower curve represents the yield on long-term U.S. bonds. When this curve is rising, it means that the supply of bonds is greater than the demand. People are selling bonds, which causes the bond yield to rise. When the curve is falling, it means people are buying bonds, which causes the bond yield to drop.
Why do these two curves move in opposite directions?
Now, let’s get to the main question. The answer to this question is simple: bonds, like gold, serve as a safe haven for investors. When the economy moves toward a recession (when gold offers better returns than copper, and the gold-to-copper ratio is rising), some investors shift towards bonds, and the yield curve drops. That’s why these two curves move in opposite directions.
To summarize the entire story: Movement toward recession = investors moving toward gold and bonds = rise in the gold-to-copper ratio and drop in bond yield curve.
Now it’s clear why these two curves move opposite to each other. The big surprise is coming👇
Since the beginning of 2022, the historical trend has changed. These two curves have started to show a positive correlation! Meaning, everything I mentioned above has gone out the window! Now, the question is: What suddenly happened? There are several analyses, but I believe what changed is that U.S. bonds are no longer a safe haven for investors, as they once were (the same fear signal I mentioned earlier). In fact, after the pandemic, the world has never been the same. This is an important development and it affects many things. I’ve addressed this topic from various perspectives before, and here’s a new angle on it.
For the past two to three years, contrary to the historical trend, investors have been buying gold but selling bonds, and these two curves have been rising together.
As you can see, the analytical situation has changed drastically compared to, say, 10 years ago, and many fundamental facts have shifted. For instance, many people expect the Federal Reserve to lower interest rates and gold to go up again, but after an initial short shock, the story will probably reverse.
#Gold #XAUUSD #HG1!

Potential bullish rise?XAG/USD is reacting off the support level which is an overlap support and could rise from this level to our take profit.
Entry: 33.02
Why we like it:
There is an overlap support level.
Stop loss: 32.21
Why we like it:
There is a pullback support level that is slightly below the 23.6% Fibonacci retracement.
Take profit: 34.51
Why we like it:
There is a swing high resistance.
Enjoying your TradingView experience? Review us!
Please be advised that the information presented on TradingView is provided to Vantage (‘Vantage Global Limited’, ‘we’) by a third-party provider (‘Everest Fortune Group’). Please be reminded that you are solely responsible for the trading decisions on your account. There is a very high degree of risk involved in trading. Any information and/or content is intended entirely for research, educational and informational purposes only and does not constitute investment or consultation advice or investment strategy. The information is not tailored to the investment needs of any specific person and therefore does not involve a consideration of any of the investment objectives, financial situation or needs of any viewer that may receive it. Kindly also note that past performance is not a reliable indicator of future results. Actual results may differ materially from those anticipated in forward-looking or past performance statements. We assume no liability as to the accuracy or completeness of any of the information and/or content provided herein and the Company cannot be held responsible for any omission, mistake nor for any loss or damage including without limitation to any loss of profit which may arise from reliance on any information supplied by Everest Fortune Group.

Bullish on USOILAs the chart shows, in the 1 - hour timeframe, USOIL is in an upward - trending channel 📈. The price fluctuates upwards between two trendlines. Despite pullbacks, the uptrend persists, suggesting short - term bullish dominance. Still, the frequent swings reveal ongoing bull - bear market battles.📈
⚡⚡⚡ USOIL ⚡⚡⚡
🚀 Buy@61.5 - 62.0
🚀 TP 63.5 - 65.0
Accurate signals are updated every day 📈 If you encounter any problems during trading, these signals can serve as your reliable guide 🧭 Feel free to refer to them! I sincerely hope they'll be of great help to you 🌟

SILVER Local Long! Buy!
Hello,Traders!
SILVER is trading in a local
Uptrend and the price made
A retest of the horizontal
Support level around 32.83$
From where we will be
Expecting a rebound and
A move up on Monday
Buy!
Comment and subscribe to help us grow!
Check out other forecasts below too!
Disclosure: I am part of Trade Nation's Influencer program and receive a monthly fee for using their TradingView charts in my analysis.

GOLD WEEKLY - Key Events to Watch: ADP, Core PCE, Non-Farm📌 Weekly Gold Outlook – Key Events to Watch: ADP, Core PCE, Non-Farm Payrolls 📉📈
🌍 Fundamental Overview
Last week, gold faced heavy selling pressure after failing to sustain its rally above the $3,450 level. Easing concerns over the US–China trade tensions and a stronger US Dollar — supported by stronger-than-expected Durable Goods Orders — triggered a sharp correction in Price.
The US Federal Reserve (Fed) continues to adopt a cautious stance, awaiting clearer economic data before adjusting its monetary policy. Meanwhile, recent figures from both the US and China show signs of economic resilience, reducing safe-haven demand for gold in the short term.
Key Events This Week:
ADP Non-Farm Employment Change
Core PCE Price Index m/m
Non-Farm Payrolls (NFP)
Volatility is expected to rise sharply as these major economic indicators are released.
📊 Technical Analysis – XAU/USD 2H Chart
Gold is currently undergoing a corrective phase after its strong rally earlier this month. Price is forming a descending channel and consolidating around critical support and resistance zones.
Immediate Resistance: 3,325 – 3,377
Immediate Support: 3,275 – 3,235
As long as Price remains capped below 3,325, the bearish bias will remain dominant.
🧩 Main Scenarios for This Week
Short-Term Rebound:
Price may retest the 3,275–3,277 area before sellers regain control.
Medium-Term Bearish Pressure:
If Price fails to reclaim the 3,325 resistance zone, it could break lower toward 3,235, 3,197, and potentially deeper into the 3,108 or 3,066 liquidity zones.
Bullish Reversal Scenario:
A sustained breakout and close above 3,377 would invalidate the bearish outlook and suggest a move toward the 3,420 target.
🔍 Key Price Zones for This Week
Resistance: 3,325 → 3,377 → 3,420
Support: 3,275 → 3,235 → 3,197 → 3,108 → 3,066
🧠 Suggested Trading Strategy
Prefer short positions when Price retraces toward the 3,275 – 3,325 resistance zone, aiming for downside targets at 3,235 and 3,197.
Be cautious with long positions: only consider buying if Price drops deeply into 3,108 or 3,066 and shows strong support reaction.
⚡ Note:
Given the upcoming releases of ADP, Core PCE, and Non-Farm Payrolls, the market is expected to experience significant volatility.
Stay disciplined and await detailed intra-week updates around key event times.
