GOLD Free Signal! Sell!
Hello,Traders!
GOLD went up from the
Support just as I predicted
But is now retesting a local
Horizontal resistance structure
So we can go short with the
Take Profit of 3320$ and
The Stop Loss of 3374$
Using small lot size is
Highly recommended
As it is a risky setup
Sell!
Comment and subscribe to help us grow!
Check out other forecasts below too!
Disclosure: I am part of Trade Nation's Influencer program and receive a monthly fee for using their TradingView charts in my analysis.
Commodities

SILVER WILL GROW|LONG|
✅SILVER made a retest of
The horizontal support area
Around 32.75$ while trading
In an uptrend and we are now
Seeing a bullish rebound
Which reinforces our bullish
Biased and we will be expecting
A further bullish move up
LONG🚀
✅Like and subscribe to never miss a new idea!✅
Disclosure: I am part of Trade Nation's Influencer program and receive a monthly fee for using their TradingView charts in my analysis.

No Guessing. No Praying. Just Precision — Smart Money Moves Only📆 XAUUSD Daily Plan – April 29, 2025
🔥 Macro & Market Context:
Gold continues its tactical chess game between premium supply traps and reactive support zones.
Price is currently hovering around 3342, teasing a breakout or another trap inside the 3340–3355 resistance block.
Tomorrow we also have important USD news: 🔵 CB Consumer Confidence
🔵 JOLTS Job Openings
Expect potential volatility during NY session — stay adaptive, not predictive.
🎯 Bias Overview:
HTF Bias (H4–Daily): Bullish (Higher Highs and Higher Lows structure still intact)
LTF Flow (M15–H1): Corrective bullish retrace inside HTF uptrend
📍 Key Levels to Watch:
🔺 Resistance Zones:
3340–3355 → Minor Premium Resistance (currently being tested)
3372–3376 → Strong Trap Sell Zone (next immediate target above)
3380–3390 → Major Liquidity Pool (big decision area if price pumps further)
🔻 Support Zones:
3284–3288 → Intraday Demand + Bounce Zone
3233–3237 → HTF Major Reversal Demand
🎯 Refined Sniper Zones:
🟩 Buy Zone #1: 3284–3288
(H1 demand cluster + previous clean reaction)
🟩 Buy Zone #2: 3233–3237
(Deep HTF OB + untapped liquidity anchor)
🟥 Sell Zone #1: 3372–3376
(M15–H1 OB + liquidity trap setup)
🟥 Sell Zone #2: 3380–3390
(Premium supply and major liquidity sweep)
👀 Eyes On:
Reaction at 3372–3390: Weak rejections = tactical sell opportunities.
Respect for 3284–3288: Bullish continuation if defended strongly.
Violation below 3230: HTF momentum shift possible toward deeper discount.
📢 Final Message:
Gold’s setting traps for both bulls and bears — but we’re hunting precision, not chaos. 🏹
Patience = Power.
Confirmation = Survival.
🔥 Trading Focus Tip:
"First wicks grab liquidity. First breakouts fool emotions.
We wait for the second reaction — that's where the sniper eats."
If this map helps you stay focused, smash that ❤️ and follow, drop your thoughts below, and let's trade the smart flow together! 🚀✨

XAUUSD Weekly-Daily-H4 Outlook – April 28, 2025"Gold’s Game: Range Trap... or Breakout Incoming?" 👀⚡
🔥 Macro + Micro Context:
Macroflow: No major macro catalysts today — market sentiment driven mostly by technicals, liquidity behavior, and late-week reactions.
Bias:
HTF (D1–W1): Still bullish-biased long-term, unless 3220–3235 breaks cleanly.
LTF (H4–M30): Currently trapped in a wide distribution range 3380–3260, showing signs of both liquidity sweeps and engineered traps.
Liquidity Dynamics:
Both upside and downside liquidity have been targeted multiple times. Equal highs/lows patterns forming, suggesting fakeouts are highly probable before any real move.
📈 STRUCTURAL RANGE:
🔵 Main Range:
• Top: 3380–3395 → major flip zone (premium side)
• Bottom: 3260–3280 → major demand zone (discount side)
📚 Inside the range:
• Liquidity is being farmed on both sides — expect fake spikes, stop hunts, and whipsaw moves before breakout.
🔑 H4 Key Zones (Above Current Price):
Level Type Notes
3380–3395 Major Supply + Flip Zone HTF orderblock + FVG + previous sell trap
3410–3415 Minor Supply Zone M30–H1 imbalance + small FVG
3448–3455 Major Premium Supply HTF OB + FIBO 1.618 extension + historical premium trap
3490–3500 ATH Area Strong psychological level + institutional interest
🔑 H4 Key Zones (Below Current Price):
Level Type Notes
3260–3280 Major Discount Demand Strong H1-H4 unmitigated OB + liquidity grab zone
3220–3235 HTF Reversal Demand Last HTF pivot for bullish bias
📊 Expected Scenarios:
Bullish Path:
Hold 3260–3280 → Break 3380–3395 → Target 3415 → Then 3450–3500 range sweep.
Bearish Path:
Fail at 3380–3395 → Sharp rejections back into 3280 → Potential crash toward 3235 and 3210.
👀 EYES ON:
Watch the 3380–3395 flip zone closely.
If price fails there with heavy wicks and low volume, bulls are trapped again.
If price holds above 3395–3415 cleanly, bulls regain control for 3450+.
🧠 FINAL MESSAGE:
"The best traders don’t predict. They prepare."
"Trap or breakout — it’s all about reaction, not prediction. Stay sharp, stay liquid, and don’t chase the donkey moves."
🔔 Follow for real-time smart updates
💬 Comment your bias below: bull 🐂 or bear 🐻? Let’s grow the community together!
#Gold #XAUUSD #TradingView #SmartMoney #RangeTrap #GoldOutlook

XAUUSD – Daily Outlook (April 28, 2025)Gold continues to trade near all-time highs after last week’s explosive rally. However, the most recent Daily candle shows a clear long-wick rejection into the premium supply zone (around 3350–3430), suggesting that smart money may be defending this level.
✅ Structure remains bullish on higher timeframes.
✅ Momentum slowed slightly after touching the upper extreme.
✅ Price is still holding above the previous daily range breakout.
At the same time:
⚠️ Buyers are showing signs of exhaustion after tapping into the premium supply zone.
⚠️ Volume on the last bullish candle was lower compared to the recent bearish reaction.
⚠️ The last daily wick indicates possible trapped buyers at the highs.
Key Levels to Watch:
Resistance Zone: 3350–3430 (premium supply rejection)
Support Zone: 3280–3300 (former breakout zone)
Deeper Support: 3120–3160 (mid-range liquidity pocket)
What’s Next?
As long as Gold stays above 3280, the broader bullish bias remains intact.
However, a clean daily close below 3280 could trigger deeper retracements into 3240 or even 3160 zones before bulls regain strength.
Patience is key here: let price tell its story between the premium rejection and the former breakout zone.
🔔 Final Thought:
Gold is not in a rush. Neither should you be. Stay sharp, stay patient — the best setups often appear when most traders lose their discipline.
Follow for more clean updates, sniper entries, and smart market flow insights. Let’s grow together! 🚀💛

WTI CRUDE OIL: Buy signal at the bottom of the Channel Up.WTI Crude Oil turned bearish on its 1D technical outlook (RSI = 42.387, MACD = -1.000, ADX = 27.186) as it crossed under the 4H MA50. Still, it hit and is so far contained at the bottom of the Channel Up, which makes it a strong short term buy opportunity. Aim for the 4H MA200 (TP = 65.00).
## If you like our free content follow our profile to get more daily ideas. ##
## Comments and likes are greatly appreciated. ##

Gold Trading Plan: Liquidity Grabs, Pullback, and UptrendHello Ladies and Gentlemen!
Based on recent news and Trump’s turbulence, we are closely following macroeconomics, the ongoing tariff wars, and geopolitical events. Gold is showing signs of exhaustion after last week's pullback. While we see a recovery, we must remember that not everything we see can be trusted. However, based on our analysis of the current situation and an understanding of market execution and liquidity grabs, we expect a pullback that could confirm the uptrend — providing a potential opportunity to go long.
Here’s the plan:
1. Double check at the current liquidation level
2. Wait for a pullback around a key level below.
3. Confirm the continuation of the uptrend.
We must carefully monitor each market session and pay close attention to macroeconomic news releases, as the market may react sharply by grabbing liquidity. It will be interesting to see how far we can go from here with liquidity runs and whether additional pullbacks will occur. For now, we remain patient and wait for clear confirmation signals.
Share your ideas!

Hanzo | Gold15 min Breaks – Will Confirm the Next Move🆚 Gold – Hanzo’s Strike Setup
🔥 Timeframe: 15-Minute (15M)
——————
💯 Main Focus: Bullish Breakout at 3301
We are watching this zone closely.
💯 Main Focus: Bearish Breakout at 3270
We are watching this zone closely.
📌 If price breaks with high volume, it confirms Smart Money is in control, and a strong move may follow.
———
Analysis
👌 Market Signs (15M TF):
• Liquidity Grab + CHoCH at 3361
• Liquidity Grab + CHoCH at 3336
• Strong Rejections seen at:
➗ 3270 – Major support / Key level
➗ 3300 – Proven resistance
🩸 Key Zones to Watch:
• 3300 – 🔥 Bullish breakout level X 3 Swing Retest
• 3345 – Strong resistance (tested 5 times)
• 3270 – Equal lows
• 3370 – Equal highs


Snipers Only: Gold's Next Killzone Is LIVE – Eyes on 3295 -3373🔍 Macro + Context:
Gold continues to dance between uncertainty and calculated aggression. After rejecting cleanly from the premium zone at 3370, price dropped overnight into 3287, fulfilling our sniper buy setup from 3310 and hitting TP2 at 3370 with precision.
Now? Price is hovering at 3298, teasing a bigger directional play as we head into NY session. With inflation jitters, geopolitical undercurrents, and mixed USD sentiment, gold remains a reactionary beast—not a predictive one. Let structure speak.
📐 Technical Structure:
🧱 H1 Structural Key Levels:
🔸 3370–3376 = Premium Supply Zone – Clean rejection + break of structure
🔸 3345 = Previous lower high – Minor liquidity zone, watch for manipulation
🔸 3310 = Former TP1 & demand flip – Local structural retest
🔸 3285–3287 = Current HL attempt – LTF liquidity pool, key bounce zone
🔸 3233–3237 = HTF Discount OB – HTF demand, possible reversal anchor
🧠 Trend & Flow:
HTF Bias: Bullish (Daily still in higher-low territory)
LTF Flow: Bearish correction within HTF context
BOS/CHoCH: Clear BOS from 3370 to the downside
Liquidity: Swept at 3370 and now resting near 3287 lows
EMAs: LTF bearish slope, but HTF structure intact
RSI: Reset on M15–H1, hinting at potential momentum rebuild
🎯 Sniper Entry Zones (Clean, No Fluff):
🟩 BUY ZONE #1 (Reactive Entry)
3284 – 3288
Structure: H1–H4 Demand + Liquidity Sweep
Confluence: EQ of last push + M15 OB
🟩 BUY ZONE #2 (Deeper Reversal Only)
3233 – 3237
Structure: HTF OB + Untapped Daily Liquidity
🟥 SELL ZONE #1 (Intraday)
3372 – 3376
Structure: M15–H1 OB + Prior HTF Reaction
🟥 SELL ZONE #2 (Extreme Supply Test)
3448 – 3455
Structure: HTF FVG + Upper imbalance
⚠️ Eyes On:
Don’t trust the first breakout above 3345—it’s likely liquidity.
Watch how price reacts around 3295: bounce = bull continuation, crack = deeper dive into 3230s.
Momentum could explode NY session—wait for confirmation and never chase.
💬 Final Message :
Gold’s moving—but so are we.💡If this helped map your zones, smash that ❤️ and drop your bias in the comments. Are you stalking 3285 or waiting to trap sellers at 3370 again? Let’s catch these sniper plays together.
TradingView’s been too quiet lately – if you vibe with clean structure > hopium, show some love and let’s grow this smart gold tribe.
👇👇👇
Smart plans. No fluff. Just logic. Drop a 💡 and let’s connect.

XAUUSD Market Update – April 28, 2025 NY🎯 Quick Context:
Price successfully defended the support + liquidity pocket zone (around 3272–3288).
A bullish intraday reaction followed, but we are still trapped inside a consolidation range for now.
✅ Valid Zones Remaining from Daily Plan:
Support + Liquidity Pocket (3272–3288): ✅ Still active and valid as strong support.
Minor Resistance Level Inside Range (3350–3360): ✅ Remains relevant for possible rejections.
Major Flip + Resistance Zone (3380–3395): ✅ Still untouched and valid — upper upside target if bullish continuation happens.
⚠️ Zones Weakened or Invalidated:
Micro Support 3310–3315: ⚠️ Structure failed to hold cleanly — now treated as a neutral zone (no strong bias here).
Intraday Pivot 3260–3265: ⚠️ Previously breached — weak support for now, not a major focus.
🔥 Possible Scenarios:
Bullish Scenario 🟢
Holding above 3272–3288 = potential rally toward 3310–3315, then 3350–3360.
Solid break and close above 3360 = bullish continuation potential toward 3380–3395.
Bearish Scenario 🔴
Clear loss of 3272–3288 = risk of a sharper selloff toward lower discount zones (~3220–3240).
🧠 Extra Observations:
Current structure = sideways/consolidation between buyers and sellers.
Short-term momentum (M15–M30) is trying to lean bullish but without a confirmed HH yet.
HTF bias (H1–H4) remains slightly bullish as long as price holds above the 3272–3288 support zone.
📢 Final Note:
🏹 Patience is key. Let price react around the zones — we are ready and disciplined to execute based on real confirmation, not emotions.
✨ Final Friendly Message:
"We’ve already done the heavy lifting by marking the battlefield. 🛡️ Now it’s all about patience, precision, and letting Goldie show its next move. 📈✨
Stay sharp, stay humble – and remember: we react, not predict. 🎯
Let’s make this a week where we checkmate the market together! ♟️
If you enjoyed this update, leave a like, drop a comment, or just say hi – you’re part of the GoldFxMinds crew! 🚀💬❤️"

SPY/QQQ Plan Your Trade Update : Playing Into The Major BottomThis update highlights what I believe will be the last level of defense for price (support) on the SPY and why it is so important to HEDGE the markets right now.
The upward price move has reached the ULTIMATE HIGH (I believe) and is now moving into a Bullish EPP pattern (shifting into the downward pullback, then it will move into the flagging phase).
This flagging phase will be the deciding move (IMO) related to IF the markets attempt to break upward or downward near the current Fib 50% level.
This is why it is so important to HEDGE all open positions right now.
This battle zone in the markets (near the Fib 50% level) is not a guaranteed move higher or lower. Basically, we are watching the battle take place in live trading.
What we can do is try to rely on the EPP patterns and other formations to help guide us to the highest probable outcome, but we have to stay liquid and fluid as the markets trend.
Right now, I would suggest the breakdown (Major Low) outcome is about 70-80% likely. Thus, the breakaway (upside) outcome may be 20-30% likely based on my analysis.
But that could change if the SPY moves above $555.
Thank you again for all the great comments. I'm trying to help as many traders as I can. But this move to the 50% level is very "indecisive". So, I'm having to rely on Fibonacci Price Theory and other techniques (money management/HEDGING) as a way to protect my capital while I trade.
This is a great example of how you can learn techniques (beyond technical analysis) related to what to do when you really don't know what the markets may do in the near future.
The answer is HEDGE ACTIVE POSITIONS - or pull trades off (even if they are at a loss) and then HEDGE whatever you want to keep active.
No one is going to laugh when you tell them, "I protected my capital by hedging last week" when they are looking at severe losses and you are NOT looking as severe losses.
It is SMART TRADING.
Get some.
#trading #research #investing #tradingalgos #tradingsignals #cycles #fibonacci #elliotwave #modelingsystems #stocks #bitcoin #btcusd #cryptos #spy #gold #nq #investing #trading #spytrading #spymarket #tradingmarket #stockmarket #silver

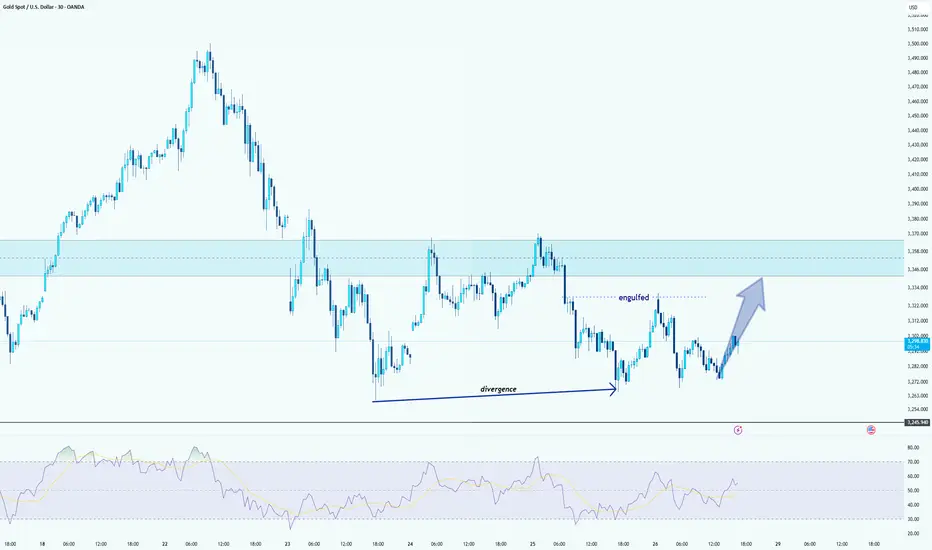
Gold (xauusd) a bullish momentum !hello guys
Let's analyze Gold!
Trend Overview:
The market has been in a downtrend but has recently shown signs of potential reversal.
Key Observations:
Divergence Identified:
A bullish divergence is clearly spotted between the price action and the RSI indicator. While the price made lower lows, the RSI made higher lows, suggesting weakening selling pressure and a possible trend reversal.
Engulfing Pattern:
An important bullish engulfing pattern appeared around the support area, reinforcing the bullish reversal possibility.
Support and Resistance Zones:
The light blue shaded area represents a key resistance zone where price previously consolidated and sold off. This area will likely act as a strong resistance again upon retest.
Expected Movement:
Based on the bullish divergence and engulfing pattern, a move towards the resistance zone is anticipated, as illustrated by the upward arrow on the chart.
GOLD: Target Is Up! Long!
My dear friends,
Today we will analyse GOLD together☺️
The price is near a wide key level
and the pair is approaching a significant decision level of 3,332.62 Therefore, a strong bullish reaction here could determine the next move up.We will watch for a confirmation candle, and then target the next key level of 3,359.49.Recommend Stop-loss is beyond the current level.
❤️Sending you lots of Love and Hugs❤️

GOLD ROUTE MAP UPDATEHey Everyone,
Great start to the week with our chart idea playing out perfectly inline with our plans to buy dips.
We got our bearish targets 3306 and then into the retracement range like we analysed and then the perfect bounce now heading towards our Bullish targets.
We will look for a test and break above 3344 for a continuation or failure to test and lock above this level will se price play back into the lower Goldturns for support.
We will keep the above in mind when taking buys from dips. Our updated levels and weighted levels will allow us to track the movement down and then catch bounces up.
We will continue to buy dips using our support levels taking 30 to 40 pips. As stated before each of our level structures give 20 to 40 pip bounces, which is enough for a nice entry and exit. If you back test the levels we shared every week for the past 24 months, you can see how effectively they were used to trade with or against short/mid term swings and trends.
The swing range give bigger bounces then our weighted levels that's the difference between weighted levels and swing ranges.
BULLISH TARGET
3344
EMA5 CROSS AND LOCK ABOVE 3344 WILL OPEN THE FOLLOWING BULLISH TARGETS
3367
POTENTIALLY 3390
EMA5 CROSS AND LOCK ABOVE 3390 WILL OPEN THE FOLLOWING BULLISH TARGET
3428
EMA5 CROSS AND LOCK ABOVE 3428 WILL OPEN THE FOLLOWING BULLISH TARGET
3458
EMA5 CROSS AND LOCK ABOVE 3458 WILL OPEN THE FOLLOWING BULLISH TARGETS
3478
POTENTIALLY
3503
BEARISH TARGETS
3306 - DONE
EMA5 CROSS AND LOCK BELOW 3306 WILL OPEN THE RETRACEMENT RANGE
3285 - DONE
3259
EMA5 CROSS AND LOCK BELOW 3259 WILL OPEN THE SWING RNGE
3233
3201
EMA5 CROSS AND LOCK BELOW 3201 WILL OPEN THE SECONDARY SWING RANGE
SECONDARY SWING RANGE
3159 - 3112
As always, we will keep you all updated with regular updates throughout the week and how we manage the active ideas and setups. Thank you all for your likes, comments and follows, we really appreciate it!
Mr Gold
GoldViewFX

SILVER: Move Down Expected! Short!
My dear friends,
Today we will analyse GOLD together☺️
The recent price action suggests a shift in mid-term momentum. A break below the current local range around 33.0203 will confirm the new direction downwards with the target being the next key level of 32.8151.and a reconvened placement of a stop-loss beyond the range.
❤️Sending you lots of Love and Hugs❤️

XAUUSD – Daily Trading Plan – April 28, 2025🎯 Market Outlook:
Gold remains trapped in a corrective range between 3260 and 3380, after an aggressive rally to new all-time highs.
Currently, price is consolidating just below a major supply/flip zone (3380–3395) and above a key support pocket (3260–3280).
HTF (High Timeframe) bias: Still bullish as long as the 3220–3235 pivot holds.
LTF (Lower Timeframe) flow: Sideways, with minor bullish attempts inside the range.
🔥 Key Zones to Watch:
Resistance Zones:
3380–3395 → Major flip and strong resistance zone.
3350–3360 → Minor local resistance inside premium.
Support Zones:
3260–3280 → Major intraday support + liquidity pocket.
3220–3235 → Last pivot to maintain bullish HTF bias (critical for any continuation).
👀 Eyes On:
Price reaction inside 3380–3395 → Will it reject again or break through to unlock 3410–3430?
Weakness signs near 3350–3360 → Watch for potential bull traps if momentum fades.
Respect for 3260–3280 → A bounce from here would confirm buyers still protecting liquidity pockets.
HTF invalidation below 3220 → Would flip the entire structure bearish short-term.
📢 Final Words:
Goldie's playing chess, not checkers — patience and sniper precision will make the difference this week. ♟️✨
Stay sharp, stay smart — we trade real flow, not hopes or dreams.
🔔 Follow the flow, adapt the plan, and let's continue hunting clean moves together!
#Gold #XAUUSD #SmartMoney #MindsetMatters #GoldMindsFX

GOLD falls more than 40 Dollars, widening correction rangeSpot OANDA:XAUUSD unexpectedly accelerated its decline during the Asian trading session on Monday (April 28). The current price of gold is around 3,280 USD/ounce, down more than 40 USD on the day. The price of gold has gradually decreased compared to the intraday high of 3,336.98 USD/ounce reached at the beginning of the trading session.
The easing of trade tensions between China and the United States has weakened gold’s appeal as a safe haven. Gold prices have fallen more than 5% since breaking above $3,500 an ounce last Wednesday.
The latest developments around US-China trade relations and the release of key US macroeconomic data will trigger gold’s near-term price action. Market participants will be closely watching US economic growth and employment data this week.
The latest data from the US Commodity Futures Trading Commission (CFTC) showed that hedge fund managers cut their net long positions in gold futures and options to a 14-month low.
Technical Outlook Analysis OANDA:XAUUSD
On the daily chart, gold has dropped below the raw price of $3,300 and at its current position it could continue to decline further with a short-term target of around $3,245 where the price confluences with the upper edge of the price channel.
Although gold has fallen significantly from $3,500, looking at the overall chart, gold still has bullish conditions with support from EMA21 and the rising price channel as the long-term trend. On the other hand, the down trending RSI is also approaching the 50 level, in this case the 50 level is the closest support at present, indicating that there may not be much room for decline in the short term.
Once gold is back in action above the 0.382% Fibonacci retracement level, it will be in position to rebound with a target of around $3,371 in the short term.
During the day, the bearish correction could continue but will be limited by the EMA21 and the price channel. Along with that, the bearish correction along with the main uptrend will be noticed by the following technical positions.
Support: $3,245 – $3,228 – $3,200
Resistance: $3,292 – $3,371
SELL XAUUSD PRICE 3328 - 3326⚡️
↠↠ Stop Loss 3332
→Take Profit 1 3320
↨
→Take Profit 2 3314
BUY XAUUSD PRICE 3226 - 3228⚡️
↠↠ Stop Loss 3222
→Take Profit 1 3234
↨
→Take Profit 2 3240

XAUUSD: 28/4 Today's Market Analysis and StrategyGold technical analysis
The resistance level of the four-hour chart is 3370, and the support level is 3225-3230
The resistance level of the one-hour chart is 3330, and the support level is 3260
The resistance level of the 30-minute chart is 3300, and the support level is 3268.
The current price of 3290 is in the oversold rebound stage. Now it will continue to rebound upward after standing firm on the 30-minute/1-hour support. The strength and weakness dividing line focuses on the 3300 line. After breaking through, it confirms the short-term bullish strength and continues to the 3330 resistance zone;
On the contrary, if it falls below 3268-3270, it may accelerate the decline. Focus on the price response of the three positions of 3270 and 3300/3330.

GOLD - WAVE 4 CORRECTION TO $2,800 (UPDATE)Don't forget we're still in a Wave 4 correction, before the next Gold bull run (Wave 5) resumes. Expecting a mid term flat correction & as this is Wave 4, it is likely we'll experience choppy market conditions.
But get ready to buy the huge, discounted dip back up📈

GOLD Trading Opportunity! SELL!
My dear subscribers,
This is my opinion on the GOLD next move:
The instrument tests an important psychological level 3307.1
Bias - Bearish
Technical Indicators: Supper Trend gives a precise Bearish signal, while Pivot Point HL predicts price changes and potential reversals in the market.
Target - 3292.6
My Stop Loss - 3313.6
About Used Indicators:
On the subsequent day, trading above the pivot point is thought to indicate ongoing bullish sentiment, while trading below the pivot point indicates bearish sentiment.
Disclosure: I am part of Trade Nation's Influencer program and receive a monthly fee for using their TradingView charts in my analysis.
———————————
WISH YOU ALL LUCK


Gold-Silver Ratio: Silver’s Lag and Historical DivergencesThe gold-silver ratio - the number of silver ounces equals in value to one ounce of gold – has surged recently as gold prices rally while silver underperforms. Gold, a traditional safe-haven, has climbed to record highs amid economic uncertainty, whereas silver, which is partly an industrial commodity, has struggled to break past $35/oz. As a result, the ratio is around 100 – meaning gold is ~100 times the price of silver despite the correction in the ratio from its peak around 125.
For context, the ratio averaged 57 from 1975-2000, and between 2000-2025 the ratio has ranged from 32 and 125 (with the max level reached this month with an average of 68. The ratio has observed extreme spikes in unusual crises).
Today’s elevated ratio highlights the divergence between gold’s sharp rally and silver’s lagging performance. The 25-year mean of the ratio is at 68, suggesting the present levels (100) represent an extreme deviation in favour of gold.
Historical Parallels in Gold-Silver Divergences
Similar wide divergences between gold and silver have occurred in the past. Key historical episodes illustrate how silver eventually played “catch-up” after lagging gold – albeit with varying lag times:
1970s – Silver’s Late Surge: After the U.S. abandoned the gold standard, gold prices soared while silver lagged. However, silver eventually staged a sharp rally later in the decade, quickly closing the gap and driving the gold-silver ratio sharply lower.
1980s – Prolonged Underperformance: Following the 1980 peak, precious metals collapsed, with silver suffering far more than gold. The gold-silver ratio surged and remained elevated through the 1980s and 1990s, as silver failed to catch up and largely moved sideways until the 2000s.
Early 2000s – Post-Recession Catch-Up: After the 2001 recession, gold began a
new bull market while silver initially lagged. Eventually, silver outpaced gold’s gains over the next several years, significantly narrowing the gold-silver ratio.
2008 Financial Crisis – Sharp Divergence and Recovery: The 2008 crisis caused gold to outperform sharply as silver collapsed. However, as the economy recovered, silver staged a dramatic rebound, quickly closing the gap and normalizing the ratio by 2011.
Why Is Silver Lagging Now? Industrial Demand Uncertainty
Roughly half of silver demand is industrial (electronics, photovoltaics, chemicals). Persistent worries about a global manufacturing slowdown and elevated inventories have capped silver’s upside just as investors have chased gold for geopolitical protection.
Source: Silver Institute
Worries about industrial demand have been exacerbated by the recent trade uncertainties which impact industrial sectors in an outsized manner.
By contrast, gold’s appeal as a safe haven has been boosted by geopolitical and inflation fears, driving it to record highs in 2025.
Despite cyclical swings, the underlying secular trend has crept higher for decades. Gold’s monetisation (central-bank reserves, ETF holdings surge) versus silver’s demonetisation, higher real production costs for gold, and silver’s growing industrial elasticity are all factors that represent a risk to normalization of the GSR.
Even a forceful mean-reversion might therefore stall nearer 60–70 than the sub-40 extremes of earlier cycles.
Hypothetical Trade Setups
History shows that once macroeconomic uncertainty clears, silver often recovers lost ground quickly. In previous periods of extreme gold-silver divergence, from the 1970s through 2008, silver staged strong rallies that pushed the gold-silver ratio (GSR) back toward normal levels.
Today, however, silver’s outlook remains clouded by uncertainty, particularly amid the ongoing trade war. Prices risk stalling below resistance around $35/oz. Consequently, the normalization in the GSR may instead result from a correction in gold prices. Gold has consistently broken record highs, and its long-term outlook remains firmly bullish. Nevertheless, concerns about the sustainability of the recent rally are valid - last week, gold fell sharply after setting a new high above $3,500/oz.
In summary, a normalization in the GSR could result from either a silver rally or a gold correction. While each path remains uncertain, a position focused on the ratio itself is relatively insulated from further divergence.
Given this environment, we could express our view in GSR through a long position in silver and a short position in gold. Investors can implement this using CME Micro Silver and Micro Gold futures. This setup benefits from 72% margin offsets. The Micro contracts balance the notional value between both legs by using one contract each.
A hypothetical trade setup consisting of a short position in CME Micro Gold futures expiring in June (MGCM2025) and a short position in CME Micro Silver futures expiring in June (SILM2025), offering a reward to risk ratio of 1.6x, is described below.
MARKET DATA
CME Real-time Market Data helps identify trading set-ups and express market views better. If you have futures in your trading portfolio, you can check out on CME Group data plans available that suit your trading needs tradingview.com/cme .
DISCLAIMER
This case study is for educational purposes only and does not constitute investment recommendations or advice. Nor are they used to promote any specific products, or services.
Trading or investment ideas cited here are for illustration only, as an integral part of a case study to demonstrate the fundamental concepts in risk management or trading under the market scenarios being discussed. Please read the FULL DISCLAIMER the link to which is provided in our profile description.
