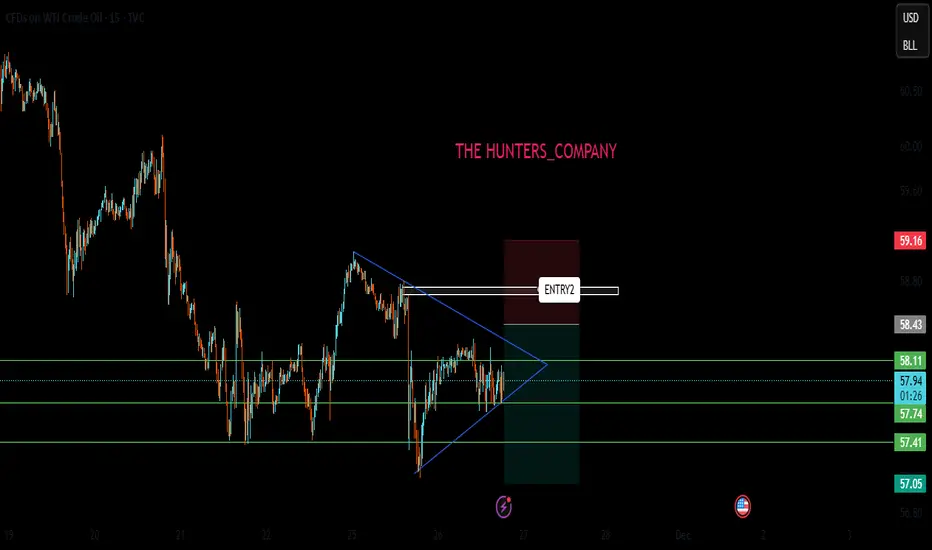
SILVER Long IdeaWe have a unconfirmed ascending triangle formation at silver. After the daily close on the red lines , formation will be confirmed and we can target easly to the blue area as shown
Commodities

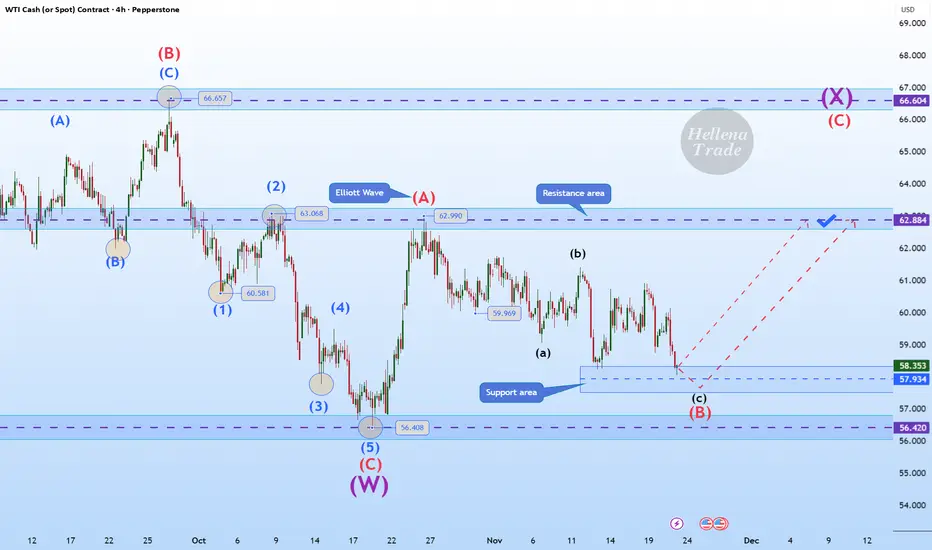
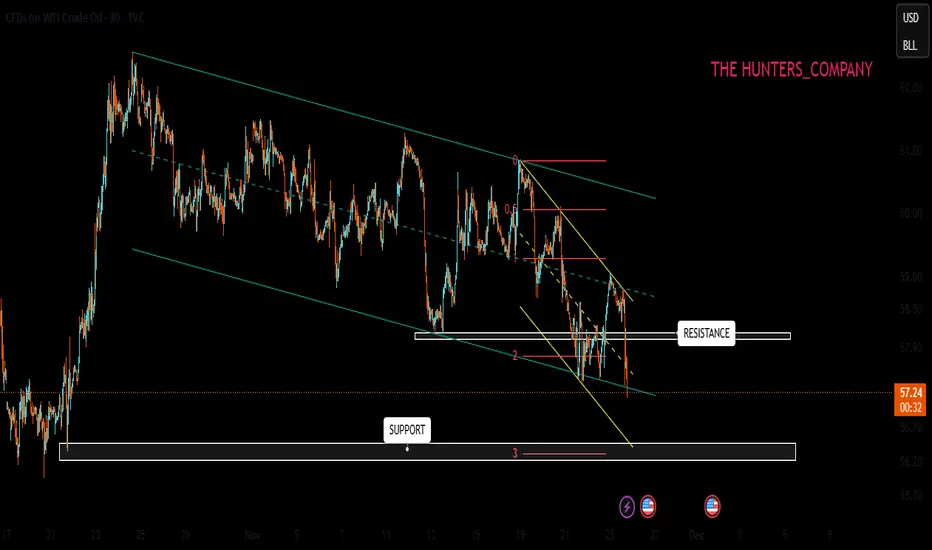
Hellena | Oil (4H): LONG to the area of the maximum of wave “A”.Colleagues, the past forecast has not been canceled, but I see some changes and therefore feel it is necessary to make a fresh forecast.
Apparently, the corrective wave “B” has extended to the area of 57.930. This is quite close to the low of wave “C” at 56.408 and the price should not update it, otherwise there will be a full-fledged break of the structure.
In connection with the above, I think that the price is already completing the downward movement and I expect the resumption of the upward movement at least to the area of the maximum of wave “A” - 62.990.
Manage your capital correctly and competently! Only enter trades based on reliable patterns!
GOLD (XAUUSD): Another BoS
A quick follow-up for the yesterday's post for Gold.
The price successfully bounced and broke another intraday resistance,
setting one more local higher high on a 4H.
The market will most likely continue rising following the plan
and reach 4205 soon.
❤️Please, support my work with like, thank you!❤️
I am part of Trade Nation's Influencer program and receive a monthly fee for using their TradingView charts in my analysis.

Gold broke through trendline resistance. Bullish.Due to Thanksgiving, overall price fluctuations were limited, mainly range-bound, oscillating within the 4140-70 range, although the daily chart closed higher. Currently, the downtrend line has been temporarily broken, and aggressive buying at higher levels is not recommended until it is firmly established above this level. Looking at the four-hour chart, the gold triangle consolidation pattern remains unchanged, with the downward trendline resistance around 4175. Only a decisive break above this trendline resistance can lead to further upward movement, presenting a new buying opportunity!
On the one-hour chart, the price is repeatedly testing the resistance zone, showing short-term spikes. After the one-hour candlestick firmly establishes itself above 4175, watch for short-term corrections, which could present buying opportunities. Today, continue to monitor the price reaction at the upper trendline of the triangle at 4175, which is also the key level for today's bullish/bearish trend. If it holds above this level, further gains to 4200-4220 are possible.
Key Levels:
First Support: 4152, Second Support: 4140, Third Support: 4122
First Resistance: 4190, Second Resistance: 4208, Third Resistance: 4222
Gold Trading Strategy:
BUY: 4145-4150, SL: 4130, TP: 4170-4180;
SELL: 4200-4205, SL: 4220, TP: 4180-4170;
More Analysis →

Stop!Loss|Market View: NZDUSD🙌 Stop!Loss team welcomes you❗️
In this post, we're going to talk about the near-term outlook for the NZDUSD currency pair☝️
Potential trade setup:
🔔Entry level: 0.57355
💰TP: 0.57796
⛔️SL: 0.57134
"Market View" - a brief analysis of trading instruments, covering the most important aspects of the FOREX market.
👇 In the comments 👇 you can type the trading instrument you'd like to analyze, and we'll talk about it in our next posts.
💬 Description: By the end of the week, the US dollar remains under pressure for the short term, so a rise to 0.58000 is also expected for NZDUSD. A potential buy trade could be initiated by breaking the upper limit of the current accumulation in the triangle pattern that has formed at 0.57300.
Thanks for your support 🚀
Profits for all ✅

XAUUSD – Ascending channel in play, eyes on the 4,240 regionXAUUSD – Ascending channel in play, eyes on the 4,240 region
Brian – Buying the dip within structure, watching for a fade at higher resistance
Market overview & structure
On the H4 chart, gold is trading neatly inside a well-defined ascending channel, printing higher highs and higher lows. The current leg is pushing up towards the 4,237–4,240 area, which lines up with:
The upper boundary of the channel
A key resistance zone
The 1.618 Fibonacci extension and resting liquidity above recent highs
So for now, the broader bias remains bullish, but as price creeps closer to 4,240, the risk of profit-taking and short-term selling naturally increases.
Wave & technical context
This move is an extension of the previous bullish structure after price broke out of the old descending channel and started to build a new bullish one.
Liquidity levels around 4,193 and above suggest the market has been building positions and still has room to drive price into the higher resistance band.
The buy zone around 4,154–4,157, near the lower edge of the channel, is where buyers are likely to step back in to defend the trend.
As long as price holds above 4,150–4,154, the continuation scenario towards 4,240 remains the higher-probability path.
Key zones & trading plan
Primary scenario – Buy with the trend
Buy zone: 4,154–4,157 (channel support + marked buy zone).
Idea: Wait for a pullback towards the lower boundary of the channel, or a brief liquidity sweep into this region, then look for a clear rejection candle on H1/H4 before going long.
Targets:
Short term: 4,190–4,200 (mid-channel / interim liquidity).
Extended: 4,237–4,240 (major resistance + 1.618 Fib extension).
This is a trend-following “buy the dip” setup, more suited to swing and short-term position traders rather than scalpers.
Secondary scenario – Short-term fade from 4,237–4,240
Sell zone: 4,237–4,240 – confluence of strong resistance and the 1.618 Fibonacci extension.
Idea: If price tags this zone and shows clear rejection (long upper wicks, bearish reversal pattern on H1/M15), it may offer a counter-trend short back towards the middle of the channel or the 4,190–4,200 support area.
As this is a counter-trend play:
Keep position size smaller than the main long idea.
Use a tight stop above 4,240 and avoid widening it out of emotion.
Macro and liquidity backdrop
Liquidity is likely to thin out towards the end of the session with the US Thanksgiving period in play, which can lead to the odd sharp spike or stop-hunt, especially around obvious liquidity pools.
On the political front, headlines such as Mr Trump’s comments about “permanently suspending immigration from third-world countries” add to broader policy uncertainty, but the impact on gold is indirect via risk sentiment rather than a direct driver.
It’s also worth noting that silver has been rallying strongly, supported by solar-related demand and supply concerns – a bit of a “silent workhorse” at the moment. That doesn’t remove gold’s role, but it does show that precious metals as a whole are attracting capital.
Strategy & risk management
For now, my focus is on buying dips around 4,154–4,157 in line with the ascending channel, and only looking for tactical shorts if price clearly rejects the 4,237–4,240 band.
I prefer not to open fresh trades when US liquidity is extremely thin or straight into major holiday sessions, as spreads can widen and price can behave erratically.
If we see a decisive close below the buy zone and a clean break of the channel structure, this bullish plan is invalidated – at that point it’s better to step aside and reassess rather than forcing trades.
What do you reckon – does this structure still favour the bulls, or are you leaning towards a deeper correction from the 4,240 region? Feel free to share your view in the comments.

GOLD ANALYSIS 11/27/2025🟦 1. Fundamental Analysis:
a) Economy:
• USD:
The USD continues to weaken due to expectations that the FED will cut interest rates in 2026. Falling bond yields reduce the opportunity cost of holding gold → positive for GOLD.
• US Stock Market:
The U.S. market remains in the green thanks to expectations of monetary easing and the new administration’s stimulus package. Risk-on sentiment increases but does not pressure gold because the USD is still weak.
• FED:
The FED maintains a dovish tone, implying that inflation is moving in the right direction and they are ready to ease → supports gold’s bullish trend.
• TRUMP:
Plans for tax cuts and increased public spending → risk of a larger budget deficit → markets increase demand for hedging → gold becomes favored.
• Gold ETF – SPDR:
SPDR resumed strong net buying (4.57 tons yesterday), confirming large inflows returning to gold. This reinforces the current bullish trend.
b) Geopolitics:
Tensions in the Middle East remain unresolved, and Ukraine continues to escalate locally.
→ Safe-haven demand stays elevated, supporting gold.
c) Market Sentiment:
Current sentiment: risk-mixed
• Rising stocks → risk-on
• Falling USD + SPDR net buying → risk-off leaning toward gold
→ Overall: gold still holds a bullish advantage. However, the Thanksgiving holiday is reducing trading activity this week.
🟩 2. Technical Analysis:
Trend:
Gold is in a short-term uptrend after breaking the downtrend line, retesting successfully, and continuing upward.
Price Structure:
• Price consolidates around 4.36–4.173
• MA20–MA50 sloping upward
• RSI remains above 50 → buyers dominant
• Technical targets: 4.193 → 4.244
Key Levels:
• Resistance: 4.173 – 4.193 – 4.244
• Support: 4.136 – 4.096 – 4.062
🟧 3. Yesterday’s Market (26/11/25):
GOLD:
• Tapped support at 4.136 and bounced strongly to 4.173
• No bearish reversal candlestick
• Uptrend remains solid with stable volume
USD:
USD weakness is clear → supports GOLD’s bullish continuation.
SPDR:
SPDR continues net buying, confirming strong demand.
🟥 4. Trading Strategy Today (27/11/25):
🪙 SELL XAUUSD | 4195 – 4193
SL: 4199
TP1: 4187
TP2: 4181
🪙 BUY XAUUSD | 4109 – 4111
SL: 4105
TP1: 4117
TP2: 4123

GOLD broke out of the H4 trendline — real breakout or trap? Hello Traders! 👋
Gold has broken out of the H4 descending trendline, boosted by geopolitical tension and a weaker USD.
But the real question is: Is this a true breakout or just FOMO before a drop?
Here are the key zones I’ll be watching today:
BUY Zones (SL 10 – TP 10)
• 4165 – 4155
• 4170 – 4175
• 4140 – 4145
• 411x
• 4099
SELL Reaction Zones (SL 10 – TP 10)
• 4200 – 4203
• 4212 – 4215
• 4230
• 4245 – 4247
👉 If price breaks below 4133, the trendline fails → potential sell-continuation setup.
📌 Bias: BUY is the main play — SELL only for short reaction scalps.
💬 What do YOU think — real breakout or classic bull trap? Drop your thoughts below!
❤️ Let’s discuss & grow together!

XAUUSD – Triangle Breakout & Bullish Expansion ViewGold finally broke out from the symmetrical triangle pattern that was forming for many sessions.
The breakout candle was large, clean, and with strength, which is exactly what I expect for a valid move — no confusion candle, no fake wick.
One thing I really liked is the anchored Volume Profile.
The highest volume node sits exactly at the middle of the triangle, showing solid accumulation inside the pattern.
When such a heavy volume area gets broken with a big candle, most of the time the trend continues.
Right now, price is stepping out from compression into expansion mode.
✨ My View
I’m keeping this very simple.
Gold has broken the triangle, respected key support levels, and now moving toward the Fib Extension target.
The next expectation zone is already marked on the chart:
🎯 Target (Fib Extension): 4195
As long as price stays above the broken trendline area, the bullish structure remains valid.
📊 Fundamental Boost – US Data Today
- Today’s numbers gave additional support for gold:
- USD Core PPI m/m: 0.2% (forecast -0.1%)
- Core Retail Sales m/m: 0.3% (previous 0.7%)
- PPI m/m: 0.3% (forecast -0.1%)
- Retail Sales m/m: mixed but not extremely strong
Overall, the data is not strong enough to kill gold’s momentum, and the breakout technically already confirmed itself.
So combining technical breakout + volume + fundamentals, gold looks bullish toward the next extension level.
📘 Disclaimer
This is only my personal market approach, not financial advice. Trade safely.

Gold Pushes Higher as Buyers Dominate Above 4,180Hello everyone,
Gold is extending its momentum after a clean breakout through the 4,180 barrier, climbing to 4,189 USD with strong follow-through. The advance is supported by consecutive bullish FVG structures underneath the price, signaling that buyers are not only active but also willing to drive the market higher. Previous volume congestion zones have been absorbed entirely, reinforcing the idea that the bullish side is firmly in control.
In the short term, 4,180 has flipped into fresh support. If momentum persists, the next natural target sits at the psychological 4,200 level—an area that often fuels additional liquidity inflows. Should gold retrace, the 4,110–4,140 zone stands out as a well-tested support cluster and a potential area to accumulate in line with the broader bullish trend.
Macro conditions continue to favor precious metals. The USD is softening on expectations of a December 2025 rate cut, and this sentiment remains a major catalyst behind gold’s advance. Meanwhile, consistent central-bank buying and steady ETF inflows, noted by Morgan Stanley, help sustain longer-term demand. With these foundations, projections toward 4,500 USD in mid-2026 appear increasingly reasonable.
Short-term volatility may still occur if key economic releases shift interest-rate expectations. A rebound in the USD or a sudden change in Fed tone could trigger deeper pullbacks before the uptrend resumes.
Overall, gold maintains a strong bullish structure backed by both technical and macro drivers. Watching support levels closely could offer valuable opportunities during dips.
What do you think—will this momentum continue?

Gold Rises as Fed Signals Dovish PathHello everyone,
Spot gold closed on 26/11 around 4,162 USD, touching 4,170 USD at one point — the highest since 14/11. The CME FedWatch tool now shows ~85% of the market expecting a 0.25% rate cut at the December Fed meeting, a sharp increase from 30% just a week ago.
Officials such as Christopher Waller and John Williams have signaled support for easing, along with the potential appointment of Kevin Hassett as Fed Chair, further strengthening the case for long-term support in gold. Major banks like Deutsche Bank have raised next year’s average gold forecast to 4,450 USD, while central bank demand remains steady. In short, from a news perspective, all factors favor the bulls.
On the H4 chart, gold has just risen from the ~4,020–4,040 area above 4,150, then consolidated in a cluster of small candles just below the 4,165–4,170 peak. This is a classic high-level accumulation pattern, often preceding the next breakout. Below, two green FVG clusters around 4,110–4,120 and 4,050–4,070 act as strong support platforms, previously providing decisive upward momentum.
Sole forecast: gold continues to RISE.
In the short term, minor pullbacks to 4,140–4,130, or even 4,120 to test the green FVG, are possible. As long as 4,110 holds, these retracements remain part of the ongoing uptrend.

XAUUSD Bullish Momentum Continues — Target 4,350OANDA:XAUUSD is still trading within a clearly defined ascending channel, with recent price action bouncing off a key support level. This suggests that the bullish trend is likely to continue, with the next target being around 4,350, aligning with the upper boundary of the channel.
A short-term pullback could present a buying opportunity, especially if bullish candlestick patterns like engulfing or hammer appear, signaling strength from the buyers. A decisive breakout above recent highs would further reinforce the momentum towards the expected target.
However, if the price breaks below the lower boundary of the channel, it would invalidate the bullish outlook and potentially signal a shift in market direction.
This is just my perspective on the market, not financial advice. Best of luck!

GOLD FREE SIGNAL|LONG|
✅XAUUSD bullish displacement out of the consolidation shows price drawing toward buy-side liquidity after mitigating the prior sell-side sweep. Upside imbalance remains unfilled, pulling price toward the next target zone.
—————————
Entry: 4166$
Stop Loss: 4135$
Take Profit: 4204$
Time Frame: 4H
—————————
LONG🚀
✅Like and subscribe to never miss a new idea!✅

Gold - This bullrun is now over!🚨Gold ( TVC:GOLD ) won't create new highs:
🔎Analysis summary:
All the way back in 2019, Gold confirmed its rounding bottom formation. This breakout was then followed by a major rally of about +200% over the past couple of years. But at this moment, Gold is retesting a major resistance trendline and will therefore end its bullrun.
📝Levels to watch:
$4,200
SwingTraderPhil
SwingTrading.Simplified. | Investing.Simplified. | #LONGTERMVISION

GOLD WEEKLY CHART MID/LONG TERM ROUTE MAPHey everyone,
Please see our weekly chart timeframe Routemap and Trading plans for the week ahead.
After securing 4059 last week, we now have a long range candle body close gap above at 4294, with 4059 acting as support. We can expect price action to play between these two levels. A further EMA5 cross and lock above 4059 will strengthen the gap toward 4294. Conversely, a candle body close back below 4059 would reopen the broader retracement range.
We’ll keep these long timeframe structures in mind as we continue with our plan to buy dips.
We will keep you all updated as this chart idea unfolds.
Mr Gold

Silver Cup and Handle Pattern: Bullish SetupThis 4-hour chart on silver displays a textbook cup and handle formation.
The cup forms as silver rounds off a previous high and builds a base, signaling accumulation and renewed buying interest. The handle’s consolidation, often a descending channel, typically retraces less than half of the cup’s advance. Breakout confirmation comes when price closes above the handle’s downward resistance line
Statistically, the measured move upon breakout is often the depth of the cup added to the breakout level, indicating strong upside potential if the pattern completes successfully.
A conservative target is $54 - $57.
A silver rally can reflect broad risk-on sentiment. Historically, decisive moves in precious metals have sometimes coincided with bullish developments in the crypto market, triggered by macro events like Federal Reserve rate cuts or rising monetary inflation.

XAUUSD: Market Analysis and Strategy for November 27Gold Technical Analysis:
Daily Resistance: 4210, Support: 4000
4-Hour Resistance: 4180, Support: 4110
1-Hour Resistance: 4170, Support: 4130
The weekly chart continues its bullish trend. Tomorrow's monthly/weekly chart closes, directly impacting the December technical outlook.
The daily chart continues its upward trend. The newly formed "rounded bottom" needs to be monitored for its sustainability. Bollinger Bands are widening upwards, and the middle band and moving average support are gradually moving upwards. As mentioned in recent analyses, the main strategy is to follow the trend and be bullish. The next key level to watch is 4200. Long-term holders can wait for the Fed's interest rate decision before buying. The ideal long-term entry point for gold remains below 4000; however, short-term traders can buy low and sell high.
Based on the 1-hour chart, gold continued its upward trend during the European session, with the candlestick pattern indicating an upward channel. The next resistance level to watch is around 4180, followed by the psychological resistance at 4200. Support levels are around 4150/4140.
Trading Strategy:
BUY: 4150~4140
Selling strategies should be determined based on the real-time candlestick pattern.
More Analysis →

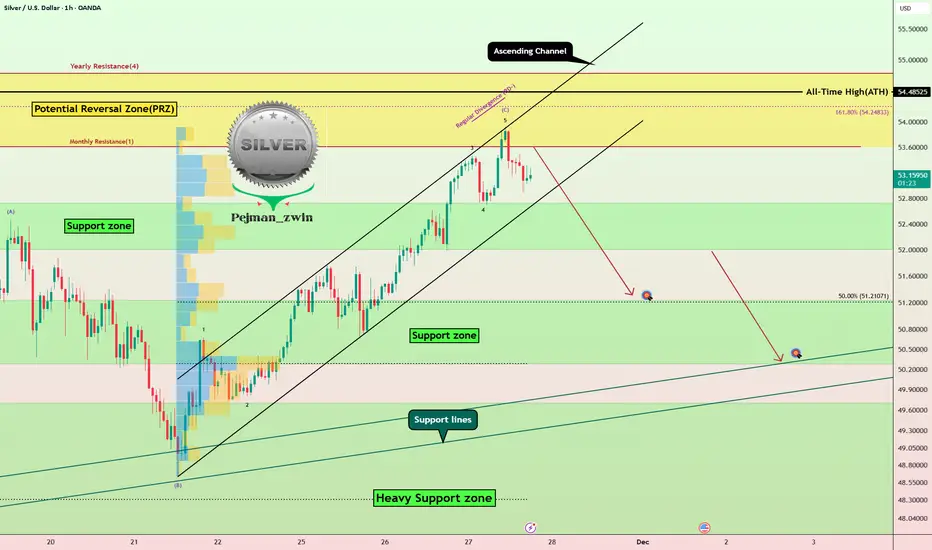
Silver Warning: RD- + PRZ = Short Opportunity?Today, we're diving into Silver ( OANDA:XAGUSD ), and it seems that there’s a potential short opportunity on the horizon.
Currently, silver is approaching a Potential Reversal Zone(PRZ) and an ascending channel.
From an Elliott Wave perspective, it appears that silver has completed wave C of an Expanding Flat Pattern(3-3-5/ABC).
Additionally, we’re noticing a Regular bearish Divergence (RD-) between the price peaks, which adds to the bearish sentiment.
I expect that, following a break below the lower line of the ascending channel, silver could also break through its Support zone($52.73-$52.00) and potentially decline to around the $51.33 level.
First Target: $51.33
Second Target: Support lines
Stop Loss(SL): $54.63
💡 Please respect each other's opinions and express agreement or disagreement politely.
📌 Silver/ U.S. Dollar Analyze (XAGUSD), 1-hour time frame.
🛑 Always set a Stop Loss(SL) for every position you open.
✅ This is just my idea; I’d love to see your thoughts too!
🔥 If you find it helpful, please BOOST this post and share it with your friends.
GBP/USD | Pound Hit All Targets and Looks Ready for Another DropBy analyzing the GBPUSD chart on the 2 hour timeframe, we can see that price moved exactly as expected. It dropped more than 120 pips to 1.30380, then bounced and climbed back into the second supply zone we marked. From that zone, GBPUSD immediately reacted with a 30 pip drop, showing the strong impact of these levels.
Right now price is around 1.3214, and I expect a deeper correction soon.
Keep in mind that before the main drop, GBPUSD might grab liquidity above 1.325, so the chances of a stop hunt are high. Stay tuned for the next updates on GBPUSD.
Please support me with your likes and comments to motivate me to share more analysis with you and share your opinion about the possible trend of this chart with me !
Best Regards , Arman Shaban

AG | Silver Miners Will Rise | LONGFirst Majestic Silver Corp. engages in the production, development, exploration and acquisition of mineral properties. It owns and operates producing mines in Mexico including the La Encantada Silver Mine, La Parrilla Silver Mine, San Martin Silver Mine, La Guitarra Silver Mine, Del Toro Silver Mine, Santa Elena Silver & Gold Mine, and San Dimas Silver & Gold Mine. The company was founded by Keith Neumeyer on September 26, 1979 and is headquartered in Vancouver, Canada.

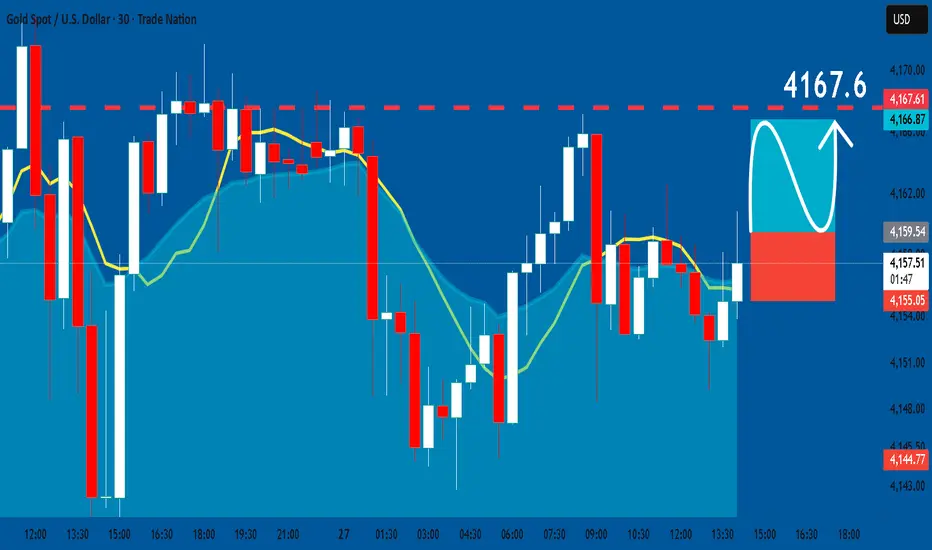
GOLD: Long Trade with Entry/SL/TP
GOLD
- Classic bullish formation
- Our team expects growth
SUGGESTED TRADE:
Swing Trade
Buy GOLD
Entry Level - 4159.5
Sl - 4155.0
Tp - 4167.6
Our Risk - 1%
Start protection of your profits from lower levels
Disclosure: I am part of Trade Nation's Influencer program and receive a monthly fee for using their TradingView charts in my analysis.
❤️ Please, support our work with like & comment! ❤️
USOIL : Full analysisHello friends
Well, you see that we have a descending channel in which the price is moving, and considering that the price reached the ceiling of the channel, we had a Sharpe decline, and now it seems that the sellers want to break the channel, and the first support identified could be the buyers' stronghold, where we need to see if they support the price or not.
If they support, there is a significant resistance in their way. This area is full of sell orders and can naturally correct the price. In this regard, breaking this resistance is very important and vital for price growth.
Now what if the buyers cannot support the price in the support area and the price falls further?
Well, we need to find areas again for a sell trade because if the descending channel is broken, the fall will be heavier and it is better to move with the trend.
This analysis is purely technical and is not a buy or sell recommendation.
*Trade safely with us*
USOIL : LIVE TRADE
Hello friends
Well, considering the downtrend and the power of the sellers, we should also follow the trend and go to the side of the one who has the power.
Given the price drop, if the price pullbacks, we can see the price drop again.
This post is not a buy or sell offer and is only reviewed from a technical perspective.
Observe risk and capital management and avoid emotional movements.
*Trade safely with us*