Heading into key resistance?Gold (XAU/USD) is rising towards the pivot and could reverse to the 1st support, which acts as an overlap support.
Pivot: 4,221.15
1st Support: 4,027.94
1st Resistance: 4,364.63
Disclaimer:
The opinions given above constitute general market commentary and do not constitute the opinion or advice of IC Markets or any form of personal or investment advice.
Any opinions, news, research, analyses, prices, other information, or links to third-party sites contained on this website are provided on an "as-is" basis, are intended to be informative only, and are not advice, a recommendation, research, a record of our trading prices, an offer of, or solicitation for, a transaction in any financial instrument and thus should not be treated as such. The information provided does not involve any specific investment objectives, financial situation, or needs of any specific person who may receive it. Please be aware that past performance is not a reliable indicator of future performance and/or results. Past performance or forward-looking scenarios based upon the reasonable beliefs of the third-party provider are not a guarantee of future performance. Actual results may differ materially from those anticipated in forward-looking or past performance statements. IC Markets makes no representation or warranty and assumes no liability as to the accuracy or completeness of the information provided, nor any loss arising from any investment based on a recommendation, forecast, or any information supplied by any third party.
Commodities

Gold 30-Min — Volume Sell Reversal Triggered⚡Base : Hanzo Trading Alpha Algorithm
The algorithm calculates volatility displacement vs liquidity recovery, identifying where probability meets imbalance.
It trades only where precision, volume, and manipulation intersect —only logic.
✈️ Technical Reasons
/ Direction — SHORT / Reversal 4155 Area
☄️Bearish rejection confirmed through sharp candle body.
☄️Lower-high forming beneath resistance supply region.
☄️Volume decreasing confirms exhaustion in price rally.
☄️Sellers regained imbalance with heavy top rejection.
☄️Algorithm detects fading demand and shift to control.
⚙️ Hanzo Alpha Trading Protocol
The Alpha Candle defines the day’s real control zone — the first battle of momentum.
From this origin, the Volume Window reveals where the next precision strike begins.
⚙️ Hanzo Volume Window / Map
Window tracked from 10:30 — mapping true market behavior.
POC alignment exposes institutional bias and breakout potential zones.
⚙️ Hanzo Delta Window / Pulse
Delta window monitors real buying vs. selling power behind each move.
Tracks volume aggression to expose who controls the candle — buyers or sellers.
When Delta aligns with Volume Map, momentum becomes undeniable.

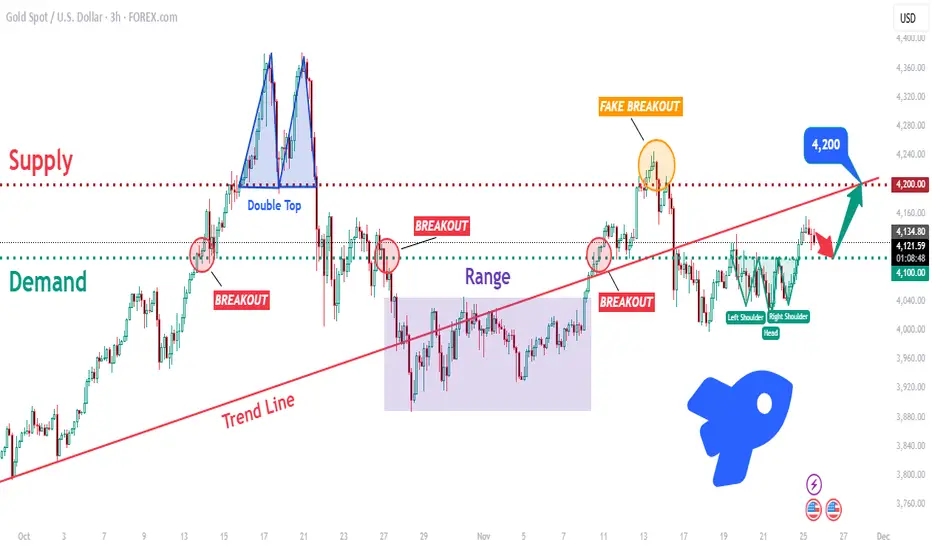
XAUUSD: Bulls Defend 4100! Is a Breakout to 4220 Imminent?Hello traders! XAUUSD continues to trade within a broader bullish structure, but with repeated volatility around key zones. The chart highlights how Gold has reacted multiple times to the major Demand Zone near 4,100, which has consistently acted as a strong support area. Each dip into this zone triggered a bullish response, confirming active buyers. Earlier in the structure, price formed a clear Double Top inside the Supply Zone around 4,220–4,230, which led to a strong bearish reversal and a breakdown below the trend line. After that, Gold entered a prolonged Range Phase, where the market consolidated sideways before breaking out to the upside. Recently, XAUUSD attempted a bullish continuation, but the move resulted in a Fake Breakout above the supply zone, signaling that buyers lacked the strength to maintain momentum above 4,220. This rejection pushed price downward and back below the main Trend Line, which now acts as dynamic resistance.
Currently, Gold is trading above the 4,100 Demand Zone, forming a potential Inverse Head and Shoulders pattern — an early sign that buyers may be preparing for another upward push. As long as price holds above 4,100 and stays above local structure, the bullish scenario remains valid.
My scenario, if XAUUSD holds above the 4,100 Demand Zone, buyers may gain momentum and attempt another breakout toward the 4,200–4,220 Supply Zone, which is the next major resistance and the primary upside target. A sustained break above 4,220 would confirm bullish strength and could open the path toward higher continuation targets. However, if buyers fail to hold the 4,100 level, Gold may drop back into the previous range or retest lower support areas before attempting another reversal. For now, the bias is moderately bullish, supported by demand reactions and reversal patterns — but a confirmed breakout above 4,200 is needed for stronger trend continuation. Manage your risk!
Silver - Parking capital somewhere 'safe'One of the cleaner chart patterns that I can see, which has been playing out for the last 5 years. Over several years the target zone sits at twice the current value.
ETF's like SLV look appealing with general exposure through miners.
Follow the lines.

ANFIBO XAUUSD – Holiday Range or Surprise Breakout? [11.27]Hi guys, Anfibo’s here!
XAUUSD Intraday Trading Plan
Overall Picture
On M30, gold is trading inside a tightening rising structure, with price repeatedly bouncing between local support and descending short-term resistance. Liquidity is thin due to the holiday period, so the market is compressing in a narrow range instead of showing a clear trend.
Key things on the chart:
Upper trendline + horizontal resistance around 4170–4175 is acting as a sell zone.
Local supports are stacked around 4143 – 4136, with a major liquidity pocket / demand zone near 4110 labeled “Strong Liquidity”.
Because of low volume and mixed flows, the safest approach is to trade the edges or wait for a clean breakout of this range.
On the macro side, USD is correcting as markets price in a more dovish Fed path, while Thanksgiving liquidity is thin. According to ING, recent USD moves are more about rate expectations than geopolitics, and the low-liquidity environment can also invite occasional volatility spikes, especially in pairs like USD/JPY. All of this supports a choppy, indecisive environment for gold in the short term.
Trading Plan – Fade the Edges, Respect the Range
We’ll work with two tactical setups:
a sell from resistance and a buy from deep liquidity support.
>>> Scenario #1 – SELL from 4173 Resistance Zone
If price drifts back into the upper boundary and reacts bearishly, I’ll look for short setups:
Sell entry: 4173 – 4175
Stop loss: 4180
Take profit levels:
TP1: 4162
TP2: 4150
TP3: 4122
TP4: 4110 (strong liquidity / demand)
Idea: fade the holiday squeeze into resistance, targeting a move back toward mid-range support and eventually the liquidity zone at 4110 if downside extends.
>>> Scenario #2 – BUY from the Strong Liquidity Zone
If price flushes down into the 4110 area and shows strong rejection, I’ll switch to a buy-the-dip plan:
Buy entry: 4110 – 4112
Stop loss: 4104
Take profit levels:
TP1: 4133
TP2: 4150
TP3: 4172
TP4: 4190 (if market breaks above the current range)
Idea: participate in a liquidity grab at the bottom of the structure, aiming for a bounce back into the core of the range and potentially a breakout if volume returns.
Key Intraday Levels to Watch
Resistance / Sell zone: 4167 – 4175
Mid-range supports: 4143 – 4136
Major liquidity support: 4110 – 4112
A clean break and hold outside this band would signal the next directional move; until then, this is a range market.
Risk Management
Holiday liquidity can be tricky – avoid over-leveraging and keep positions smaller than usual.
Wait for clear rejection or confirmation at planned levels; avoid trading in the noisy middle of the range.
Maintain Risk:Reward ≥ 1:2 for both buy and sell setups.
Do not hold both directions simultaneously; follow the scenario that price confirms first.
If price breaks and holds beyond your SL zone (above 4180 or below 4104), close the idea and reassess instead of forcing re-entries.
Conclusion
Gold is stuck in a narrow holiday range, squeezed between resistance near 4175 and liquidity support around 4110. With USD adjusting to softer Fed expectations and volumes thin, the best edge comes from patiently trading the extremes or standing aside until price finally breaks out.
TRADE THE EDGES, RESPECT THE RANGE, AND LET THE MARKET SHOW ITS HAND, GUYS!

DeGRAM | GOLD is expecting a slight pullback📊 Technical Analysis
● XAU/USD is repeatedly rejecting the descending resistance line and the 4,155–4,170 supply zone, signalling weakening bullish momentum at a key confluence area.
● Failure to hold above the resistance-area retest suggests a likely drop toward 4,110, followed by a deeper move toward 4,058 as the rising structure loses strength.
💡 Fundamental Analysis
● Gold is softening as U.S. yields stabilize and risk appetite improves, reducing short-term safe-haven demand.
✨ Summary
● Bearish bias below 4,170. Targets: 4,110 → 4,058. Resistance: 4,170.
-------------------
Share your opinion in the comments and support the idea with a like. Thanks for your support!
XAU/USD – Gold Builds a Bullish StructureXAU/USD – Gold Builds a Bullish Structure but Awaits a Clear Breakout Confirmation
Gold continues to develop a well-defined bullish structure on the H1 timeframe, characterized by a sequence of higher lows and steady upward momentum. However, price is still capped below a key resistance zone, forming a short-term range that could lead to a breakout or a corrective pullback before continuation.
This analysis focuses on the most important price zones, market behavior, and actionable strategies for today’s session.
1. Market Structure Analysis
Gold maintains a higher-low structure, showing that buyers remain in control despite the sideways consolidation. The recent rejection from the upper resistance and the projected correction (illustrated on your chart) are consistent with typical bullish continuation patterns.
Key observations:
Price is forming a bullish swing-high, swing-low sequence.
The structure remains valid as long as the market holds above the mid-range support zone.
EMA 9 is moving upward and aligning with price pullbacks, confirming short-term bullish momentum.
2. Key Support and Resistance Levels
Major Resistance Zone
4,175 – 4,182
This is the ceiling of the current range and the zone price must break to unlock higher bullish targets.
Mid-Range Support
4,125 – 4,135
This zone has acted as a base of multiple bullish rejections, and the projected corrective wave is likely to retest this area before any attempt at upside continuation.
Major Demand Zone
4,050 – 4,070
This is the deeper structure support, holding the origin of the most recent bullish impulse. A revisit here would be a high-probability long setup if the market produces bullish confirmation.
3. EMA and Momentum Behavior
EMA 9 is trending upward, indicating short-term bullish strength.
Price staying above this EMA generally signals continuation toward the resistance zone.
A clean break and retest of EMA 9 would strengthen the bullish case.
4. Fibonacci Confluence
Applying Fibonacci from the last swing low to the swing high:
38.2% retracement aligns with the mid-range support (4,130 area).
61.8% retracement aligns with the deeper structure (4,080 area).
These zones add strong confluence to the buy-side strategy.
5. Trading Strategies for Today
Scenario 1: Long Setup After Pullback (Preferred Strategy)
Conditions: Price corrects to 4,125 – 4,135 and forms bullish rejection.
Entry: 4,128 – 4,135
Stop Loss: below 4,115
Take Profit 1: 4,165
Take Profit 2: 4,180
This aligns with the projected corrective movement on the chart.
Scenario 2: Breakout Long Above Resistance
Conditions: A full H1 candle closes above 4,182.
Entry: on retest of 4,175 – 4,182
Stop Loss: below 4,160
Take Profit: 4,210 – 4,225
Breakout traders should wait for confirmation to avoid false breakouts.
Scenario 3: Short-Term Intraday Sell (Countertrend)
Conditions: Price rejects strongly again from 4,175 – 4,182.
Entry: 4,175 – 4,180
Stop Loss: above 4,185
Take Profit: 4,135
This countertrend setup is only valid when price shows strong rejection signals.
6. Conclusion
Gold is currently consolidating within a bullish structure and is likely to complete a corrective move before pushing higher. The key zones to watch today are 4,130 for intraday buy opportunities and 4,182 for a breakout continuation.

Gold H1 - Can Gold reject 4167 and fall to 4133 today?🟡 XAUUSD – Intraday Smart Money Plan | by Ryan_TitanTrader (27/11)
📈 Market Context
Gold is trading inside an intraday consolidation after a strong H1 displacement. The session is now primed for liquidity engineering before the next leg.
Key narrative drivers traders must respect today:
• Stronger USD expectations continue to shape risk sentiment
• Institutional desks frequently exploit sweep zones during consolidation
• Range-bound conditions favor fakeouts → displacement → expansion mechanics
• Headlines around U.S. monetary tone amplify intraday volatility
The current chart highlights balanced liquidity both above and below structure, supporting a two-way SMC playbook.
🔎 Technical Framework – Smart Money Structure (H1)
Market is holding a rising channel, but internally ranging — a typical liquidity map scenario:
• Buy-side liquidity pocket: 4180 → 4182 (premium extreme)
• Sell-side liquidity pool: 4110 → 4133 (discount extreme / origin zone)
• Internal equilibrium zone: 4150–4170 chop region (no-trade area)
We expect this sequence:
Sweep → CHoCH/BOS → Displacement → Retest → Expansion.
🎯 Trade Plans for Today
🔴SELL GOLD 4180–4182 | SL 4190
Thesis: Premium liquidity sweep above local highs before downside displacement.
Activation rules:
• Price sweeps 4182 liquidity
• Bearish CHoCH/MSS + BOS down on M5–M15
• Imbalance retest / FVG entry after structure break
Targets:
• 4167 (nearest reaction)
• 4150 (equilibrium raid)
• 4135–4133 (discount retest)
🟢 BUY GOLD 4135–4133 | SL 4125
Thesis: Sell-side liquidity sweep into the origin zone before upside impulse.
Activation rules:
• Price taps 4133 pool (sweep below structure)
• Bullish CHoCH/MSS + BOS up on M5–M15
• FVG fill / bullish rejection wick confirmation
Targets:
• 4155+
• 4167 (reclaim zone)
• 4180+ (premium raid target)
⚠️ Risk Management
• Do NOT trade inside 4150–4170 without clear displacement
• Wait for CHoCH + BOS before execution
• Treat the upper and lower zones as liquidity traps, not trend entries
• Reduce size during news spikes unless structure confirms
• SL = wave invalidation, no averaging in chop
📝 Summary
Gold is in accumulation/redistribution mode. Desks may:
• Run buy-side liquidity at 4182, then displace down → retest discount
or
• Sweep sell-side liquidity at 4133, confirm CHoCH up → expand with impulse
Today is a liquidity session, not early trend chasing. Execute only after confirmation.
📍 Follow @Ryan_TitanTrader for daily Smart Money updates.

GBPUSD: sales from resistance🛠 Technical Analysis: On the 4-hour timeframe, GBPUSD remains strictly within a descending channel, confirming a strong downtrend. The chart highlights a "Global bearish signal", where Moving Averages have crossed downwards, acting as dynamic resistance that pushes the price lower. Currently, the price is testing a confluence area formed by the upper trendline and the key resistance zone around 1.3150 – 1.3200. The technical setup suggests a rejection from this level, followed by a bearish impulse breaking through the local support at 1.3000 and continuing towards the lower boundary of the channel.
🌍 Fundamental Analysis: The British Pound remains vulnerable due to the divergence in monetary policy expectations between the Bank of England and the Federal Reserve. For the US Dollar, the focus this week is on high-impact data, specifically the US GDP revision and the PCE Price Index (inflation data). If these reports come out stronger than expected, it will reinforce the "higher for longer" narrative for US rates, putting heavy pressure on GBP. Additionally, traders should be cautious of potential volatility or lower liquidity as markets approach the US Thanksgiving holiday.
📉 Trade Parameters (SELL):
Entry Point: Sell around the resistance zone 1.3150 – 1.3180 (watch for rejection candles).
Take Profit: Break of the local support at 1.3000 (the first target). Down to the channel low at 1.2750 (the second target).
Stop Loss: Above the upper resistance block, around 1.3250.
⚠️ Disclaimer: This is a potential trade idea based on current analysis; market conditions and price direction are subject to change based on news factors and volatility.

NZDUSD: bearish channel rejection🛠 Technical Analysis: On the 4-hour timeframe, NZDUSD is trending strictly within a descending channel and is currently rejecting off the key resistance zone near 0.5700. A "Global bearish signal" is highlighted where the Moving Averages have crossed downwards, confirming strong institutional selling pressure. The technical structure suggests a continuation of the decline toward the channel support at 0.5545, provided the price does not close back above the immediate resistance block.
🌍 Fundamental Analysis: The New Zealand Dollar faces downward pressure as markets position themselves for the US GDP data release scheduled for this week (Nov 26), which is expected to drive significant USD volatility. Investors are favoring the US Dollar due to resilient economic growth expectations compared to the softer outlook for the New Zealand economy. This divergence creates a fundamental backdrop that supports the technical bearish trend, with liquidity likely to focus on further downside.
❗️ Trade Parameters (SELL) ❗️
➡️ Entry Point: Sell on rejection from the Resistance Zone (approx. 0.5690 – 0.5700)
🎯 Take Profit: 0.55445 (Support Zone)
🔴 Stop Loss: Above the resistance structure (0.57371)
⚠️ Disclaimer: This is a potential trade idea based on current analysis; market conditions and price direction are subject to change based on news factors and volatility.

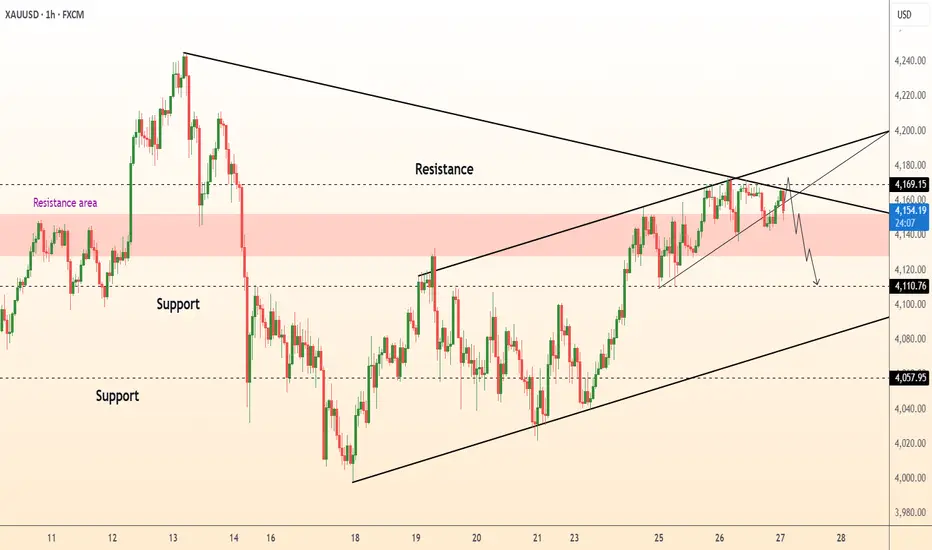
XAUUSD: symmetrical triangle breakdown🛠 Technical Analysis: On the 4-hour timeframe, Gold (XAUUSD) is consolidating within a large symmetrical triangle, indicating a massive volatility squeeze. The price is currently testing the upper boundary but shows signs of rejection, with the projected path pointing to a bearish breakout below the ascending support line. A confirmed close below the triangle structure would validate the bearish momentum, targeting the immediate support zone at 3,913 and potentially extending to the medium-term target of 3,700.
🌍 Fundamental Analysis: Market activity is heavily influenced by the upcoming US Thanksgiving holiday (Thursday, Nov 27), leading to thinning liquidity and potential erratic moves. Traders are bracing for the "pre-holiday data dump" this Wednesday, including Initial Jobless Claims and Durable Goods Orders. Strong US economic data could reinforce the Dollar's strength, further pressuring Gold to break downside before the market close.
❗️ Trade Parameters (SELL) ❗️
➡️ Entry Point: Sell on confirmed breakdown of triangle support (approx. 4,140 – 4,150)
🎯 Take Profit: 3,913, medium-term target at 3,700
🔴 Stop Loss: Above the recent resistance structure (approx. 4,255)
⚠️ Disclaimer: This is a potential trade idea based on current analysis; market conditions and price direction are subject to change based on news factors and volatility.

GOLD (XAUUSD): Bullish Continuation
There is a high probability that Gold will continue rising
after a confirmed breakout of a key intraday/daily resistance cluster.
Expect a move up at least to 4205
❤️Please, support my work with like, thank you!❤️
I am part of Trade Nation's Influencer program and receive a monthly fee for using their TradingView charts in my analysis.

XAUUSD – H1 uptrend channel, short-term downside risk increasingXAUUSD – H1 uptrend channel, short-term downside risk increasing Brian – Prioritize short selling at the channel peak, wait to buy back at lower support
I. Strategy Summary Gold is trading in an uptrend channel on H1, but the rise around 4.160 shows signs of weakening, increasing short-term correction risk.
Preferred Scenario: Short sell at the channel peak 4.162–4.164, targeting support areas 4.145 – 4.130 – 4.115 – 4.100.
After the correction, the 4.100–4.080 area may become the foundation for the next rise in the larger trend.
Important price areas to watch: 4.139 – 4.127 – 4.110 – 4.088.
II. Macro Context & News 27/11
02:00 – Fed releases Beige Book This document updates the Fed branches' assessment of the US economic situation.
Describing slower growth, cooling price pressures will further reinforce expectations that the Fed will soon cut interest rates → supporting gold.
Conversely, if the Beige Book describes the economy as still “resilient,” the market may temporarily slow down pricing in rate cuts → causing a short-term adjustment for gold.
19:30 – ECB releases October meeting minutes
If the minutes lean towards the scenario of keeping high interest rates longer, the EUR may be supported, indirectly affecting the USD and gold inflows.
However, the impact is usually not as strong as US data, mainly affecting the overall risk-on/risk-off sentiment.
General Context: Gold has surpassed 4.160 USD/oz as the market increasingly expects the Fed to cut interest rates as early as December, reducing the appeal of interest-bearing assets and increasing the allure of gold – a non-yielding asset. This creates a support foundation for the medium-term uptrend, but after a hot rise, technical adjustments on H1 are normal.
III. Technical Structure – H1 uptrend channel
The price is within the H1 uptrend channel, with rising peaks and troughs, but the upper area near 4.160 coincides with:
The upper boundary of the price channel. The “Sell POC” area on the chart – where liquidity and sell orders are concentrated.
Preferred scenario on the chart: The price may slightly rebound to the POC area 4.162–4.164, then be rejected and slide to the important support area around 4.110 before extending the adjustment down to 4.100–4.080.
The lower trendline of the uptrend channel also acts as a short-term buy area if a clear candle reaction appears.
Notable price areas on H1: Resistance: 4.162–4.164 (channel peak + POC). Intermediate support: 4.139 – 4.127 – 4.110. Deep support: 4.088 – 4.080 – 4.100 (area that may form the bottom for the next rise).
IV. Trading Plan 1. Preferred Scenario – Short sell at the channel peak Idea: Short sell when the price rebounds to the upper boundary of the H1 uptrend channel and POC 4.162–4.164, expecting a correction to support.
Sell: 4.162–4.164 SL: 4.168 TP targets: TP1: 4.145 TP2: 4.130 TP3: 4.115 TP4: 4.100
This is a counter-move order in the uptrend channel, only targeting a short-term correction, not a major trend reversal scenario.
2. Supplementary Scenario – Short buy at support trendline Idea: When the price hits the lower trendline of the H1 uptrend channel and a nice candle reaction appears, consider a short-term buy according to the channel, prioritizing areas:
4.139 – 4.127 – 4.110 – 4.088
Specific Entry/SL levels will depend on the actual price reaction at the trendline, but the general principle:
Buy close to the trendline,
SL placed below the immediate support area,
TP aimed at the middle of the channel or the nearest resistance.
V. Risk Management & Notes
Do not open new positions right before or at the time of the Beige Book and ECB minutes release, as volatility may suddenly increase, widening spreads.
The sell order at 4.162–4.164 is a short-term counter-trend order in the uptrend channel, requiring moderate volume and strict adherence to SL 4.168.
If the price clearly breaks and holds above the 4.170 area, the H1 correction scenario weakens – in that case, stay out, wait for a new structure instead of trying to maintain a sell view.

Stop!Loss|Market View: EURUSD🙌 Stop!Loss team welcomes you❗️
In this post, we're going to talk about the near-term outlook for the EURUSD currency pair☝️
Potential trade setup:
🔔Entry level: 1.16465
💰TP: 1.15347
⛔️SL: 1.16985
"Market View" - a brief analysis of trading instruments, covering the most important aspects of the FOREX market.
👇 In the comments 👇 you can type the trading instrument you'd like to analyze, and we'll talk about it in our next posts.
💬 Description: The euro price failed to breakout 1.15000, nor even approach it as we expected at the beginning of the week. Today, we're likely to see further short-term growth toward 1.16600, from where selling could again be considered. However, if we're accumulating a short position over the medium term, we could consider conservative selling from current levels. A more global target near 1.14000 remains.
Thanks for your support 🚀
Profits for all ✅

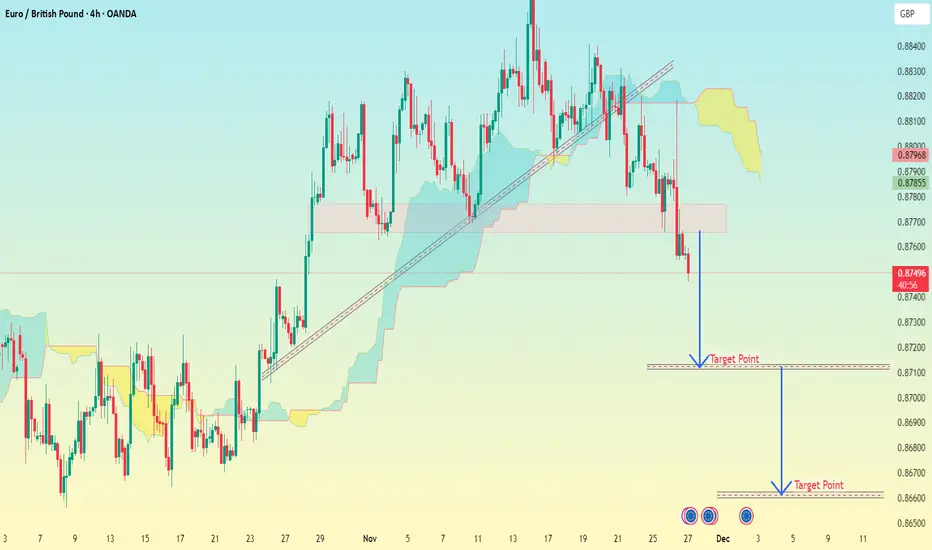
EUR/GBP 4H Chart Pattern.EUR/GBP short targets based on My chart (4H timeframe):
EUR/GBP – Sell Targets
Price right now is near 0.8750 and clearly breaking below support.
✅ Target 1 (Short-Term): 0.8710 – 0.8705
This aligns with my first horizontal marked zone.
✅ Target 2 (Main / Mid-Term): 0.8655 – 0.8645
This matches your second target zone at the bottom.
Bonus Levels (If momentum stays strong):
0.8625
0.8600
Stop-Loss Suggestion
Above broken support zone: 0.8785 – 0.8795
Quick Summary
Trend: Bearish
Bias: Sell on pullbacks
TP1: 0.8710
TP2: 0.8655
BTC/USD (1H Timeframe) ...📌 BTC/USD (1H Timeframe) – Target Analysis
My chart shows:
Price moving above an ascending trendline
Price breaking above the Ichimoku cloud
A clean space above for an upward move
This setup indicates bullish continuation.
---
🎯 BTC Target (Based on my Chart)
✔ Main Target
$91,500 – $92,000
This matches the “Target Point” my marked and is a valid resistance zone based on the chart structure.
---
📈 Why This Target Is Valid
Price is holding above my trendline support
Price has broken out of the cloud, indicating bullish momentum
No major resistance between $87,500 → $91,500
---
📌 Suggested Trade Plan
Entry: Already near breakout zone ($87,000 – $87,600)
Stop-Loss: Below trendline / cloud → $85,800 – $86,200
Take Profit: $91,500 – $92,000

GBP/JPY – 1H Chart Pattern..📊 GBP/JPY – 1H Professional Technical Analysis
MY chart shows:
A long rising trendline
Price recently rejected near 207.00
Price is pulling back toward the trendline
I have already marked two potential “Target Points” on the chart
Ichimoku cloud is forming support but price is weakening
This looks like a potential corrective decline toward structure support.
---
🎯 Targets Based on my Chart & Structure
TARGET 1 — Shallow Pullback (Trendline Re-test)
➤ 205.80 – 206.00
Why:
Matches the first target marked on my chart
Trendline retest + top edge of your highlighted zone
Strong structural support
---
TARGET 2 — Break of Trendline → Deeper Correction
➤ 205.00 – 205.20
Why:
I have this drawn on my chart
This is the first major horizontal support below the trendline
Also aligns with Kijun + prior consolidation base
Good liquidity zone
---
TARGET 3 — Full Breakdown Objective (Major Target)
➤ 203.20 – 203.50
Why:
This matches the lowest "Target Point" my marked
This is the cleanest imbalance + untouched demand zone
If trendline fully breaks and momentum accelerates down
Strong area for institutional liquidity sweep
---
📌 Summary Table
Target Price Zone Reason
Target 1 205.80 – 206.00 Trendline retest
Target 2 205.00 – 205.20 First major support zone
Target 3 203.20 – 203.50 Deep correction / demand zone
---
🛑 Invalidation (Bullish Defend Zone)
If GBP/JPY breaks back above 206.90–207.10, the downside idea weakens and a re-test of highs becomes more likely.

GBP/USD – 4H Chart PatterN..📊 GBP/USD – 4H Professional Technical Breakdown
1. Market Structure
Price has broken a long-term descending trendline.
A clean bullish breakout from a multi-week consolidation zone.
Ichimoku cloud has turned bullish, with price far above the Kumo → strong momentum.
2. Momentum
Current candle expansion shows impulsive bullish orderflow.
No visible resistance until significantly higher → market is in “airspace.”
---
🎯 Professional Target Zones (Educational Technical Levels)
Target 1 – Nearest Logical Upside
➤ 1.3300 – 1.3330 (Short-term liquidity target)
Why?
Minor imbalance fill
Psych level 1.3300
Closest resistance cluster
---
Target 2 – Momentum Continuation
➤ 1.3370 – 1.3400
Why?
Past structural turning point
Round number magnet
Matches previous volume node on 4H
---
Target 3 – Major Resistance Zone (my chart’s “Target Point”)
➤ 1.3450 – 1.3500
Why?
Strong historical resistance
Weekly supply zone
Follows the projection shown in my chart (blue arrow target)
---
Target 4 – Extended Bullish Objective (If momentum remains extremely strong)
➤ 1.3600 – 1.3650 (Advanced target)
Why?
Weekly imbalance above
Completion of breakout structure
Expanding Ichimoku projection supports this distance
---
🛑 Invalidation / Risk Levels
These help understand where the upside idea weakens:
Key invalidation zone (support)
➤ 1.3180 – 1.3200
Re-entry into the old consolidation box would weaken the bullish continuation idea.
📌 Summary (Professional Format)
Level Type Notes
1.3300–1.3330 Target 1 First liquidity zone
1.3370–1.3400 Target 2 Momentum continuation
1.3450–1.3500 Target 3 (Major) Matches my chart target
1.3600–1.3650 Extended Target Only if trend continues
1.3180–1.3200 Invalidation Break below = weakens bullish bias

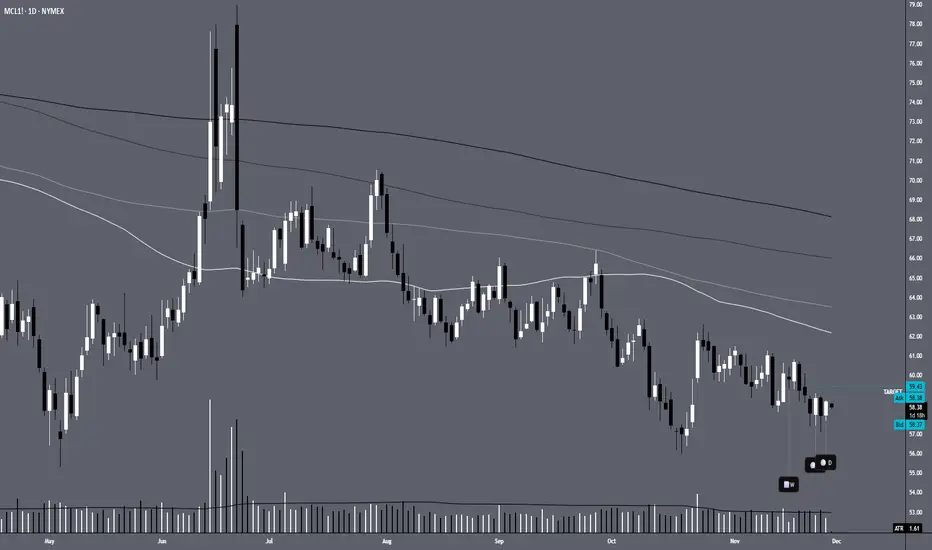
MCL1!Price is currently underneath the quarter's mark. Testing a support zone. Price could retest the November resistance zone.
Gold prices traded in a narrow range today.Gold maintained its consolidation pattern, with the New York market rebounding after testing lower levels. On the daily chart, the closing price in New York has remained above the 10-day, 7-day, and 5-day moving averages for three consecutive trading days, with the price hovering around the upper Bollinger Band. The RSI indicator is above the midline. Short-term 4-hour and 1-hour charts show an upward trend, with the price moving along the upper Bollinger Band. However, the converging moving averages haven't yet led to increased volume or a sustained breakout. With the US market closed early today for Thanksgiving, the market is expected to continue its consolidation.
Overall, the market remains slightly bullish. On the weekly chart, the price has found solid support at the 10-day moving average. The daily chart also shows a tendency to form a triangle pattern, with short-term resistance around 4180-85. Also note that the US market is closed early today for Thanksgiving, so market activity will not be very high!
Key levels:
First support level: 4153, Second support level: 4140, Third support level: 4132
First resistance level: 4180, Second resistance level: 4196, Third resistance level: 4208
Gold intraday trading strategy:
Buy: 4140-4145, SL: 4130, TP: 4160-4170;
Sell: 4195-4200, SL: 4210, TP: 4180-4170;

Gold Is Preparing for Its Next Major BreakoutHello everyone,
Looking at the chart — and combining it with how fast macro signals are shifting — gold feels like a machine that’s just been recharged. In only two sessions, the price surged more than 120 USD even while the US Dollar Index stayed above 100. That’s a very clear sign that capital is choosing gold before the Fed makes any move.
The market is now pricing in nearly an 83% chance that the Fed will cut rates by 0.25% on 10 December. This is no longer a vague expectation. Fed officials like Waller and Williams have softened their tone, signalling willingness to support cuts if the data doesn’t run too hot. When expected interest rates fall, gold essentially steps onto a “fast lane”: lower holding costs and stronger inflows from both defensive and speculative money.
That’s why I’m leaning toward one scenario: gold continues to rise. If the price pulls back to 4,140–4,130 or even 4,120, I see these moves as healthy retracements — not signs of reversal. Once buying pressure returns, I expect gold to break above 4,160, move toward 4,200, and potentially expand into the 4,230–4,250 USD/oz region.
What about you? Are you waiting for a pullback or planning to trade the breakout?

Natural Gas: The Rally Continues!!Technical Analysis & Order Flow
1. Natural Gas (NATGAS) - The Primary
Weekly/Daily: Price has broken out of a multi-year base. The strong impulse candles suggest institutional buying. We are likely in Level 3 of a standard Market Maker cycle (the trending phase).
4H Structure: Price is making clear Higher Highs and Higher Lows. The recent pause at 4.437 is a Bullish Consolidation (Time Correction).
Liquidity: There is "clean" buy-side liquidity above 4.500. A break of this level will likely trigger a gamma squeeze to 4.800.
Order Block: The 4.350 level represents a key Bullish Order Block (previous resistance turned support) on the 1H chart. We want to see price wick into this zone and reject lower prices.
2. DXY (US Dollar) - The Inverse Indicator
Analysis: DXY is currently testing a major resistance zone at 100.20 – 100.50 (Blue Box on your chart).
Trigger: If DXY rejects this level and drops toward 99.00, it provides a massive tailwind for Commodities (incl. NatGas of course).
Caution: A DXY 4H candle close above 100.50 would invalidate the immediate bullish momentum for Gas.
3. Peabody Energy (BTU) - The Correlation (Coal/Energy Sector)
Analysis: BTU is lagging behind the Gas rally but is finding support at the 26.00 level.
Signal: We watch for BTU to break above 26.50. If Coal starts rallying, it confirms the broader "Energy Sector" bid, adding confidence to the Nat.Gas long.
Execution Strategy
Monday Open: Gap open likely! We don't chase the gap up if it opens above 4.500.
The "Trap": We watch for a False Move (Stop Hunt) lower during the London session (approx. 3:00 AM - 5:00 AM ET) down into the 4.380 area.
Entry Trigger: We enter long when we see a 15m bullish engulfing candle or a W-Pattern forming inside the 4.350-4.380 zone.
Trade Management :
We move Stop Loss to BE once price clears 4.500;
Verdicts:
Technical Trend: ✅ Strong Bullish
Seasonality: ✅ Bullish (Winter Heating Demand)
Volume Profile: ✅ Expanding on Up-moves
Trade Probability: High (80%+)

BRENT OIL ANALYSIS - Nov 22 - is this the bottom?BRENT OIL - Weekly Outlook
Current Price: 62.39
Context: At BOTTOM of recent range (61.80-65.00). Bouncing off weekly lows. Range-bound after multi-week decline.
Bias: NEUTRAL-to-BEARISH (range trade until breakout)
TRADE IDEAS FOR NEXT WEEK
SETUP 1: LONG from Support (most current opportunity)
Entry: 62.00-62.50 (preferably after sweep of prev. week's low)
Stop Loss: 61.50
TP1: 63.50 (partial - 40%)
TP2: 64.50 (partial - 40%)
TP3: 65.00 (final - 20%)
Logic: Price at support, oversold on daily. Range trade targeting middle/top of range.
Pros: At support, good R:R, clear levels
Cons: Oil fundamentals weak, could break lower
SETUP 2: SHORT from Resistance (HIGH PROBABILITY)
Entry: 64.50-65.20
Stop Loss: 66.50
TP1: 63.50 (30%)
TP2: 62.00 (40%)
TP3: 60.50 (30%)
Logic: Resistance zone rejection. Range top. Downtrend bias continues.
Pros: High R:R, higher timeframe trend continuation, clear rejection zone
Cons: Need to wait for rally first
KEY LEVELS
Support Zones:
61.80-62.00 ← Weekly low (CRITICAL support - holding NOW)
60.50-61.00 ← Next major support if breakdown
42-45 ← Long-term support
Resistance Zones:
63.00-63.50 ← Immediate resistance
64.50-65.20 ← Weekly high / major resistance
66.50-67.00 ← Next resistance if breakout
