GOLD/ SILVER RATIO - Quarterly FlagBeautiful looking quarterly flag present on the gold silver ratio, should this break down, which would be likely to play out over the next 12-18 months (at most) then expect much higher silver prices.
I would expect to see the ratio hit between 50-30 should this flag pattern materialize.
Commodities

USOIL FREE SIGNAL|SHORT|
✅WTI OIL is returning into the higher-timeframe supply after clearing buy-side liquidity, signaling distribution. If rejection confirms, bearish displacement could drive price toward the sell-side liquidity target below.
—————————
Entry: 58.70$
Stop Loss: 59.00$
Take Profit: 58.12$
Time Frame: 3H
—————————
SHORT🔥
✅Like and subscribe to never miss a new idea!✅

GOLD Free Signal! Buy!
Hello,Traders!
GOLD has reacted from the horizontal demand after sweeping sell-side liquidity, suggesting early accumulation. If bullish intent holds, SMC order-flow favors a move toward the next buy-side liquidity above.
--------------------
Stop Loss: 4,134$
Take Profit: 4,202$
Entry Level: 4,161$
Time Frame: 3H
--------------------
Buy!
Comment and subscribe to help us grow!
Check out other forecasts below too!
Disclosure: I am part of Trade Nation's Influencer program and receive a monthly fee for using their TradingView charts in my analysis.

WTI Crude Holds at Its Lowest Levels of the YearWTI crude oil continues to show a steady bearish bias below the 60-dollar area in the short term. For now, selling pressure has remained firm, while recent comments regarding the military conflict between Ukraine and Russia point to an increase in reinforcements aimed at achieving a possible ceasefire. Such a scenario could reduce the economic sanctions currently imposed on Russia and, over time, become an important factor that drives a stronger-than-expected recovery in global crude production. This backdrop has kept confidence in the price of the barrel limited, reinforcing a persistent bearish tone that could continue if an official ceasefire is eventually reached.
Medium-Term Trend Remains Firm:
During the second half of the year, the prevailing bearish movements in WTI have maintained a perspective aligned with a solid medium-term downward trendline. So far, no meaningful buying corrections have appeared that could threaten this bearish structure in recent weeks, making it likely that this formation will continue to dominate most price movements in the medium term—especially if the market continues to trade below the 50-period simple moving average.
Neutrality Begins to Emerge in Indicators:
At the moment, both the RSI line and the MACD histogram remain oscillating within the neutral range of their respective indicators. This suggests that, in the short term, both the average selling and buying impulses and the directional strength of the moving averages remain in a neutral and indecisive zone, which can partly be explained by the price interacting with important support areas. What matters here is that as long as both indicators maintain this neutral stance, they could open the door for potential bullish corrections to develop in the coming sessions.
Key Levels to Watch:
60 dollars: This is the main resistance on the chart, aligned with the current downward trendline, the barrier marked by the 50-period moving average, and the 23.6% Fibonacci retracement level. Buying moves that manage to break above this area could trigger a break of the bearish trend, potentially activating a more constructive bullish tone.
58 dollars: This level corresponds to the most recent zone of indecision and could become the reference area to monitor if bullish corrections begin to form within current price movements.
57 dollars: This marks the lowest level of the year and stands as the most relevant bearish barrier at the moment. Selling moves that break below this level could open the door to a more aggressive bearish bias, extending the current downward trend even further.
Written by Julian Pineda, CFA, CMT - Market Analyst

Gold Market at turning point | target inside The Gold is running in the bullish trend, it can change the direction into the bearish when the price touch 4189 to 4211, then the price can fall till 4157.
If price breaks 4223, it can fly till 4247, if the price respects 4189 to 4211, it can give us more pips and we can see a big drop.
What's your idea about it.

XAGUSD H1 | Bullish Bounce Off Key SupportMomentum: Bullish
Price is currently above the ichimoku cloud.
Buy entry: 50,608
- Strong pullback support
- 50% Fib retracement
- 100% Fib projection
- Fair Value Gap
Stop Loss: 49.634
- Swing low support
Take Profit: 51.631
- Multi-swing high resistance
High Risk Investment Warning
Stratos Markets Limited (tradu.com/uk ), Stratos Europe Ltd (tradu.com/eu ):
CFDs are complex instruments and come with a high risk of losing money rapidly due to leverage. 70% of retail investor accounts lose money when trading CFDs with this provider. You should consider whether you understand how CFDs work and whether you can afford to take the high risk of losing your money.
Stratos Global LLC (tradu.com/en ): Losses can exceed deposits.
Please be advised that the information presented on TradingView is provided to Tradu (‘Company’, ‘we’) by a third-party provider (‘TFA Global Pte Ltd’). Please be reminded that you are solely responsible for the trading decisions on your account. Any information and/or content is intended entirely for research, educational and informational purposes only and does not constitute investment or consultation advice or investment strategy. The information is not tailored to the investment needs of any specific person and therefore does not involve a consideration of any of the investment objectives, financial situation or needs of any viewer that may receive it. Past performance is not a reliable indicator of future results. Actual results may differ materially from those anticipated in forward-looking or past performance statements. We assume no liability as to the accuracy or completeness of any of the information and/or content provided herein and the Company cannot be held responsible for any omission, mistake nor for any loss or damage including without limitation to any loss of profit which may arise from reliance on any information supplied by TFA Global Pte Ltd.

ANFIBO XAUUSD – Elliott Wave Pullback or Continuation? [11.26]Gold XAUUSD – Elliott Wave Pullback or Continuation?
Hi guys, Anfibo’s here!
XAUUSD Short-Term Trading Plan
Overall Picture
On H1, gold is still trading inside a rising channel, but price has just completed a potential 5-wave impulsive leg into the upper boundary of the structure. From here, we’ve got short-term bearish confirmation around the 4147 area, suggesting that price may be entering an ABC corrective phase within the channel.
In other words:
Bigger picture: structure remains bullish as long as the channel holds.
Short term: I’m prepared for a corrective drop before the next directional leg.
On the macro side, fresh data show the U.S. is burning around 22B USD per day, with October spending at 688.7B vs 404B in tax revenue. The first month of fiscal year 2026 already printed a record 284.4B deficit, and interest payments alone reached 1.24T over the last 12 months – about 24 cents of every tax dollar going just to service debt.
This kind of fiscal pressure is structurally supportive for gold in the long run, but it doesn’t prevent short-term pullbacks inside the current channel.
Trading Plan – Playing the ABC Correction
I’m focusing on two key zones derived from the Elliott structure:
one for tactical sells from premium prices, and one for buys at the end of the correction.
>>> Scenario #1 – Tactical SELL from the Upper Zone (Short-Term Bearish)
If price retests the short-term bearish confirmation area and fills the upper liquidity zone, I’ll look for sell setups:
Sell entry: 4150 – 4152
Stop loss: 4158
Take profit levels: 4140 – 4133 – 4110 – 4088
Idea: fade the final push into the upper boundary / FVG area, targeting completion of wave A–B–C towards the mid and lower parts of the channel. This is a short-term play against the local high, not a long-term bearish view on gold.
>>> Scenario #2 – BUY the End of Wave C (Continuation with Trend)
If the ABC correction extends into the lower part of the short-term structure and shows bullish reaction, I’ll switch to a buy-the-dip plan:
Buy entry: 4130 – 4133
Stop loss: 4125
Take profit: 4145 – 4160
Idea: buy near the potential end of wave C, in confluence with channel support, for a continuation back toward the upper boundary and possibly a new impulsive leg.
Risk Management
Trade only when price respects one of the planned zones – no chasing in the middle of the range.
Always wait for clear confirmation (rejection wick, market structure shift, or strong reaction) before entering.
Keep risk per trade controlled and aim for Risk:Reward ≥ 1:2.
Do not hold both scenarios in opposite directions at the same time – choose the plan that the market confirms.
If price invalidates the structure (strong break beyond SL without reaction), step aside and reassess the wave count.
Conclusion
Gold is likely moving into an Elliott ABC correction phase inside a still-bullish channel. That gives us room for a tactical short from premium levels and a high-probability dip buy if price completes wave C lower. With macro debt and deficit pressures quietly supporting the long-term bullish case, this week is all about executing clean setups inside structure, not forcing trades.
STAY PATIENT, FOLLOW YOUR PLAN, AND TRADE WITH DISCIPLINE, GUYS! 💛📈

Gold H1 – Liquidity Plays as Hassett Leads Fed Chair Race🟡 XAUUSD – Intraday Smart Money Plan | by Ryan_TitanTrader (26/11)
📈 Market Context
Gold opens the week reacting to fresh political headlines as Kevin Hassett emerges as the frontrunner for Trump’s next Fed Chair.
This matters for gold because:
• A hawkish-leaning Fed Chair pick typically strengthens USD and weighs on gold.
• Markets may price in tighter policy expectations, increasing short-term bearish pressure.
• Political volatility ahead of the official announcement often triggers liquidity grabs on both sides.
With sentiment shifting toward a stronger USD, gold is positioned for classic SMC-style sweeps around key premium and discount zones.
🔎 Technical Analysis (1H – Smart Money Structure)
• Market Structure
Price has tapped into a minor premium zone and is showing early rejection signs.
Below, the 4140–4138 area aligns with intraday demand and the origin of recent displacement.
• Premium Sell Zone (1H Supply)
4210 – 4212
• Sits above current buy-side liquidity
• Clear premium relative to intraday structure
• High-probability sweep zone before any downside displacement
• SL region: 4220 liquidity pocket
• Discount Buy Zone (1H Demand)
4140 – 4138
• Previous CHoCH origin
• Aligns with discount retracement
• Confluence with unmitigated internal demand block
• SL region: 4130 sell-side liquidity
• Liquidity Map
• Buy-side: 4212 → 4220
• Sell-side: 4138 → 4130
Expect the typical SMC sequence:
Sweep → CHoCH → Displacement → Retest → Expansion.
🔴 Sell Setup – Premium Reaction
Entry: 4210 – 4212
Stop-Loss: 4220
Take-Profit:
→ 4160 (reaction level)
→ 4145 (mid-range liquidity)
→ 4140–4138 (discount zone retest)
📌 Only activate after a liquidity sweep + bearish CHoCH on M5–M15.
🟢 Buy Setup – Discount Reaction
Entry: 4140 – 4138
Stop-Loss: 4130
Take-Profit:
→ 4160 (intraday reaction)
→ 4185 (premium edge)
→ 4210 (liquidity sweep target)
📌 Valid only after sell-side sweep + bullish CHoCH.
⚠️ Risk Management Notes
• Headlines around the Fed Chair nomination may create sudden USD strength spikes—wait for structure shifts.
• Avoid trading inside the chop zone 4150–4180 without clear displacement.
• Treat today as a liquidity-driven session, not a directional trend day.
📝 Summary
Gold is rotating between premium and discount zones as markets digest news of Kevin Hassett leading the Fed Chair race, a development that could tilt expectations toward firmer policy.
Institutional players are likely to hunt liquidity above 4210 or below 4140 before committing to direction.
Key Levels Today (26/11)
🔴 Sell Zone: 4210–4212
🟢 Buy Zone: 4140–4138
Prepare for:
Accumulation → Sweep → Displacement → Retest → Target.
📍 Follow @Ryan_TitanTrader for daily Smart Money updates.

Gold (XAUUSD) 15m entry setupGold (XAUUSD) 15m entry setup. Price just confirmed a nice setup in 15m timeframe.
Cheers

GOLD Buyers In Panic! SELL!
My dear friends,
Please, find my technical outlook for GOLD below:
The instrument tests an important psychological level 4150.7
Bias - Bearish
Technical Indicators: Supper Trend gives a precise Bearish signal, while Pivot Point HL predicts price changes and potential reversals in the market.
Target - 4134.3
Recommended Stop Loss - 4160.3
About Used Indicators:
Super-trend indicator is more useful in trending markets where there are clear uptrends and downtrends in price.
Disclosure: I am part of Trade Nation's Influencer program and receive a monthly fee for using their TradingView charts in my analysis.
———————————
WISH YOU ALL LUCK

Market outlook and investment strategy: I am bullish.#XAUUSD TVC:GOLD OANDA:XAUUSD
Judging from the structural trend and the performance of gold in different timeframes, gold has formed a short-term double bottom structure based on the trend line, and the prototype of the W pattern is gradually emerging.
Although the price retreated slightly after touching the channel resistance level around 4160 in the evening, it did not break the current upward structure, and the market is still dominated by bulls. Meanwhile, influenced by multiple positive factors such as geopolitical uncertainties and rising market speculation about a December rate cut, gold still has the potential for further gains.
Therefore, based on the current trend structure and fundamental logic, in the future trading process, we can first pay attention to the short-term resistance of 4170-4180, which is a key resistance under the triangle consolidation pattern. When it first touches this level, we can try to short gold with a small position and set the stop loss above 4185 to prevent the risk of a strong bullish breakout.
Meanwhile, if this strategy is effective, we need to pay attention to the subsequent rebound after the gold price falls back and stabilizes, which will help confirm the completion of the W pattern. At that time, we will focus on the breakout of the neckline at 4200-4205. If it can stabilize above this level, the upside potential will be further opened up, and it may extend to 4240-4245, or even higher!
In summary, our trading strategy must closely follow the confirmation signals of the trend structure. Therefore, it is essential to strictly control position size and stop-loss. We will continue to monitor market dynamics and optimize our trading strategy accordingly.

Gold 30-Min — Volume Buy Reversal Triggered⚡Base : Hanzo Trading Alpha Algorithm
The algorithm calculates volatility displacement vs liquidity recovery, identifying where probability meets imbalance.
It trades only where precision, volume, and manipulation intersect —only logic.
Technical Reasons
/ Direction — LONG / Reversal 4147 Area
☄️Bullish momentum confirmed through strong candle body.
☄️Structure shifted with higher-low near key demand base.
☄️Volume expanding confirms order-flow alignment upward.
☄️Buyers reclaimed imbalance with sustained clean break.
☄️Algorithm detects rising momentum under low liquidity.
⚙️ Hanzo Alpha Trading Protocol
The Alpha Candle defines the day’s real control zone — the first battle of momentum.
From this origin, the Volume Window reveals where the next precision strike begins.
⚙️ Hanzo Volume Window / Map
Window tracked from 10:30 — mapping true market behavior.
POC alignment exposes institutional bias and breakout potential zones.
⚙️ Hanzo Delta Window / Pulse
Delta window monitors real buying vs. selling power behind each move.
Tracks volume aggression to expose who controls the candle — buyers or sellers.
When Delta aligns with Volume Map, momentum becomes undeniable.
Gold Price Poised for Breakout as Bullish Channel StrengthensHi!
Market Structure Overview
Price is moving within a clearly defined ascending channel, forming higher highs and higher lows. The recent pullback corrected only about 35% of the previous bullish leg, indicating that buyers are still in control and momentum remains positive.
Key Support Zone (Green Area 4,150–4,175)
This zone represents a former supply that has now flipped into a potential demand area. Price is currently pushing into it from below, and the reaction here will determine the next major move. A clean break and hold above this zone would signal strength and open the path toward higher targets.
Breakout Scenario
If price breaks above the green resistance block, the chart suggests a bullish continuation toward the major supply zone highlighted in red (4,220). The drawn arrow implies that momentum could accelerate once the breakout confirms, aligning with the channel’s upper boundary.
Upside Target (Red Zone 4,220)
This red area represents a strong supply where sellers previously stepped in aggressively. Should price reach this level again, some form of reaction or correction is likely.
Downside Risk
If the breakout fails and price rejects the green zone, a retracement back toward the mid-channel dashed line or even the lower channel boundary would be the next logical move.
Disclaimer: As part of ThinkMarkets’ Influencer Program, I am sponsored to share and publish their charts in my analysis.

XAU/USD | Gold Holds Strong and Targets Higher Levels!By analyzing the 4 hour chart for TVC:GOLD , we can see that after the bullish move earlier today, price dipped to $4040 but immediately bounced as demand stepped in. Gold is now trading around $4091.
If this momentum continues, I expect a push toward $4100, $4110, and $4130. After that, we’ll monitor the reaction around the levels mentioned in the previous analysis. The overall structure remains bullish as long as demand stays active.
Please support me with your likes and comments to motivate me to share more analysis with you and share your opinion about the possible trend of this chart with me !
Best Regards , Arman Shaban

XAUUSD: November 26 Market Analysis and StrategyGold Technical Analysis:
Daily Resistance: 4210, Support: 4000
4-Hour Resistance: 4180, Support: 4110
1-Hour Resistance: 4170, Support: 4145
The weekly chart continues to show an upward trend, with 4040 being a key support level. The daily chart, influenced by fundamentals, formed a doji candlestick, but structurally, this hasn't affected the short-term bullish expectation. The Bollinger Bands are widening upwards, and the moving average support is gradually moving higher. The next key level to watch is 4200. Long-term holders can wait for the Fed's rate cut decision before buying. The ideal long-term entry point for gold remains below 4000, while short-term traders can still follow the trend and look for further gains.
Looking at the 1-hour chart, gold continued its upward trend during the European session. The Bollinger Bands are trending upwards, and the candlestick pattern is within an upward channel. Resistance is seen around 4180, with further resistance at 4200. Support is seen around 4150-4145.
Trading Strategy:
BUY: 4145-4150
More Analysis →

XAUUSD: Buyers Aiming for a Rebound Toward $4,170 ResistanceHello everyone, here is my breakdown of the current Gold setup.
Market Analysis
XAUUSD continues to trade within a corrective structure, forming a broad Triangle Pattern defined by the Triangle Resistance Line above and the Triangle Support Line below. After a strong impulsive rally earlier, gold entered a prolonged consolidation phase, highlighted by a clear Range Zone where price repeatedly tested both the upper and lower boundaries without establishing a directional breakout. Several Breakouts occurred during this period, but each bullish attempt failed to secure continuation, leading to pullbacks that kept the market inside the broader consolidation. This showed clear indecision and a balanced battle between buyers and sellers.
Currently, gold retested the Support Zone around $4,040–$4,060, which coincides with the Triangle Support Line. A fake breakdown occurred below this level, but the market quickly bounced back, confirming strong demand and rejecting the bearish attempt. This rebound signals that buyers are actively defending the structure. Price is now stabilizing above support and showing early signs of bullish pressure. If buyers maintain control, the next logical target becomes the major Resistance Level at $4,170, which has acted as a key cap on previous bullish attempts. As long as XAUUSD stays above the Support Zone and trades within the rising trendline structure, the overall market bias remains moderately bullish.
Scenario & Strategy
I expect gold to gradually move upward from the current support area and retest the $4,170 Resistance Level. Minor corrections may occur along the way, but as long as price holds above $4,040, the bullish scenario remains valid. A clean breakout above $4,170 could trigger a stronger bullish continuation toward the next supply zone.
However, a breakdown below the Support Zone and Triangle Support Line would invalidate the bullish scenario and open the way for deeper correction. For now, buying the dips remains the more favorable approach as long as gold respects demand and stays within the triangle structure.
That's the setup I'm tracking. Thank you for your attention, and always manage your risk.

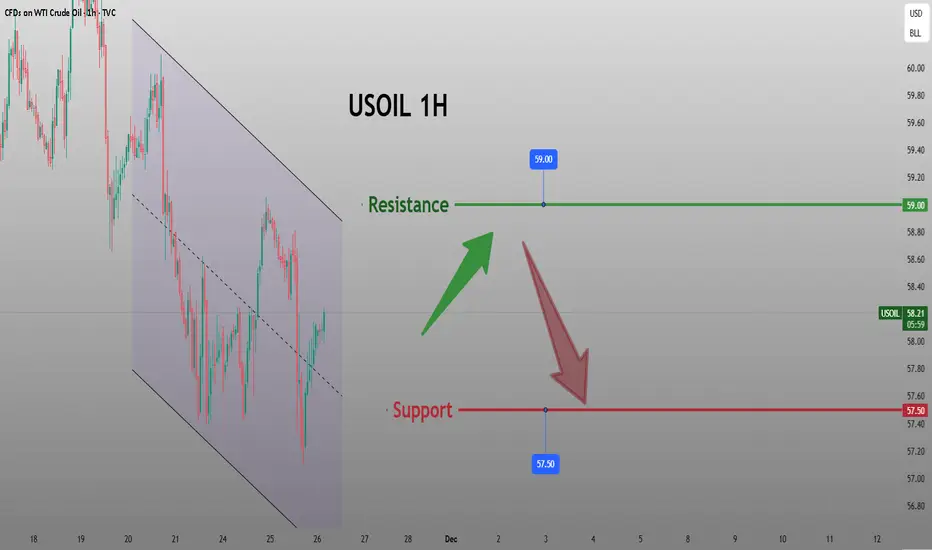
Analysis of Core Factors in the Short-Term Oil MarketSupply Side: The oversupply situation has become a consensus, and the geo-political support has failed
- Global supply remains consistently tight: The OPEC report in November adjusted the global oil situation to be in an oversupply state. The current daily production exceeds demand by 500,000 barrels, while the previous month's estimate was a shortage of 400,000 barrels. The IEA has continuously raised the expected global crude oil supply surplus for six consecutive months, and it is predicted that in 2026, there will be a record-breaking surplus of nearly 4 million barrels per day. At the same time, the supply increase in the United States is significant. As of the week of November 21, the total number of oil drilling rigs in the United States increased to 419. The Trump administration also plans to open new drilling areas in the west coast and the Arctic. Additionally, although OPEC+ has suspended production increases in the first quarter of next year, the overall supply growth trend remains strong, making it difficult to change the oversupply situation.
- Geopolitical risks have marginally eased: There have been signals of peace talks in the Ukraine conflict. US officials stated that Ukraine has agreed to the terms of the peace agreement, with only some details yet to be finalized. Zelensky expects to "as soon as possible" visit the United States to advance the agreement. This news has weakened the geopolitical risk premium for oil. Although Russian refineries and export ports have been attacked multiple times recently, Russia can buffer through methods such as temporary storage in floating tanks, and the short-term export pressure is limited, making it difficult to have a substantive impact on supply.
Crude Oil Strategy Analysis
sell:58.5-59
tp:58-57.5
sl:59.5
GOLD BEARS ARE STRONG HERE|SHORT
GOLD SIGNAL
Trade Direction: short
Entry Level: 4,167.31
Target Level: 3,975.91
Stop Loss: 4,294.65
RISK PROFILE
Risk level: medium
Suggested risk: 1%
Timeframe: 12h
Disclosure: I am part of Trade Nation's Influencer program and receive a monthly fee for using their TradingView charts in my analysis.
✅LIKE AND COMMENT MY IDEAS✅

Gold Reload Zone… Bulls Waiting Patiently!📈Gold remains overall bullish, respecting both its rising structure and the major support zones beneath current price. After breaking above the light-blue resistance area, XAUUSD is now pushing higher, but a pullback remains very likely before the next impulse.
⚔️On the upcoming retest of the blue structure zone and the rising trendline, we will be looking for trend-following longs. This area has acted as support multiple times and now aligns with the bullish context, making it a high-probability buy zone.
🏹As long as Gold remains above the red demand area and respects the rising structure, the next wave upward toward the 4,385 resistance remains the most likely scenario. Only a clean break below the red zone would weaken the bullish outlook.
For now, patience is key… wait for the retest, then look for longs from structure. 🤔
⚠️ Disclaimer: This is not financial advice. Always do your own research and manage risk properly.
📚 Stick to your trading plan regarding entries, risk, and management.
Good luck! 🍀
All Strategies Are Good; If Managed Properly!
~Richard Nasr

Xauusd Fvg- Order Block- BosFVG, BOS, and the Order Block are all lining up — everything we need for a high-quality setup. On the H1 it looks great right now. It still looks valid, but there’s a chance price won’t retrace deep enough today.
If price moves upward and takes the high before coming back to our entry zone, then we cancel the setup and wait for a new opportunity.

XAUUSD - Bulls Still Stepping In at Demand… Watching the Retest!Gold remains overall bullish, holding firmly above the major support zone around $4,000–$4,050. This entire red area has been acting as a strong demand zone for weeks, with price bouncing from it multiple times, a clear sign that buyers are defending this level aggressively.
📈XAUUSD is also respecting the rising trendline , forming a clean higher-low structure. As long as Gold remains above both the trendline and the support zone, the bullish outlook stays intact. I will be looking for long setups on the next retest of this confluence area.
🏹If buyers step in again, the next move could push toward the previous highs near $4,385. But if price breaks below the support zone and the trendline, the bullish structure would weaken and open the door for a deeper correction.
For now, this zone is the key. Will Gold bounce again… or finally break through support? 🤔
⚠️ Disclaimer: This is not financial advice. Always do your own research and manage risk properly.
📚 Stick to your trading plan regarding entries, risk, and management.
Good luck! 🍀
All Strategies Are Good; If Managed Properly!
~Richard Nasr

GOLD TOP - Short Now or Forever Hold Your Piece...If you don’t know when to get out, don’t get in. And right now, it’s pretty clear it’s time to step aside.
People keep acting like gold is independent, but if you don’t see how closely it moves with the stock market, then you’re missing how the liquidity side of this works. When liquidity dries up, everything feels it.
Rates look ready to push hard, and most people aren’t even factoring that in. AriasWave already laid out why this is happening and where it leads. It’ll make sense when the pieces line up.
If you want the deeper breakdown, let me know and I’m happy to post about it.
Stay tuned for the full market breakdown video where I show you just how correlated gold is with the stock markets and what that pattern means.
Also, check out the reversal pattern for gold on the weekly chart... if you can tell me what Steve Nison would call the reversal pattern then I will mention your name in the next video.

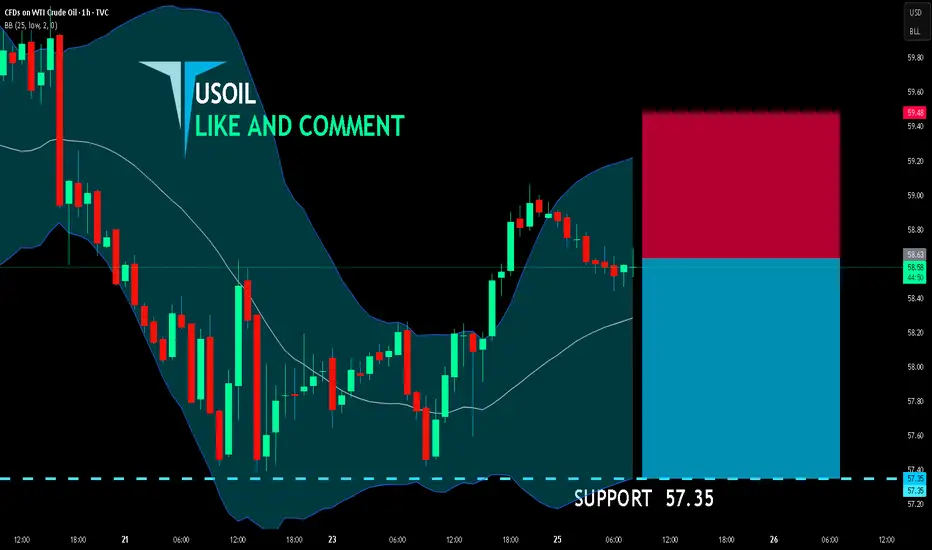
USOIL BEARS ARE GAINING STRENGTH|SHORT
USOIL SIGNAL
Trade Direction: short
Entry Level: 58.63
Target Level: 57.35
Stop Loss: 59.48
RISK PROFILE
Risk level: medium
Suggested risk: 1%
Timeframe: 1h
Disclosure: I am part of Trade Nation's Influencer program and receive a monthly fee for using their TradingView charts in my analysis.
✅LIKE AND COMMENT MY IDEAS✅