How to trade in a range-bound market?Gold remains in a wide-range trading pattern, with the daily chart closing with another doji candlestick. This pattern suggests continued range-bound trading. Today's strategy is to buy low and sell high, as there is still room and demand for further declines. The key resistance level to watch today is around $4098; sell on rallies near this level.
Gold maintains its wide-range trading structure. The daily/weekly charts show a tug-of-war between bulls and bears, with moving averages converging and the price hovering around the middle Bollinger Band. Gold will soon face a directional decision. From a technical perspective, after rebounding to the $4110 high and encountering resistance, gold has fallen again in a stepped pattern, and this area remains a significant resistance zone.
Key Levels:
First Support: 4040, Second Support: 4023, Third Support: 4004
First Resistance: 4090, Second Resistance: 4108, Third Resistance: 4130
Gold Intraday Trading Strategy:
BUY: 4026-4031, SL: 4010, TP: 4050-4060;
SELL: 4095-4100, SL: 4115, TP: 4080-4070;
More Analysis →
Commodities
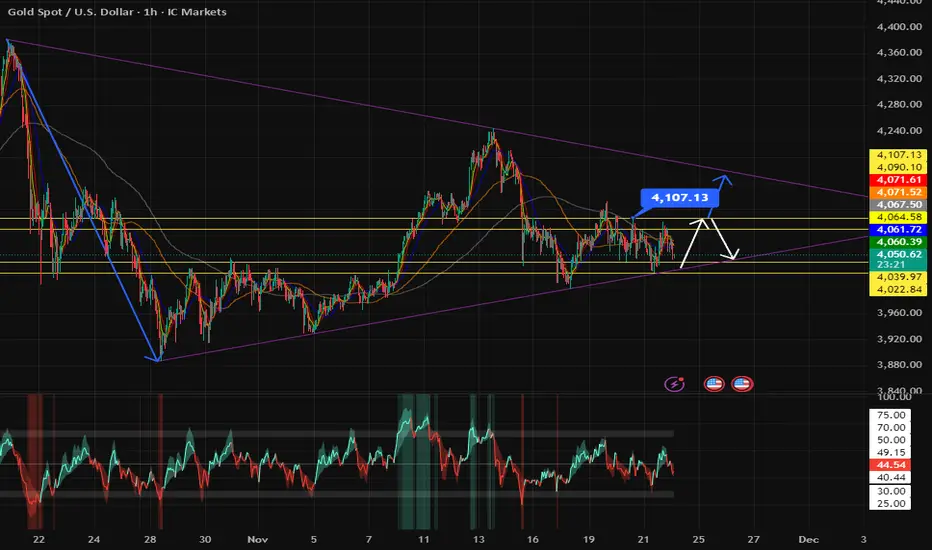
XAUUSD – Reading the Market’s Secret Intentions🌐 MARKET CONTEXT
Gold begins the new week with compressed volatility yet maintains a bearish overall structure on H1. Price continues forming Lower Highs → Lower Lows, suggesting Smart Money is still distributing at premium zones while accumulating at deep discount pools.
Current Market Drivers
USD strength remains stable → keeping gold under pressure
Market awaits midweek USD data → early sessions may be liquidity-driven
Institutional flows show no strong bullish commitment yet
Bias for the day:
🔻 Bearish until price reclaims key premium zones with a valid CHoCH.
🔺 BUY setups valid only at deep discount liquidity pools (3996, 4030).
📉 TECHNICAL ANALYSIS (Liquidity + SMC Structure)
Market Structure
H1 Trend: Bearish
Key premium zone above: 4146–4148
Mid-range equilibrium: 4060–4080
Discount demand clusters: 4030 & 3994
Liquidity Observation
Buy-Side Liquidity (BSL):
Above 4146
Above 4071 liquidity wick
Sell-Side Liquidity (SSL):
Below 4030
Below 3994 (major liquidity pocket)
Imbalances / FVG
Strong bearish FVG at 4146–4148
Minor imbalance at 4068–4071
Clear discount imbalance at 4032–4030
Deep liquidity vacuum near 3996–3994
🔑 KEY PRICE ZONES (Clear, Compelling Explanations)
1️⃣ 4148–4146 → Premium Liquidity Trap – Main SELL Zone
This zone contains:
Unmitigated H1 Supply Zone
Heavy BSL resting above recent swing highs
Major bearish FVG fill
➡️ A classic liquidity-engineered premium trap where Smart Money sweeps breakout buyers before reversing aggressively.
2️⃣ 4068–4071 → Mid-Range Liquidity Sweep – SCALP SELL Zone
Features:
Clusters of intraday stops from earlier longs
A small FVG acting as inducement
Positioned near equilibrium → perfect for fakeouts
➡️ Expect quick wicks and sharp rejections, ideal for short, high-precision scalps.
3️⃣ 4032–4030 → Discount Reaction – SCALP BUY Zone
This area offers:
Clean SSL located just beneath
Micro Demand Zone
A common reversal point during bearish cycles
➡️ Excellent for fast BUY scalps with tight risk, especially during London manipulation.
4️⃣ 3996–3994 → Deep Discount Reversal – GOLD BUY Zone
A high-value accumulation zone:
Contains significant higher-timeframe SSL
Aligns with deep-discount structure
Frequently used by Smart Money to reload long positions
➡️ If price taps this zone, a strong bullish rebound is very likely.
⚙️ TRADE SETUPS (High Precision Entries)
✔️ SELL GOLD – Main Premium Short
Entry: 4148–4146
Stoploss: 4154
TP1: 4120
TP2: 4080
TP3: 4030
Logic: BSL sweep → FVG mitigation → bearish displacement.
✔️ SELL SCALP – Mid-Range Sweep
Entry: 4068–4071
Stoploss: 4077
TP1: 4050
TP2: 4038
Logic: Engineered liquidity → immediate rejection expected.
✔️ BUY SCALP – Discount Liquidity Reaction
Entry: 4032–4030
Stoploss: 4024
TP1: 4045
TP2: 4068
Logic: SSL sweep → CHoCH likelihood → intraday rebound.
✔️ BUY GOLD – Deep Discount Long
Entry: 3996–3994
Stoploss: 3988
TP1: 4020
TP2: 4060
TP3: 4140
Logic: Strong institutional accumulation zone → potential formation of H1 higher low.
🧠 SESSION NOTES
Avoid trading mid-range to reduce chop exposure.
Best moves form after liquidity sweeps in London or during NY displacement.
Confirm entries with M5/M15 CHoCH + displacement.
Never buy inside premium zones; never sell inside deep discount zones.
🏁 CONCLUSION
Gold maintains a bearish structure, favoring SELL setups at premium liquidity traps 4146–4148 and 4068–4071.
BUY setups remain valid only at strong discount zones 4030 and 3994, where liquidity supports a clean bullish reaction.
Let liquidity form the trap. Then strike with precision.

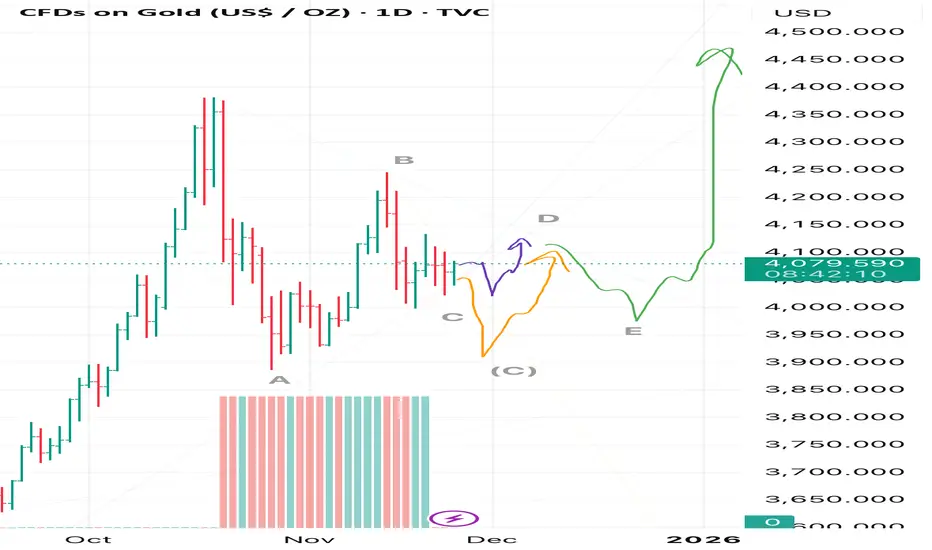
Gold — ABCDE Triangle Formation With Bullish Breakout AheadIn my view, gold is forming a corrective ABCDE triangle with an expected breakout to the upside🚀
At the moment, wave C is either still developing or it is almost completed, and wave D may soon begin. I marked these two scenarios with orange🟠and purple🟣 arrows respectively.
However, I also do not rule out the possibility that this structure may turn out to be a flat ABC correction rather than a triangle, as I currently expect.
In that case, price should first move according to the orange scenario.
After the correction completes, I expect price to follow the green path, taking gold above its recent all-time high🌱
And between us — I personally expect gold to eventually reach above 8000 😱
But for now, let’s patiently wait for this current structure to finish forming.
💬Share your thoughts in the comments:
Do you think wave C is already complete, or will gold dip lower according to the orange path?
I’m curious to hear your view.
GOLD: Rate-Cut Odds Hit 74% — Breakout Coming?FX:XAUUSD bounced from the 4043 support zone, maintaining moderate volatility as markets await a packed week of U.S. economic data alongside rising geopolitical uncertainty. Traders remain focused on the 4030–4113 trading range.
The probability of a December Fed rate cut has increased to 74% following comments from New York Fed President John Williams.
On the geopolitical front, any signal of de-escalation in the Russia–Ukraine conflict may trigger corrective pressure on the metal.
Key Events to Watch This Week
~ U.S. PPI & Retail Sales
~ Q3 GDP & Core PCE Index
~ Existing & New Home Sales
Gold remains highly sensitive to Fed communication and geopolitical developments.
Stronger U.S. data could reduce easing expectations, while rising rate-cut odds continue to limit the downside.
A decisive breakout is likely after inflation and GDP figures.
Technical Outlook
Gold maintains bearish momentum while trading below 4087, targeting 4059, and then 4043.
However, price may retest the resistance zone at 4099–4113 before resuming a bearish move.
A 15-minute close above 4087 will support a push toward 4099 → 4113.
Key Levels
Pivot Line: 4087
Support: 4059 · 4043 · 4030
Resistance: 4099 · 4113 · 4133

Silver oversold bounce testing resistance at 5033The Silver remains in a bullish trend, with recent price action showing signs of a corrective pullback within the broader uptrend.
Support Zone: 4845 – a key level from previous consolidation. Price is currently testing or approaching this level.
A bullish rebound from 4845 would confirm ongoing upside momentum, with potential targets at:
5033 – initial resistance
5108 – psychological and structural level
5214 – extended resistance on the longer-term chart
Bearish Scenario:
A confirmed break and daily close below 4845 would weaken the bullish outlook and suggest deeper downside risk toward:
4780 – minor support
4740 – stronger support and potential demand zone
Outlook:
Bullish bias remains intact while the Silver holds above 4845. A sustained break below this level could shift momentum to the downside in the short term.
This communication is for informational purposes only and should not be viewed as any form of recommendation as to a particular course of action or as investment advice. It is not intended as an offer or solicitation for the purchase or sale of any financial instrument or as an official confirmation of any transaction. Opinions, estimates and assumptions expressed herein are made as of the date of this communication and are subject to change without notice. This communication has been prepared based upon information, including market prices, data and other information, believed to be reliable; however, Trade Nation does not warrant its completeness or accuracy. All market prices and market data contained in or attached to this communication are indicative and subject to change without notice.

Gold retest of 4110 resistanceThe Gold remains in a bullish trend, with recent price action showing signs of a corrective pullback within the broader uptrend.
Support Zone: 4009 – a key level from previous consolidation. Price is currently testing or approaching this level.
A bullish rebound from 4009 would confirm ongoing upside momentum, with potential targets at:
4110 – initial resistance
4150 – psychological and structural level
4220 – extended resistance on the longer-term chart
Bearish Scenario:
A confirmed break and daily close below 4009 would weaken the bullish outlook and suggest deeper downside risk toward:
3975 – minor support
3933 – stronger support and potential demand zone
Outlook:
Bullish bias remains intact while the Gold holds above 4009. A sustained break below this level could shift momentum to the downside in the short term.
This communication is for informational purposes only and should not be viewed as any form of recommendation as to a particular course of action or as investment advice. It is not intended as an offer or solicitation for the purchase or sale of any financial instrument or as an official confirmation of any transaction. Opinions, estimates and assumptions expressed herein are made as of the date of this communication and are subject to change without notice. This communication has been prepared based upon information, including market prices, data and other information, believed to be reliable; however, Trade Nation does not warrant its completeness or accuracy. All market prices and market data contained in or attached to this communication are indicative and subject to change without notice.

Will Gold Reack To Changing FED Expectations?After the last week's speech by New York FED chair Williams, rate cut expectation pricing surge to 60% from 30%. I plan to bet on possible upward reaction to of gold for the short term.

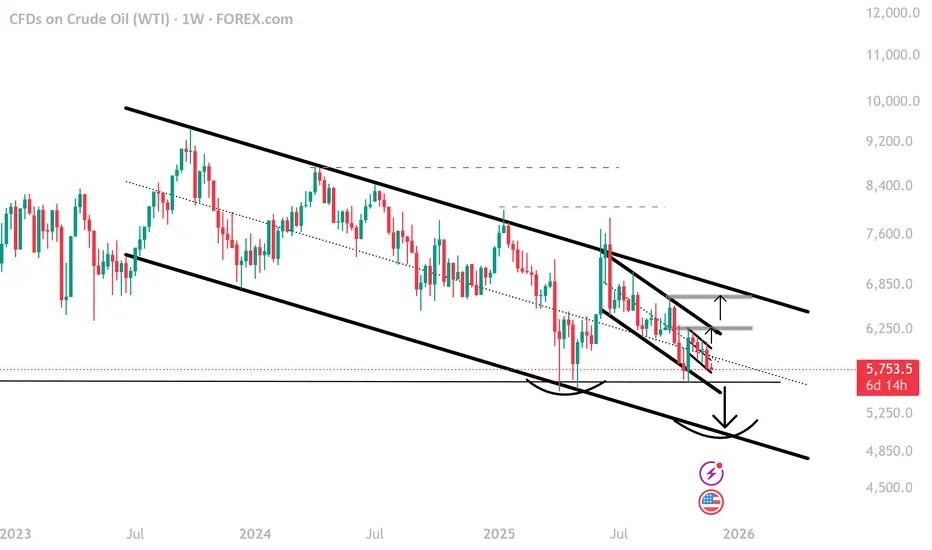
US OilCrude Oil
- Order Block
- Falling Wedge as an corrective pattern in Long Time Frame
- RSI -Divergence
- Demand Zone
- Completed " 1234 " Impulsive Waves

WTI Oil Market Outlook: Sell Zones & Key LevelsOil is still respecting a broader downtrend structure with consistent lower highs and lower lows. Price recently reacted from the $62–63 resistance zone (trendline + supply) confirming another lower high and maintaining bearish momentum. As long as oil stays below this zone the chart suggests a continuation toward the downside with next supports sitting near $56.30, $52.50 and potentially $50.00 if bearish pressure accelerates.
Only a clean breakout above $63 with strong candles would invalidate this bearish outlook and shift momentum toward the $66–70 zone.
🔻 Sell Setup 1
- Entry Zone: 62.00 – 63.00
- Stop Loss: 63.80
- Targets: TP1 59.00, TP2 56.30, TP3 52.50
🔻 Sell Setup 2
- Entry: Break below 57.50 and retest
- Stop Loss: 59.20
- Targets: TP1 56.30, TP2 52.50, TP3 50.00
Note
Please risk management in trading is a Key so use your money accordingly. If you like the idea then please like and boost. Thank you and Good Luck!

Gold 30-Min — Volume Buy Reversal Triggered⚡Base : Hanzo Trading Alpha Algorithm
The algorithm calculates volatility displacement vs liquidity recovery, identifying where probability meets imbalance.
It trades only where precision, volume, and manipulation intersect —only logic.
✈️ Technical Reasons
/ Direction — LONG / Reversal 4060 Area
☄️Bullish momentum confirmed through strong candle body.
☄️Structure shifted with higher-low near key demand base.
☄️Volume expanding confirms order-flow alignment upward.
☄️Buyers reclaimed imbalance with sustained clean break.
☄️Algorithm detects rising momentum under low liquidity.
⚙️ Hanzo Alpha Trading Protocol
The Alpha Candle defines the day’s real control zone — the first battle of momentum.
From this origin, the Volume Window reveals where the next precision strike begins.
⚙️ Hanzo Volume Window / Map
Window tracked from 10:30 — mapping true market behavior.
POC alignment exposes institutional bias and breakout potential zones.
⚙️ Hanzo Delta Window / Pulse
Delta window monitors real buying vs. selling power behind each move.
Tracks volume aggression to expose who controls the candle — buyers or sellers.
When Delta aligns with Volume Map, momentum becomes undeniable.

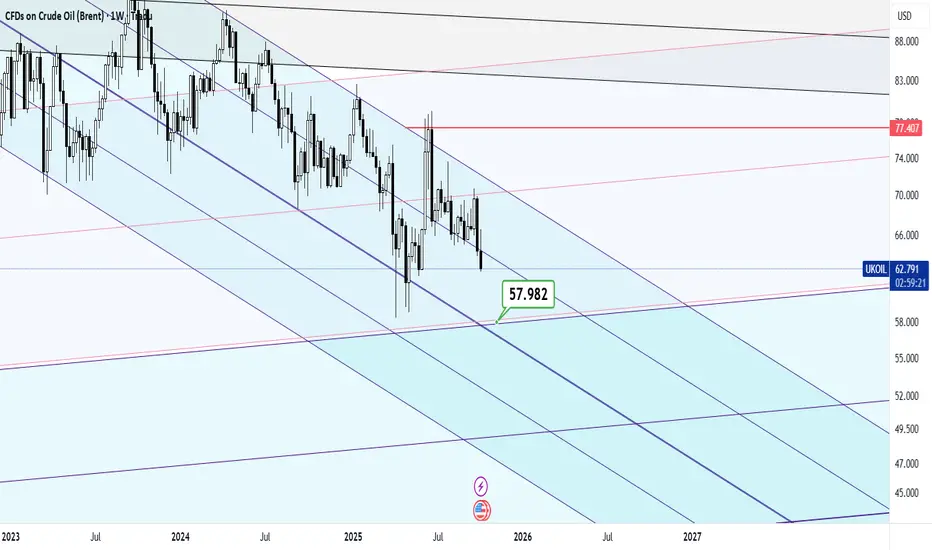
Crude Falls with Market Sentiment, Key Levels StandFrom a weekly perspective, the overall outlook on crude remains within a dominant downtrend since 2023, with a shorter-term trend forming from June 2025, currently stabilizing above the $55 per barrel mark.
Scenarios:
• Upside: Climbing back above the upper bound of the short-term channel (June–November 2025) and above the $63 mark could open the way for a retest of the upper boundary of the broader downtrending channel that has been in place since December 2023, near $66, before confirming a structured bullish breakout.
• Downside: A drop below the lower boundary of the six-month channel and the $55 yearly low is expected to extend losses toward the bottom of the original downtrend channel near $49, where another bullish rebound could emerge.
The borders of the December 2023–November 2025 channel remain dominant in defining crude’s next major directional move.
Written by Razan Hilal, CMT
GOLD What Next? BUY!
My dear subscribers,
This is my opinion on the GOLD next move:
The instrument tests an important psychological level 4066.7
Bias - Bullish
Technical Indicators: Supper Trend gives a precise Bullish signal, while Pivot Point HL predicts price changes and potential reversals in the market.
Target - 4082.3
My Stop Loss - 4057.6
About Used Indicators:
On the subsequent day, trading above the pivot point is thought to indicate ongoing bullish sentiment, while trading below the pivot point indicates bearish sentiment.
Disclosure: I am part of Trade Nation's Influencer program and receive a monthly fee for using their TradingView charts in my analysis.
———————————
WISH YOU ALL LUCK

Crude oil: Weak ConsolidationToday, crude oil is trading with a weak oscillatory bias, fluctuating narrowly within the 57 - 58 per barrel range. The softened geopolitical risks have set the tone for the subdued market sentiment, while the technical landscape remains dominated by bears.
Key Levels:
Support Zones:Immediate support is concentrated around 57.0 – 57.4 per barrel, with notable buying interest emerging near 57.6. A breakdown below this zone could pave the way for a test of 56.0 per barrel, potentially extending to the vicinity of the annual low around the same level.
Resistance Levels:Near-term resistance lies around 58.75 per barrel, where some trading strategies suggest initiating short positions. Further resistance is seen at the 59.0 – 60.0 per barrel range; only a decisive breakout above this interval can alleviate the short-term bearish momentum. For a full trend reversal, a breach of the long-term key resistance at 61.44 per barrel is required.

ALPH/USDT has just triggered ALPH/USDT has just triggered a massive multi-month falling wedge breakout (a powerful bullish reversal pattern) after respecting the lower trendline for over 200 days, exploding +167% in a single daily candle and clearing the upper resistance with extreme volume. This textbook setup ends the entire 2025 bear market and projects a measured move to the 161.8%–200% extension zone around $0.45–$0.55+, with the breakout confirming the start of a new parabolic bull cycle for Alephium. Former wedge resistance now flips to strong support near $0.12–$0.14; any retest should be viewed as a generational buying opportunity. 🚀🔥📈💥💰

SILVER BEARS ARE STRONG HERE|SHORT
SILVER SIGNAL
Trade Direction: short
Entry Level: 4,992.1
Target Level: 4,536.3
Stop Loss: 5,296.0
RISK PROFILE
Risk level: medium
Suggested risk: 1%
Timeframe: 1D
Disclosure: I am part of Trade Nation's Influencer program and receive a monthly fee for using their TradingView charts in my analysis.
✅LIKE AND COMMENT MY IDEAS✅

GOLD market after “Fed fever”, growth momentum is challengedOANDA:XAUUSD prices remain in the spotlight as the market has been experiencing a series of strong fluctuations following mixed signals from the Federal Reserve and labor data. However, developments show that the risk of price declines is increasing as the precious metal has repeatedly failed in its efforts to hold the $4,100/ounce area, the first resistance level of this year's hot period.
For most of 2025, gold has risen more than 55%, despite high bond yields and a strong dollar. But as the Fed’s final policy meeting approaches and the market lacks consensus on the path of interest rate cuts, the traditional correlation between gold, interest rates, and the dollar is returning. According to CME’s FedWatch, the market still expects a more than 70% chance of the Fed cutting interest rates next month, while economists maintain a more cautious assessment of only about 50/50.
This puts the upcoming economic data in a decisive position for both market expectations and gold’s stability in this trading week.
Fed’s Dovish Return: A Direct Impact on Gold’s Upward Momentum OANDA:XAUUSD
Gold settled in the first half of the week as demand for havens increased, while the ADP report showed that the private sector cut an average of 2,500 jobs per week in the four weeks to November 1.
The 4,000 USD/ounce level continues to be the key threshold determining the short-term trend, as the market is moving within a correction zone but has not yet broken the medium-term bullish structure.
Technical analysis and suggestions OANDA:XAUUSD
1. Price Structure & Overall Trend
• Price is still within the ascending channel that has extended since August, although the range has narrowed compared to October. The October peak around 4,128 USD acts as a major medium-term resistance.
• The current decline is still only a pullback within the uptrend, as long as price holds above 3,972 USD (Fib 0.382) and especially the 4,000 USD psychological & technical support.
2. Key Technical Zones
• Nearest resistance: 4,128 – 4,216 USD
(A strong resistance cluster where price has been repeatedly rejected in November.)
• Nearest support: 4,055 – 4,000 USD
(This zone aligns with Fib 0.382 and the short-term bottom.)
• Deeper supports:
3,846 USD (Fib 0.5) – Important for a deep pullback scenario
3,720 USD (Fib 0.618) – Reaction support in case of strong macro volatility
3. Price Momentum – RSI
• RSI has moved out of oversold territory but remains weak and has not re-established a bullish structure.
• The RSI-MA21 is flat → the market lacks strong momentum; sideways movement or a retest of the 4,000 USD zone is highly likely.
4. Short-Term Outlook (Next Week)
• Market bias: Neutral to slightly bearish, but the medium-term uptrend remains intact.
• Price is likely to retest 4,000 USD, then form one of two scenarios:
o Hold 4,000 → rebound to 4,128 – 4,216 USD
o Break 4,000 → drop to 3,972 – 3,846 USD
👉 Conclusion: 4,000 USD is the decisive level for the short-term trend.
BUY XAUUSD PRICE 4102 - 4100⚡️
↠↠ Stop Loss 4106
→Take Profit 1 4094
↨
→Take Profit 2 4088
SELL XAUUSD PRICE 4016 - 4018⚡️
↠↠ Stop Loss 4012
→Take Profit 1 4024
↨
→Take Profit 2 4030

Rising 10_Yields Ahead?Here’s How It Could Hit BTC, Gold, StocksWhy the US 10-Year Yield Matters
The US 10-Year Treasury yield is one of the most important benchmarks in global finance. It reflects investor expectations for inflation, growth, and Federal Reserve policy. Because it influences everything from mortgage rates to equity valuations and the strength of the US dollar( TVC:DXY ), understanding its direction helps traders anticipate major market shifts.
Key Scenarios to Watch
1. Yield Rising (Bullish Yield / Bearish Bonds)
Signals stronger economic expectations or sticky inflation.
Usually pushes the USD higher and puts pressure on risk assets like tech stocks and crypto.
Markets begin pricing fewer rate cuts or even potential tightening.
2. Yield Falling (Bearish Yield / Bullish Bonds)
Indicates rising recession risk, softer inflation, or expectations of Fed rate cuts.
Supports equity markets and risk assets (including crypto).
Typically weakens the US dollar.
3. Sideways / Stable Range
Suggests economic uncertainty or balanced expectations.
Markets remain in consolidation until new macro data or Fed signals arrive.
Why Traders Follow It:
Small moves in the 10-year yield can shift global liquidity, risk sentiment, and currency flows — making it a core indicator for forecasting market direction.
Given the current data and signals, my short-term forecast is for yields to remain flat or move slightly higher, but the likelihood of a significant decline in the near term seems slim.
-----------------------------------------------------
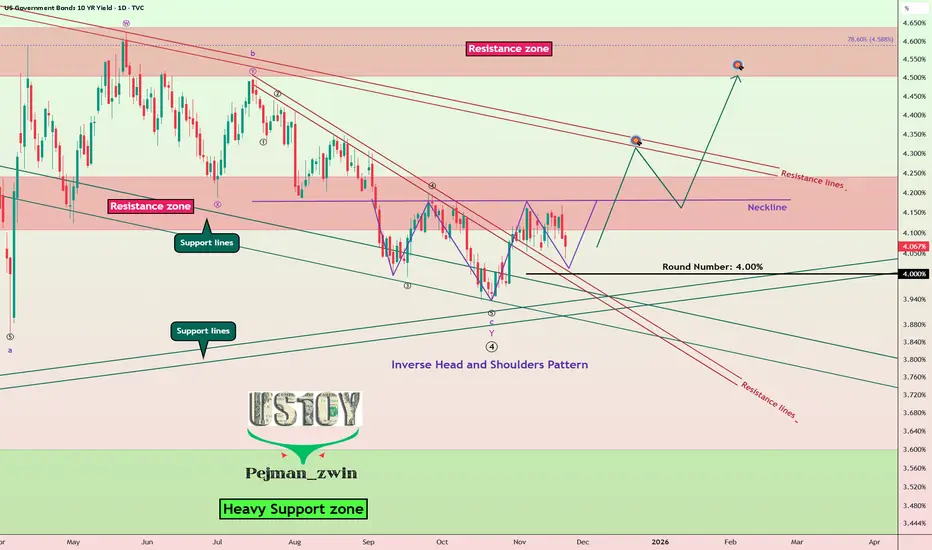
Now let's take a look at the US 10-Year Government Bond Yield chart on the daily time frame.
The US 10-Year Government Bond Yield is currently moving near the support lines and the 4.00% (Round Number).
In terms of classic technical analysis, we can expect that the US 10-Year Government Bond Yield's uptrend could start with an Inverse Head and Shoulders Pattern.
In terms of Elliott Wave theory, it appears that the US 10-Year Government Bond Yield has succeeded in completing the main wave 4 with a Double Three Correction(WXY).
I expect the US 10-Year Government Bond Yield to attack Resistance lines after breaking the Neckline and Resistance zone(4.24%-4.14%).
-----------------------------------------------------
Impact of a Rising US 10-Year Yield
•Bitcoin( BINANCE:BTCUSDT ):
A higher 10-year yield usually reduces liquidity and increases funding costs, which puts pressure on risk assets. BTC typically faces short-term downside or slower momentum when yields rise.
•Gold( OANDA:XAUUSD ):
Gold often moves inversely to yields. Rising yields increase the opportunity cost of holding gold, making it less attractive. This usually leads to weakness or consolidation in gold.
•Stocks (Equities):
Higher yields tighten financial conditions and lower valuations, especially for tech and growth stocks. Equities generally face selling pressure when yields rise sharply.
If you would like to see technical analysis on the weekly timeframe, I recommend you take a look at the link below.👇
-----------------------------------------------------
💡 Please respect each other's opinions and express agreement or disagreement politely.
📌US 10-Year Government Bond Yield Analyze ( TVC:US10 ), Daily time frame.
🛑 Always set a Stop Loss(SL) for every position you open.
✅ This is just my idea; I’d love to see your thoughts too!
🔥 If you find it helpful, please BOOST this post and share it with your friends.
Gold: The $4K - make it or break it?Gold was holding higher grounds during the previous week. Its price was moving in a relatively shorter range, between $4.002 and $4.130. Charts are showing a sort of narrowing moves within this range, in which sense, it might be expected a break in the coming period, whether to the up- or to the downside. The catalyst for such a move might be expectations of the Fed rate cut in December. Posted delayed jobs data are showing mixed signals, with the unemployment rate modestly increased in September to 4,4% from 4,3% previously.
The RSI was moving around the level of 50 during the week, reflecting the price movements without a clear trend. The MA200 is now strongly converging toward the MA50, where the potential cross might be expected in the near term period.
The support line at $4K remains strong, while it has not been tested during the week. The move above the $4.100 also remains a high challenge for gold at this moment. Considering the narrowing of price range traded during the day, a break to one side might be expected in the week(s) ahead. On the downside, the $4K remains a support, while a break from this level would lead the price of gold down to $3.920. On the upside, the $4,1K remains a short resistance, while the break of this level would lead the price toward the $4,2K.

GOLD unstoppable!GOLD is testing a TrendLine and should be rising this week. Waiting for a Break of all time Highs going into 2026.

In the game of global trade, the referee is gold!!!What appears to be the convergence of two long-term downtrends formed by the parity of the gold to bitcoin ratio, and at this point when gold has broken its grip (thanks to the foolishness of Western governments past and present), we should see the price rise to the 1.59 range.
This is evidence that gold prices, even if they have not increased since the time of writing, are still in high demand! And gold is the best judge of the global economy!
Good luck

Copper continues to grow!The two price targets I envision on the chart, which indicate continued upward swings, are the powerful candles of the last two weeks that have made it easier to reach these targets in the medium term, and other than time, which requires more patience, I don't see any reason why we won't reach the desired target!

Zayed Al-Wasafi's excessive interest in targeting a price of $58Whatever we see from oil in the short term is considered a unique buying opportunity for astronomical and unprecedented goals in history, but for now we should think about the immediate goal!
Good luck
XAUUSD (Gold) – Target Analysis...(XAUUSD) Target Analysis based on my chart (2H timeframe):
---
📌 XAUUSD (Gold) – Target Analysis
My chart shows:
A long-term ascending trendline
Price breaking below the trendline
Price also falling inside / below the Ichimoku cloud
A downward arrow drawn toward a lower support zone
This setup indicates bearish continuation.
---
🎯 Main Target (Based on my Marked Level)
$3,940 – $3,960 zone
This matches the “Target Point” you marked on my chart.
This level is a strong support area where price may reach after the trendline break.
---
📉 Why This Target Is Valid
Trendline breakdown indicates a shift from bullish → bearish
Price is below cloud → bearish momentum
Clean space below, meaning no strong support until $3,940 area
---
📌 Suggested Trade Plan
Entry: After clean breakdown retest (approx. $4,030 – $4,050)
Stop-Loss: Above trendline → $4,085 – $4,100
Take Profit: $3,940 – $3,960
