GOLD 4H CHART ROUTE MAP UPDATE & TRADING PLAN FOR THE WEEKHey Everyone,
Please see our updated 4h chart levels and targets for the coming week.
We are seeing price play between two weighted levels with a gap above at 3282 and a gap below at 3224. We will need to see ema5 cross and lock on either weighted level to determine the next range. We have a bigger range in play then usual.
We will see levels tested side by side until one of the weighted levels break and lock to confirm direction for the next range.
We will keep the above in mind when taking buys from dips. Our updated levels and weighted levels will allow us to track the movement down and then catch bounces up.
We will continue to buy dips using our support levels taking 30 to 40 pips. As stated before each of our level structures give 20 to 40 pip bounces, which is enough for a nice entry and exit. If you back test the levels we shared every week for the past 24 months, you can see how effectively they were used to trade with or against short/mid term swings and trends.
The swing range give bigger bounces then our weighted levels that's the difference between weighted levels and swing ranges.
BULLISH TARGET
3282
EMA5 CROSS AND LOCK ABOVE 3282 WILL OPEN THE FOLLOWING BULLISH TARGET
3343
EMA5 CROSS AND LOCK ABOVE 3343 WILL OPEN THE FOLLOWING BULLISH TARGET
3404
EMA5 CROSS AND LOCK ABOVE 3404 WILL OPEN THE FOLLOWING BULLISH TARGET
3439
EMA5 CROSS AND LOCK ABOVE 3439 WILL OPEN THE FOLLOWING BULLISH TARGET
3503
BEARISH TARGETS
3224
EMA5 CROSS AND LOCK BELOW 3224 WILL OPEN THE FOLLOWING RETRACEMENT RANGE
3190
3138
EMA5 CROSS AND LOCK BELOW 3138 WILL OPEN THE SWING RANGE
SWING RANGE
3088 - 3046
EMA5 CROSS AND LOCK BELOW 3046 WILL OPEN THE SECONDARY SWING RANGE
SECONDARY SWING RANGE
3015 - 2988
As always, we will keep you all updated with regular updates throughout the week and how we manage the active ideas and setups. Thank you all for your likes, comments and follows, we really appreciate it!
Mr Gold
GoldViewFX
Commodities

Gold price sticksGold price (XAU/USD) sticks to its modest intraday gains above the $3,250 level through the Asian session on Monday, though it lacks strong follow-through buying or a bullish conviction. Against the backdrop of the protracted Russia-Ukraine war, an escalation of the Middle East conflict keeps the geopolitical risk in play. Furthermore, the uncertainty over US President Donald Trump's tariff plans weighs on investors' sentiment and benefits the traditional safe-haven precious metal.
Meanwhile, heightened economic uncertainty on the back of Trump's tariffs fails to assist the US Dollar (USD) to capitalize on the upbeat US monthly jobs report-inspired bounce. Apart from this, bets for an imminent start of the Federal Reserve's (Fed) rate-cutting cycle lend additional support to the non-yielding Gold price. Traders, however, seem reluctant to place aggressive bets and opt to move to the sidelines ahead of a two-day FOMC policy meeting starting on Tuesday.

Gold Breaks Wedge, 3270–3280 Now Key Pivot for RecoveryGold's recent retreat has slowed, forming a descending wedge pattern that has now been broken. This is a constructive setup for a potential upward reaction after falling $300 from the $3,500 high. The 3,270–3,280 zone is now the short-term pivot point. If this level breaks as well, the upward move may finally begin.
Potential targets include the 38.2% retracement level at 3,316 and the main resistance zone at 3,355–3,370.

Latest gold trading analysis strategy on May 6:
Core driving factors
Surge in safe-haven demand
The continued escalation of the conflict between Russia and Ukraine and the situation in the Middle East has driven funds to flow into gold for safe-haven, with an intraday increase of 2.27% (over $80), reaching a high of $3,328.
Policy uncertainties such as the 100% tariff imposed by the United States on imported films have further weakened market risk appetite.
Monetary policy expectations
The market is betting that the Federal Reserve will soon start a rate cut cycle, and the attractiveness of interest-free assets such as gold has increased. However, it is necessary to be vigilant that inflation resilience or economic data exceeding expectations may delay rate cuts and trigger a correction in gold prices.
Weak US dollar and central bank gold purchases
The US dollar has failed to gain sustained momentum from strong employment data to support gold. The global central bank gold purchases (especially in emerging markets) provide long-term support for gold prices.
Key technical signals
Daily level
Potential top risk: The long upper shadow line of the high and fall last Friday shows upper selling pressure, MACD dead cross and MA5 moving average downward, suggesting that the trend may weaken.
Support confirmation: The current price has returned to above $3,300, and it is necessary to observe whether it can stand firm at this psychological barrier.
4-hour level
Range oscillation: Short-term wide range oscillation between 3270 and 3350, MACD golden cross but needs to break through the 3330-3350 pressure zone to confirm the continuation of the bulls.
Key positions:
Resistance: 3330 (intraday high), 3350 (previous high and upper edge of the range).
Support: 3300 (psychological barrier), 3280-3290 (MA10 moving average and short-term bull defense line).
Operation strategy suggestions
Short-term bull opportunities
Entry conditions: Retracing to the 3280-3290 support area and the emergence of stabilization signals (such as 4-hour K-line closing positive or MACD bottom divergence).
Target: 3330→3350, after breaking through, it can look up to 3400.
Stop loss: below 3270 (the trend turns bearish if the range breaks).
Be cautious of high-altitude opportunities
Entry conditions: rebound to 3340-3350 under pressure (previous high of the daily line + upper edge of the range), combined with K-line reversal patterns (such as pin bar).
Target: 3300→3280.
Stop loss: above 3360 (to prevent sudden geopolitical risks from driving breakthroughs).
Breakthrough follow-up strategy
Break above 3350: light position chasing long, target 3400, stop loss 3340.
Break below 3270: turn to bearish, target 3230-3250, stop loss 3280.
Risk warning
Escalation of geopolitical conflicts: If the situation suddenly deteriorates (such as large-scale conflicts in the Middle East), the gold price may quickly break through 3350, and the stop loss needs to be adjusted in time.
Changes in Fed policy expectations: Focus on non-agricultural, CPI and other data. If it shows that the economy is overheated or inflation is sticky, it may suppress expectations of interest rate cuts and be bearish for gold.
Summary: Gold is bullish in the short term due to risk aversion, but there is a risk of a correction on the technical side. It is recommended to go long on pullbacks, and try to go high at key resistance levels with strict risk control. Conservative investors can wait for a breakout of 3350 or a fall below 3270 before following the trend.

Hellena | Oil (4H): SHORT to support area of 55.204.Colleagues, I believe that the price will continue its downward movement. At the moment we are observing a combined correction. I expect the completion of wave “Y”. Even if it is already completed, the price is still waiting for a downward correction to the support area of 55.204. Therefore, I think that 55.204 is the 1st minimum target.
There are two possible ways to enter the position:
1) Market entry
2) Pending Limit orders.
Manage your capital correctly and competently! Only enter trades based on reliable patterns!

XAUUSD: 5/5 Today’s Market Analysis and StrategyGold technical analysis
4-hour chart resistance level 3350, support level 3260
1-hour chart resistance level 3350, support level 3274
30-minute chart resistance level 3320, support level 3290
At the 4-hour level, gold lows continue to move up, highs continue to refresh, MACD technical indicators have formed a golden cross upward, adding momentum to the bulls.
The previous high of 3272 will turn into support after breaking through. If the retracement is large, buy again after stabilizing in the 3270-3280 range.
Short-term resistance is at the previous high of 3320. After breaking through, the upward trend will continue. The bullish targets are 3330 and 3350 respectively. If it is blocked near 3350, you can consider selling

Crude Oil's Bearish Trend Continues: Intraday Trading StrategiesDuring the US trading session on Monday, crude oil recovered part of the losses from the sharp decline at the opening of this week. Previously, OPEC+ unexpectedly increased production again, causing crude oil to continue the bearish trend that has been gradually taking shape since March.
Today, the price of crude oil first rose and then fell. After hitting a new low, the upward trend continued, but when it reached around $57.7, it encountered significant resistance. Looking ahead, it is expected that crude oil will experience an oscillation phase first, and then continue its downward trend.
Currently, crude oil is still in a bear - dominated trend. For intraday trading strategies, it is recommended to focus on short - selling on rallies and use buying on dips as a secondary approach. Pay close attention to the resistance range of $57.7 - $58.5 on the upside and the support range of $55.5 - $54.0 on the downside.
USOIL
sell@57.30-57.50
tp:56.50-56.00
Investment itself is not risky; it is only when investment is out of control that risks occur. When trading, always remember not to act on impulse. I will share trading signals every day. All the signals have been accurate without any mistakes for a whole month. No matter what gains or losses you've had in the past, with my help, you have the hope of achieving a breakthrough in your investment.

Gold Rejection at Channel Resistance – Bearish Setup in Play"
🔍 Analysis Summary
Current Price: \~\$3,266
Indicators:
EMA 50 (Red): \~\$3,277 – price is slightly below this level
EMA 200 (Blue): \~\$3,180 – acts as a dynamic support
Trend Structure:
Previous Uptrend: Sharp bullish move within a rising wedge (now broken)
Current Pattern: Descending channel or flag-like consolidation after the strong bullish trend
Support Level: \~\$3,175–\$3,180 (highlighted zone with green arrows showing bounce)
Resistance Level (Target 1): \~\$3,277–\$3,300
Target Point: \~\$3,356
📈 Bullish Scenario:
Price bounced off strong support (around EMA 200 + horizontal level).
If price breaks above the descending channel and retests resistance, it could aim for **Target 1 (\~3,300) and possibly reach **Target Point (\~3,356)**.
📉 Bearish Scenario:
Failure to break above descending channel resistance could lead to a retest of the support zone.
If support breaks, the next possible stop could be below the EMA 200, triggering deeper correction.
🧠 Trading Idea
Buy Entry: On confirmed breakout above descending channel.
Target 1: \~3,300
Target 2: \~3,356
Stop Loss: Below \~3,175 support

Gold Setup: Range or Rip? Here's the PlaybookGold’s been on a tear lately — driven by safe haven demand as real yields soften and global uncertainty lingers.
But here’s where things get interesting...
We’re now watching what could be a textbook head and shoulders pattern start to take shape.
📊 Current Range:
Right now, price is stuck between 3380 and 3280 — and it’s acting like it knows it.
⚡ Possible Scenarios:
🔁 Scenario 1: Range Play
Short near 3380
Long near 3280
Let it ping-pong and catch the edges.
📈 Scenario 2: Breakout Long
Confirmation above 3380
Look for momentum follow-through into 3420+
📉 Scenario 3: Breakdown Short
Break below 3280
Eyes on the 3220s for a potential flush
🧠 The key? Drop to the lower time frames near these zones and wait for clean setups during active sessions — especially NY open or post-data volatility.
💬 How are you playing this? Breakout or bounce? Drop your take 👇
#gold #tradingview #futures #technicalanalysis #metals #xauusd #tradingstrategy #macro

GOLD MARKET ANALYSIS AND COMMENTARY - [May 05 - May 09]This week, the international OANDA:XAUUSD has dropped sharply from 3,352 USD/oz to 3,201 USD/oz and closed the week at 3,240 USD/oz.
The reason for the sharp drop in gold prices is that US President Donald Trump said that the US is about to reach a trade agreement with India, Japan, South Korea, and is likely to reach a trade agreement with China, although the two sides have not had any official negotiations.
In addition, an equally important factor is that China is on holiday from May 1 to May 5, so the demand for transactions in the world's largest gold consuming country is almost non-existent. While they have been continuously buying before even though the gold price was high.
The FED meeting on May 6-7 may have a strong impact on gold prices next week. US GDP in the first quarter grew by -0.3%, while the labor market still has potential tariff risks; inflation remains stable at a high level. With these data, it is likely that the FED will maintain interest rates at current levels, but may signal that a rate cut is coming soon. According to many experts, if the FED signals that it will cut interest rates after the meeting next week, it will push gold prices to recover next week. On the contrary, if the FED maintains a wait-and-see attitude, declaring that it is not in a hurry to cut interest rates, then gold prices next week may continue to adjust.
🕹SOME DATA THAT MAY AFFECT GOLD PRICES THIS WEEK:
Next week, all eyes will be on the Federal Reserve’s monetary policy meeting on Wednesday, with an interest rate decision and a press conference from Chairman Jerome Powell following keynote remarks earlier in April.
Fed officials will then continue their participation in the Reykjavik Economic Conference in Iceland on Friday. Fed Governors Michael Barr, Lisa Cook, Philip Jefferson and Christopher Waller will be present at the conference as speakers in panels on topics including artificial intelligence, employment and monetary policy research.
In addition, investors will also watch the ISM services PMI on Monday morning and the weekly jobless claims number on Thursday.
📌Technically, if gold prices fall below $3,200/oz next week, there is a possibility of a further decline to $3,129/oz. A deeper correction could see gold prices fall to $2,980-$3,000/oz next week. If gold prices reverse and break the $3,270/oz barrier, they could continue to rise above $3,350/oz.
Notable technical levels are listed below.
Support: 3,228 – 3,163USD
Resistance: 3,245 – 3,267 – 3,292 – 3,300USD
SELL XAUUSD PRICE 3311 - 3309⚡️
↠↠ Stop Loss 3315
BUY XAUUSD PRICE 3119 - 3121⚡️
↠↠ Stop Loss 3115

GOLD WEEKLY CHART MID/LONG TERM ROUTE MAPHey Everyone,
Quick update on our weekly chart idea, it's been playing out beautifully, helping us track the move down and catch the move back up.
The weekly chart structure is unfolding in line with prior analysis. Price action reached the upper boundary of the ascending Goldturn channel and temporarily broke above it; however, the EMA5 remained confined within the channel, validating the upper trendline as dynamic resistance.
A sustained EMA5 breakout above the channel would have confirmed a potential continuation of the breakout. Currently, price is consolidating within the Goldturn channel, with the 3189 level acting as immediate support. The channel half line of the channel may serve as a stronger swing support area, though price may not retest this level immediately. As the channel continues its upward trajectory, the midline will also rise, potentially aligning with price in future upward movements.
This is the beauty of our Goldturn channels, drawn using weighted averages instead of pure price action. This unique approach helps us clearly identify fake-outs and real breakouts, cutting out much of the noise that usually confuses traders.
Moving forward, we’ll focus on smaller timeframes (1H and 4H) to buy dips off the weighted Goldturns, aiming for clean 30–40 pip moves. Ranging markets are perfect for this style, allowing us to capitalize on quick moves without getting caught in the chop of larger swings.
Thanks again for all your likes, comments, and follows, we really appreciate the support!
Mr Gold
GoldViewFX

Gold prices surge as risk aversion risesGold has now broken through strongly and stabilized above 3350. Gold fell back in the Asian session and went long. Gold bulls restarted and accumulated energy. Now gold bulls obviously occupy a dominant position. Gold fell back in the Asian session and could only go long. For the current market, don't chase it easily. The market fluctuates too much. Wait patiently for the opportunity to go long after the decline.
The 1-hour moving average of gold has begun to cross upward to form a golden cross. Gold bulls have begun to exert their strength. After gold broke through the 3350 line yesterday, gold fell back to around 3305 and continued to exert its strength. In the short term, 3350 is the key to the turning point of gold bulls and bears. Gold fell back to 3350 in the early trading, which is an opportunity to go long on dips.
The market changes rapidly. Since gold bulls are more powerful at the moment, gold will continue to go long. After the adjustment of gold bulls, the bottom rose. Then the gold bulls may have just begun, and the gold bulls are expected to continue to rise.
Buy range: 3350-3348, SL: 3338, TP: 3370-3380
Sell range: 3395-3397, SL: 3407, TP: 3375-3365
Key points:
First support: 3350, second support: 3340, third support: 3330
First resistance: 3390, second resistance: 3400, third resistance: 3410
For more free sharing, please click on my avatar

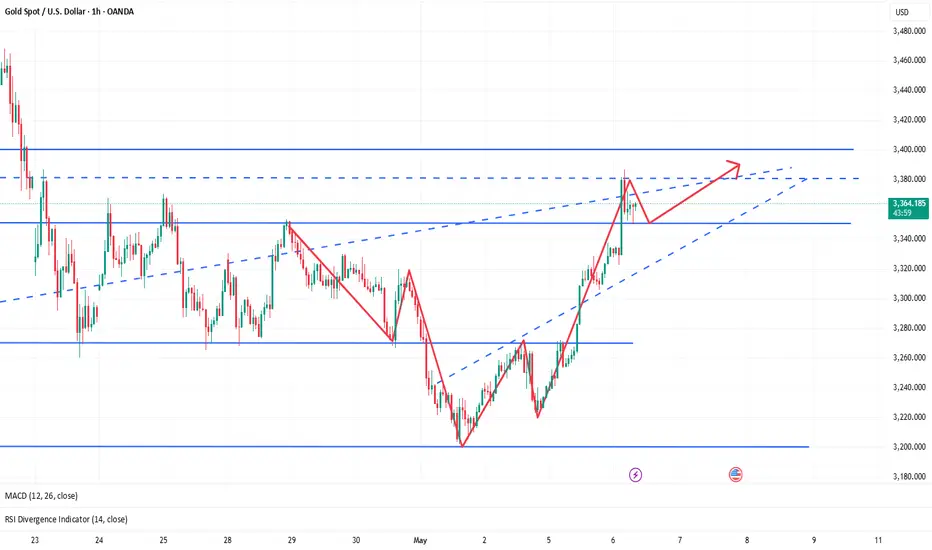
Gold (XAUUSD) 4H Chart – Key Resistance Test: Breakout or RejectSimple Analysis:
Price is currently at a resistance zone (~$3,335).
Two possible outcomes are drawn:
Bullish scenario: Break above current resistance → move toward the next resistance (~$3,500+).
Bearish scenario: Rejection from current resistance → fall back to the support zone (~$3,240).
EMAs:
50 EMA (red) is above 200 EMA (blue) = bullish bias, but price must break resistance to continue upward.
Summary:
Watch for a breakout above ~$3,335 for bullish continuation, or a rejection for a potential drop to support near ~$3,240.

Silver – Bearish Move Toward Support🧠 Market Overview:
Instrument: Likely Silver (based on file name).
Chart Context: The price is currently trading below both the 50 EMA (red) and 200 EMA (blue), indicating bearish momentum and a possible shift in market structure.
📊 Key Technical Components:
🔹 Exponential Moving Averages (EMA):
50 EMA (32.614) is above the 200 EMA (32.526) but both are above the current price.
This crossover is recent and could indicate the beginning of a larger downtrend if confirmed by continued price action below both EMAs.
🔹 Market Structure:
POI (Point of Interest) marks a previous swing high where selling pressure emerged.
The chart shows internal liquidity (INT.LQ) sweeps both above and below consolidation areas, hinting at smart money manipulation to grab liquidity before making a move.
🔹 Resistance Zone:
Clearly defined between approx. 33.4–34.0, where price was rejected after a failed attempt to break higher.
Multiple rejections from this zone show strong selling pressure.
🔹 Support Zone:
Sitting between approx. 30.8–31.2.
Price previously consolidated here before a bullish move, making it a likely target for a return test or a potential bounce.
📉 Bearish Scenario & Projection:
The price broke below a short-term structure and failed to hold above EMAs.
The current price action shows a bearish pullback likely to form a Lower High (LH).
The projected path shows a pullback to previous support-turned-resistance, followed by a breakdown targeting the support zone.
✅ Bias:
Short-term bias: Bearish
Medium-term bias: Bearish, unless price reclaims the 200 EMA and consolidates above the resistance zone.
🔍 Confluences Supporting Bearish Outlook:
Price below EMAs (dynamic resistance).
Failed higher highs with liquidity sweeps (indicating smart money selling).
Clear market structure shift to the downside.
Anticipated retest of support zone around 30.8–31.2.

Gold price suddenly accelerates, approaching the 3,300 USD/ounceAfter two consecutive weeks of decline, the world gold price is showing strong signs of recovery when it skyrocketed to 3,266 USD/ounce - an increase of 25 USD in just one session. Although still quite far from the peak of 3,500 USD/ounce, the increase this morning shows that investor sentiment has begun to change direction.
The increase occurred at the beginning of the session despite previous negative forecasts, reflecting the sensitivity of gold to geopolitical and economic information such as US-China trade negotiations or the strength of the USD. The daily chart shows that gold has bounced strongly from the EMA34 support zone and returned to the resistance zone around 3,320–3,340 USD, opening up an opportunity to retest the 3,400 USD mark if the current increase is maintained.

GOLD DAILY CHART ROUTE MAP UPDATEHey Everyone,
Here’s the latest update on our daily chart idea, it’s been playing out perfectly!
The daily chart is unfolding as projected, with price action respecting the structure of the Goldturn ascending channel. A breakout above the channel was confirmed by the EMA5 crossing and closing above the upper boundary. This move extended to test the 3433 Goldturn axis level, where price met resistance. Notably, EMA5 failed to sustain a close above 3433 Goldturn level, confirming a lack of bullish momentum and validating a rejection. Price has since reversed, re-entering the channel.
Below, broader support is identified around 3104, which aligns with the channel’s half line. While this level may not be reached immediately, the current price range between 3297 and 3104 is significant. We may observe continued consolidation within this zone, with the half line gradually ascending. This dynamic could result in price interacting with the half line earlier than a direct move to 3104, providing potential bounce opportunities best monitored through lower timeframes for refined entries and validations.
This is the beauty of our Goldturn channels, drawn using weighted averages instead of pure price action. This unique approach helps us clearly identify fake-outs and real breakouts, cutting out much of the noise that usually confuses traders.
Moving forward, we’ll focus on smaller timeframes (1H and 4H) to buy dips off the weighted Goldturns, aiming for clean 30–40 pip moves. Ranging markets are perfect for this style, allowing us to capitalize on quick moves without getting caught in the chop of larger swings.
Thank you all again for your continued likes, comments, and follows, we truly appreciate your support!
Mr Gold
GoldViewFX

Gold Price ActionHello traders! This is almost same setup or pattern as BTCUSD
If you look closely at the left side of the chart, you’ll notice multiple rejections from the same zone — forming a head-and-shoulders-style distribution. This area has now become a strong supply zone.
📌 What to Expect:
This is a high-probability short setup. If price taps into the supply zone again, it could trigger a strong move down, especially with liquidity already swept.

XAUUSD - Gold Trend Before FOMC!Gold is trading above its EMA200 and EMA50 on the 4-hour timeframe and is trading on its uptrend line. A continued upward move in gold will put it in the supply zone, where it is possible to look for short positions. A downward correction in gold will also open up long positions.
Gold traders endured another turbulent week, marked by the second consecutive decline in prices—once again underscoring the market’s acute sensitivity to economic news and developments.
Adrian Day, CEO of Adrian Day Asset Management, offered a cautiously humorous take on the situation by likening it to the Peggy Lee song that asks, “Is that all there is?” He pointed out that gold has pulled back by over 7% from its recent high in less than two weeks.Although this correction is notable, it hasn’t been deep enough to flush out all short-term traders or weak-handed investors from the market.
Day added that rising fears of a U.S. recession—which typically exert early downward pressure on gold—alongside the possibility of easing U.S.-China trade tensions, may limit investment demand for gold in the short term. Concluding his comments, he maintained a cautious stance, saying that further downside remains likely and that his outlook for the coming week is bearish.
Meanwhile, U.S. President Donald Trump, in a new interview with NBC, addressed several key economic and political issues. He stated that if necessary, the deadline for selling TikTok would be extended, and some tariffs on Chinese goods might become permanent. Nevertheless, he indicated that he is also considering reducing certain tariffs in the future.
Trump emphasized that small businesses do not require additional assistance and that the Federal Reserve should cut interest rates. He confirmed that Jerome Powell will remain Fed Chair through the end of his term in 2026. He also mentioned potential successors for his own position, naming Vance and Rubio as possibilities.
After a week dominated by employment data, the upcoming week will be entirely focused on monetary policy. The centerpiece will be the May FOMC meeting, the Fed’s rate decision, and Jerome Powell’s press conference on Wednesday. While markets broadly expect the Fed to hold rates steady, Powell’s official remarks and answers to press questions—especially following his sharp tone earlier in April—will be under close scrutiny.
It is widely expected that the Federal Reserve will leave its key interest rate unchanged on Wednesday, as policymakers assess how President Trump’s tariffs gradually impact various sectors of the economy. Markets are currently pricing in a potential rate cut starting in July. The Fed’s dual mandate is to maintain low inflation and high employment, and it may face a dilemma if tariffs negatively affect both indicators, as many economists now warn.
Immediately following the Fed meeting, senior policymakers including Barr, Kugler, Waller, and Cook will travel to Iceland to attend the Reykjavik Economic Conference. On Friday, they will participate in panels discussing artificial intelligence, labor market trends, and monetary research—topics that could offer insights into the Fed’s long-term policy direction.
Simultaneously, traders are also awaiting two key reports: the ISM Services Index for May, due today, and weekly jobless claims figures set for release on Thursday. Together, these reports will help complete the picture of the U.S. economy as critical monetary policy decisions approach.

Gold returns to the bull market as expected, follow-up layout🗞News side:
1. The “demand shock” of the Trump administration’s tariffs on the global economy
2. The United States rejected Japan’s request for a comprehensive exemption from 10% reciprocal tariffs and country-specific tariffs in recent negotiations.
3. The conflict between Israel and the Houthis
📈Technical aspects:
From a technical point of view, the 4H gold bulls are once again making an impact. At the top, we focus on the short-term suppression of the 3380-3390 line, focusing on the suppression of the 3400 line. Below, we focus on the short-term support of the 3350 line, and the important first-line support of 3335-3340. In terms of operation, we mainly go long by stepping back on 3350-3360, and the target is temporarily looking at 3380-3390. In the middle position, we should watch more and move less, pursue orders cautiously, and wait patiently for key points to enter the market.
If you agree with this point of view, or you have a better idea, please leave a message in the comment area. I look forward to hearing different voices.
OANDA:XAUUSD FX:XAUUSD FXOPEN:XAUUSD FOREXCOM:XAUUSD TVC:GOLD
USOIL trading opportunities.After the "OPEC+ continued to increase production" on Monday, USOIL continued to fall to a four-year low near 55. However, it rebounded after opening low on Monday. It continued on Tuesday. Is it no longer able to fall?
Ludvig believes that it will continue to fall. Because the decline is caused by the growth of production capacity. The rise is caused by geopolitical strategic reserve materials. One of these two directly affects the trend of OIL, and the other indirectly.
The trend of economic data API/EAI will continue to be released. If the geopolitical weakening situation, the oil price data released is roughly negative, so it will continue to fall. But if the impact of geopolitics intensifies, this is a positive factor.
So the current trading direction that can be determined is to continue to short.
In terms of trading, traders with large funds can sell at the current price, and those with small funds can wait until the market returns to above 59 to sell.
The band trading center continues to update new real-time trading opportunities. If you don’t know how to trade, or don’t want to miss the next real-time trading opportunity, remember to follow me.

How to plan when gold’s rise encounters resistance🗞News side:
1. Pay attention to the recent trade situation and news about the Fed's interest rate cuts
2. Be wary of DXY trends
3. The situation of the Russian-Ukrainian war and the follow-up events of the India-Pakistan conflict
4.Trump imposes 100% tariff on non-US films
📈Technical aspects:
Compared with today's market, the morning rise happened to be a sideways price, breaking through the previous high point. In a volatile rise, it doesn't matter. It is very likely that in the later trend, the price will return to the starting point or even lower, but it can continue to rise. This is a feature of the shock. At the same time, the current market is not extremely strong, and it is still in a volatile rise. Therefore, do not chase long, but retrace as much support as possible.
🎁SELL 3315-3325
🎁TP 3280-3270
🎁BUY 3270-3280
🎁TP 3300-3310
If you agree with this point of view, or you have a better idea, please leave a message in the comment area. I look forward to hearing different voices.
OANDA:XAUUSD FX:XAUUSD FXOPEN:XAUUSD FOREXCOM:XAUUSD TVC:GOLD

GOLD UPDATEMarket structure suggests is preparing for its next move.
The AND level will likely play a critical role in the upcoming direction.
** If structure breaks and confirms the shift, a new bias might form after the retest. **

Trade Idea: $MSFT Short to $418 and beyond into JuneTriple bearish divergence is evident on Volume, RSI, and Momentum. The 9-count sell signal on the daily chart further supports the likelihood of a sell-off at this point. If the price falls below $425, a swift decline to $418 is anticipated, where the true test of the Fair Value Gap (FVG) below will occur. The Fair Value Gap open is at $392.45. Stop would be above yesterday's high at $439.50 ...
