XAUUSD Far from signaling a BUY yet.Gold (XAUUSD) has been trading within a +1 year Channel Up and has found itself on a correction (Bearish Leg) since it's All Time High (ATH), which was a Higher High for the pattern, 1 month ago.
Despite this -11% Bearish Leg so far, it hasn't even broken yet below its 1D MA50 (blue trend-line), which is something it has done on both previous Bearish Legs. As you can see those have been fairly similar to the current one (-10.92% and -9.32% respectively). All started after roughly +40% Bullish Legs led to those.
Notice also that both Bullish Legs had to test the 1D MA100 (green trend-line) before the started. At the same time the 1W RSI hit its Buy Zone.
As a result, Gold hasn't waved a buy signal yet.
---
** Please LIKE 👍, FOLLOW ✅, SHARE 🙌 and COMMENT ✍ if you enjoy this idea! Also share your ideas and charts in the comments section below! This is best way to keep it relevant, support us, keep the content here free and allow the idea to reach as many people as possible. **
---
💸💸💸💸💸💸
👇 👇 👇 👇 👇 👇
Commodities


XAUUSD: Market Analysis and Strategy for November 17thGold Technical Analysis:
Daily Resistance: 4250, Support: 4000
4-Hour Resistance: 4145, Support: 4030
1-Hour Resistance: 4110, Support: 4050
The technical picture is largely in line with recent analysis expectations. The weekly chart shows a pullback after a rally, making short-term bullishness somewhat difficult. The daily candlestick pattern's "rounded bottom" support remains intact, and the Bollinger Bands are narrowing. Historically, the risk of a further decline after a technical correction remains relatively high. Those who have been following my recent articles know the important level of 4030. Investors need to be cautious around 4030; a break below this level could lead to a short-term move towards 3930. If the price rebounds and recovers 4130/4160 in the short term, a bullish outlook is warranted, with the 4220/4250 area as a potential resistance level.
Based on the 1-hour chart, gold is currently in a short-term tug-of-war between bulls and bears, with overall market sentiment remaining weak. Watch for support momentum from the MACD/KDJ indicators.
NY Market Trading Strategy:
BUY: 4050 near
BUY: 4040 near
SELL: 4106~4110
More Analysis →

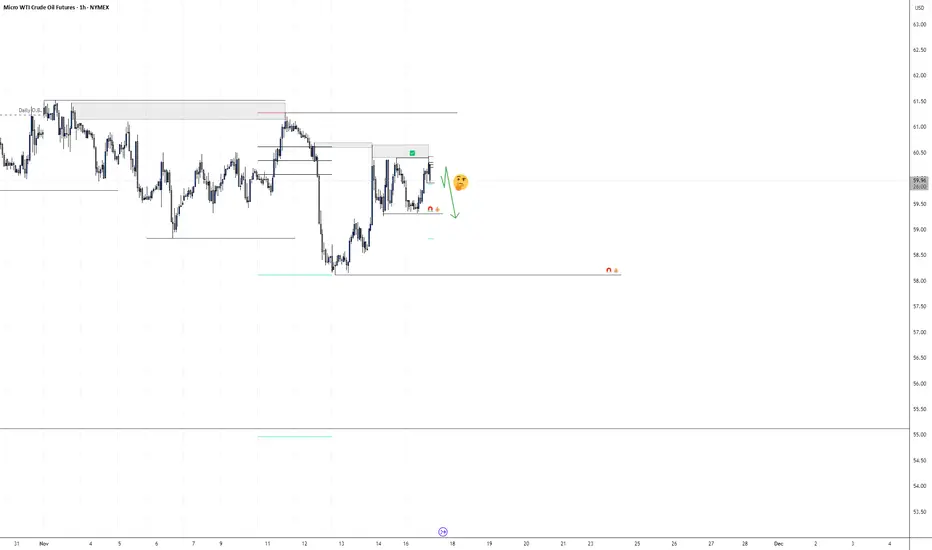
Institutional Order Flow MCl1!Institutional order flow on MCL1! is showing a draw on liquidity with relative equal lows near 55 - 55.5 pricing.
Dropping down to the lower time frame the swing structure holds true and is pointing at lower prices in the near future.
We're looking for entries on the lower time frame and following the fractal trend within the Daily.
Waiting for confirmations, it looks like today will be a bearish day with the nearest target of 59.31
As always, wait for a confirmation entry, and hold small running positions for if we get deeper profits.

Silver psychological 5000 support levelThe Silver remains in a bullish trend, with recent price action showing signs of a corrective pullback within the broader uptrend.
Support Zone: 5000 – a key level from previous consolidation. Price is currently testing or approaching this level.
A bullish rebound from 5000 would confirm ongoing upside momentum, with potential targets at:
5215 – initial resistance
5325 – psychological and structural level
5390 – extended resistance on the longer-term chart
Bearish Scenario:
A confirmed break and daily close below 5000 would weaken the bullish outlook and suggest deeper downside risk toward:
4940 – minor support
4856 – stronger support and potential demand zone
Outlook:
Bullish bias remains intact while silver holds above 5000. A sustained break below this level could shift momentum to the downside in the short term.
This communication is for informational purposes only and should not be viewed as any form of recommendation as to a particular course of action or as investment advice. It is not intended as an offer or solicitation for the purchase or sale of any financial instrument or as an official confirmation of any transaction. Opinions, estimates and assumptions expressed herein are made as of the date of this communication and are subject to change without notice. This communication has been prepared based upon information, including market prices, data and other information, believed to be reliable; however, Trade Nation does not warrant its completeness or accuracy. All market prices and market data contained in or attached to this communication are indicative and subject to change without notice.

Gold support at 4033Key Support and Resistance Levels
Resistance Level 1: 4147
Resistance Level 2: 4207
Resistance Level 3: 4243
Support Level 1: 4033
Support Level 2: 4009
Support Level 3: 3985
This communication is for informational purposes only and should not be viewed as any form of recommendation as to a particular course of action or as investment advice. It is not intended as an offer or solicitation for the purchase or sale of any financial instrument or as an official confirmation of any transaction. Opinions, estimates and assumptions expressed herein are made as of the date of this communication and are subject to change without notice. This communication has been prepared based upon information, including market prices, data and other information, believed to be reliable; however, Trade Nation does not warrant its completeness or accuracy. All market prices and market data contained in or attached to this communication are indicative and subject to change without notice.

XAU/USD | Gold Holding Strong – More Upside If Support Holds!By analyzing the #Gold chart on the 4H timeframe, we can see that after a pullback, the price climbed again to $4112 before making a small correction. It’s now trading around $4078.
If gold can hold above $4048, we can expect another move to the upside.
The next potential targets are $4106, $4112, $4133, and $4159.
Please support me with your likes and comments to motivate me to share more analysis with you and share your opinion about the possible trend of this chart with me !
Best Regards , Arman Shaban

Double Top on the Weekly Silver ChartSilver ( AMEX:SLV ) has had a great run this year, however after a volatile week we've now printed a double top on the weekly chart. Is that the end of this great bull run? It would not surprise me to see some profit taking as we head towards the end of year. Perhaps a drift lower rathe rather than a collapse?

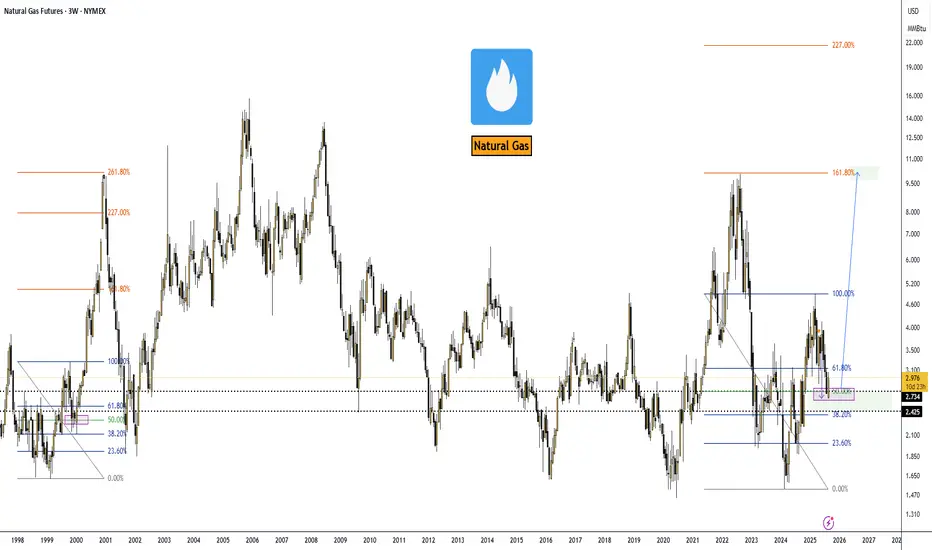
Natural Gas Market Outlook — September 01, 2025.VANTAGE:NG #NaturalGas #NatGas (NYMEX:NG1!) 🔵 Natural Gas Market Outlook — September 01, 2025.
Alright, here’s the skinny on NatGas. Back on April 28, 2025, I was calling for a dip into the $2.74 zone—and guess what? We tagged it right on schedule.
Now the game flips: I’m hunting long entries with the first serious target sitting at $10.00.
Could we overshoot? Absolutely. If momentum really gets cooking, the Fibo 227% extension lines up at roughly $21.00. But let’s not get greedy yet—$10 stays the main milestone for the next big leg.
Macro Drivers
➖ Exports: LNG shipments are the elephant in the room. Europe’s still thirsty, Asia’s paying up, and U.S. cargos are cashing in.
➖ Production: Flat. Shale guys aren’t rushing to flood the market unless we break above $3.20+.
➖ Geopolitics: Russia’s LNG rerouting and Middle East jitters keep a bid under global gas.
➖ Utilities & Consumers: Domestic demand is softer thanks to renewables transitions, but that’s a sideshow compared to export flows.
Big Picture
EIA pegs Henry Hub at $3.60 in 2025 and $4.30 in 2026, but frankly, that’s conservative. With demand from data centers, electrification, and global LNG growth, upside is more likely than not.
Trade View
➡️ I’m treating $2.74 as the cycle low. Any dips near that level look like golden tickets for long positioning into 2026. First pit stop: $10.00. If bulls get rowdy, keep an eye on $21.00 as the stretch target.
➡️ Bottom line: NatGas just gave us the reset we were waiting for. From here, risk/reward favors the long side. Strap in—it’s gonna be a volatile ride, but that’s where the money gets made.
BULLISH SCENARIO - USOILHello traders,
USOIL is currently moving inside a descending channel.
A bullish breakout is in focus:
If the price breaks the channel resistance and confirms the close above,
a strong upward movement is expected 🚀
🎯 TARGET: 65.150

THE KOG REPORT THE KOG REPORT:
Last week was an extremely decent week in Camelot with all Gold targets hitting and completing.
Quick KOG Report this week.
We’re expecting a potential range to form here between the with the key level of support being the 4040 level while 4080 will need an engulfing to attack this region. Above, the bias level is 4095 which we’re looking for the break on to then attempt the 4120-30 region initially. Although we have a reversal in play on most time frames, we would say play caution here as this could just be a swing low in formation before another opportunity for the market to get buyers in higher and flushing again.
RED BOXES:
Break above 4095 for 4104, 4110, 4120 and 4127 in extension of the move
Break below 4080 for 4065, 4055 and 4040 in extension of the move
Please do support us by hitting the like button, leaving a comment, and giving us a follow. We’ve been doing this for a long time now providing traders with in-depth free analysis on Gold, so your likes and comments are very much appreciated.
As always, trade safe.
KOG

SILVER BEARS WILL DOMINATE THE MARKET|SHORT
SILVER SIGNAL
Trade Direction: short
Entry Level: 5,103.6
Target Level: 4,498.0
Stop Loss: 5,504.6
RISK PROFILE
Risk level: medium
Suggested risk: 1%
Timeframe: 1D
Disclosure: I am part of Trade Nation's Influencer program and receive a monthly fee for using their TradingView charts in my analysis.
✅LIKE AND COMMENT MY IDEAS✅

DeGRAM | GOLD held the support line📊 TECHNICAL ANALYSIS
● The chart shows Gold (XAU/USD) trading within a rising support line, with multiple bounces (green arrows) near the $4,050–4,100 area and recent test of that trend-line. The upper descending resistance line (red arrows) marks a ceiling near $4,230-4,300 where prior highs were rejected.
● A short-term upward move is expected — price is likely to hold above the rising support trend-line and rebound toward the $4,138 horizontal resistance, with potential push toward $4,200+ if momentum sustains. The failure to hold the trend-line would risk revisiting support near $4,046.
💡 FUNDAMENTAL ANALYSIS
● Gold is benefitting from expectations of a rate cut by the Federal Reserve amidst weak US economic data and a recent government shutdown, which depresses the US dollar and real yields.
● Additionally, geopolitical uncertainty and strong central-bank purchases underpin safe-haven demand for gold, reinforcing the bullish technical outlook.
✨ SUMMARY
● Bias: Long from ~$4,050–4,100 area holding.
● Key trigger: Support hold + rebound toward ~$4,138 then ~$4,200-4,300.
● Risk: Break below ~$4,046 trend-line opens ~$4,000-$3,980.
● Fundamental tailwinds: rate-cut hopes + safe-haven demand = structural support.
-------------------
Share your opinion in the comments and support the idea with a like. Thanks for your support!

Gold: Open path to lower grounds?The price of gold was following general market sentiment during the previous week, and was traded in swings. The start of the week was marked with an increased demand for gold, bringing the price to the level of $4.243. However, Friday trading session brought a modest correction, where gold was headed toward the $4.035, but closed the week at $4.079.
The RSI closed the week at the level of 53, after previously reaching the level of 61. The indicator is showing that the market is struggling to take a clear path toward the oversold market side. The MA50 and MA200 lines are still moving without change - as two parallel lines with an uptrend.
Current charts are showing that the gold has an important level around $4.100, while strong support holds at $3.930. Friday trading session showed that the support at $4.1K was breached, which leaves the path open toward testing the $3.930 support. In this sense, the first stop for the price of gold might be the $4K level, before it continues its move further to the support line. With respect to the opposite side, there is currently some probability that the level of $4.1K could be tested again, and much lower probability for the level of $4,2K.

Gold Price AnalysisGold gave up its gains on Friday, rebounding to 4110 after a pullback to 4032. The daily chart closed lower, testing the 10-day moving average and the Bollinger Band's middle line. The RSI indicator pulled back to near the midline. The weekly chart shows a slight overall increase. On the shorter-term 4-hour and 1-hour charts, the moving averages formed a bearish crossover at a high level on Friday, with the price returning to the lower Bollinger Band. The RSI indicator broke below the midline. Technically, gold is maintaining a wide-range consolidation, and the tug-of-war between bulls and bears is expected to continue.
The 4-hour chart is in a consolidation phase. If it can recover lost ground and regain its position above the moving averages, the bulls may still have hope; otherwise, the downtrend may continue. On Monday, continue to wait for a rebound before selling. A relatively stable and ideal entry point on the daily chart is around 4150. If the market is weak, it may consolidate below 4110-4100. For long positions, a buy opportunity may arise if support is found at the 4040 level; a break below this level would warrant selling.
Key Levels:
First Support: 4070, Second Support: 4053, Third Support: 4033
First Resistance: 4123, Second Resistance: 4138, Third Resistance: 4150
Gold Trading Strategy:
Buy: 4035-4040, SL: 4120, TP: 4060-4080;
Sell: 4140-4145, SL: 4160, TP: 4120-4100;
More Analysis →

GOLD: Long Signal Explained
GOLD
- Classic bullish formation
- Our team expects pullback
SUGGESTED TRADE:
Swing Trade
Long GOLD
Entry - 4077.1
Sl - 4066.2
Tp - 4094.8
Our Risk - 1%
Start protection of your profits from lower levels
Disclosure: I am part of Trade Nation's Influencer program and receive a monthly fee for using their TradingView charts in my analysis.
❤️ Please, support our work with like & comment! ❤️

XAGUSD H1 | Bearish Reaction off Key ResistanceMomentum: Bearish
Price is currently below the ichimoku cloud.
Sell entry: 52.072
- Strong pullback resistance
- 61.8% Fib retracement
- Fair Value Gap
Stop Loss: 53.433
- Overlap resistance
Take Profit: 50.29
- Multi-swing low support
High Risk Investment Warning
Stratos Markets Limited (tradu.com/uk ), Stratos Europe Ltd (tradu.com/eu ):
CFDs are complex instruments and come with a high risk of losing money rapidly due to leverage. 70% of retail investor accounts lose money when trading CFDs with this provider. You should consider whether you understand how CFDs work and whether you can afford to take the high risk of losing your money.
Stratos Global LLC (tradu.com/en ): Losses can exceed deposits.
Please be advised that the information presented on TradingView is provided to Tradu (‘Company’, ‘we’) by a third-party provider (‘TFA Global Pte Ltd’). Please be reminded that you are solely responsible for the trading decisions on your account. Any information and/or content is intended entirely for research, educational and informational purposes only and does not constitute investment or consultation advice or investment strategy. The information is not tailored to the investment needs of any specific person and therefore does not involve a consideration of any of the investment objectives, financial situation or needs of any viewer that may receive it. Past performance is not a reliable indicator of future results. Actual results may differ materially from those anticipated in forward-looking or past performance statements. We assume no liability as to the accuracy or completeness of any of the information and/or content provided herein and the Company cannot be held responsible for any omission, mistake nor for any loss or damage including without limitation to any loss of profit which may arise from reliance on any information supplied by TFA Global Pte Ltd.

GOLD will rise after worries about financials reportsGold experienced two consecutive bearish sessions primarily due to the resolution of the government shutdown. This week, the main focus shifts to the upcoming financial reports and the extent to which the shutdown has affected the broader economy. Questions continue to arise regarding the previous month’s data and the possibility that some of those reports may never be released. A gap in financial reporting is never favorable, especially when paired with uncertainties surrounding this week’s releases—particularly those scheduled for Thursday.
From a technical perspective, GOLD has reached a strong support zone and shown a clear rejection. A retest of this rejection is expected before price advances toward the target zone, supported by the fundamental uncertainties anticipated in the coming days.

GOLD Will Go Lower From Resistance! Sell!
Here is our detailed technical review for GOLD.
Time Frame: 4h
Current Trend: Bearish
Sentiment: Overbought (based on 7-period RSI)
Forecast: Bearish
The market is on a crucial zone of supply 4,085.57.
The above-mentioned technicals clearly indicate the dominance of sellers on the market. I recommend shorting the instrument, aiming at 3,997.50 level.
P.S
The term oversold refers to a condition where an asset has traded lower in price and has the potential for a price bounce.
Overbought refers to market scenarios where the instrument is traded considerably higher than its fair value. Overvaluation is caused by market sentiments when there is positive news.
Like and subscribe and comment my ideas if you enjoy them!

XAUUSD H4 | Bullish Bounce off Key SupportMomentum: Bullish
Price is currently above the bullish ichimoku cloud.
Buy entry: 4,030.94
- Strong pullback support
- 61.8% Fib retracement
- 127.2% Fib extension
Stop Loss: 3,963.75
- Swing low support
Take Profit: 4,111.7
- Pullback resistance
High Risk Investment Warning
Stratos Markets Limited (tradu.com/uk ), Stratos Europe Ltd (tradu.com/eu ):
CFDs are complex instruments and come with a high risk of losing money rapidly due to leverage. 70% of retail investor accounts lose money when trading CFDs with this provider. You should consider whether you understand how CFDs work and whether you can afford to take the high risk of losing your money.
Stratos Global LLC (tradu.com/en ): Losses can exceed deposits.
Please be advised that the information presented on TradingView is provided to Tradu (‘Company’, ‘we’) by a third-party provider (‘TFA Global Pte Ltd’). Please be reminded that you are solely responsible for the trading decisions on your account. Any information and/or content is intended entirely for research, educational and informational purposes only and does not constitute investment or consultation advice or investment strategy. The information is not tailored to the investment needs of any specific person and therefore does not involve a consideration of any of the investment objectives, financial situation or needs of any viewer that may receive it. Past performance is not a reliable indicator of future results. Actual results may differ materially from those anticipated in forward-looking or past performance statements. We assume no liability as to the accuracy or completeness of any of the information and/or content provided herein and the Company cannot be held responsible for any omission, mistake nor for any loss or damage including without limitation to any loss of profit which may arise from reliance on any information supplied by TFA Global Pte Ltd.

XAGUSD H4 | Bullish Bounce off Key SupportMomentum: Bullish
Price is currently above the bullish ichimoku cloud.
Buy entry: 49.11
- Strong pullback support
- 71% Fib retracement
- 61.8% Fib projection
Stop Loss: 46.89
- Swing low support
Take Profit: 51.98
- Pullback resistance
High Risk Investment Warning
Stratos Markets Limited (tradu.com/uk ), Stratos Europe Ltd (tradu.com/eu ):
CFDs are complex instruments and come with a high risk of losing money rapidly due to leverage. 70% of retail investor accounts lose money when trading CFDs with this provider. You should consider whether you understand how CFDs work and whether you can afford to take the high risk of losing your money.
Stratos Global LLC (tradu.com/en ): Losses can exceed deposits.
Please be advised that the information presented on TradingView is provided to Tradu (‘Company’, ‘we’) by a third-party provider (‘TFA Global Pte Ltd’). Please be reminded that you are solely responsible for the trading decisions on your account. Any information and/or content is intended entirely for research, educational and informational purposes only and does not constitute investment or consultation advice or investment strategy. The information is not tailored to the investment needs of any specific person and therefore does not involve a consideration of any of the investment objectives, financial situation or needs of any viewer that may receive it. Past performance is not a reliable indicator of future results. Actual results may differ materially from those anticipated in forward-looking or past performance statements. We assume no liability as to the accuracy or completeness of any of the information and/or content provided herein and the Company cannot be held responsible for any omission, mistake nor for any loss or damage including without limitation to any loss of profit which may arise from reliance on any information supplied by TFA Global Pte Ltd.

PRE-LONDON CONDITIONS — 17 Nov 2025I. Market Environment
Dollar: Neutral overnight. No directional pressure in Asia.
Yields: US10Y and US2Y stable — policy expectations unchanged.
Risk: Equities firm but stretched. Volatility elevated from Friday.
Focus: Light session before a heavy macro week.
Liquidity: Cautious, headline-sensitive.
II. Six-Chart Snapshot
(All structural notes shown on your chart image — not repeated in text.)
III. Cross-Asset Signals
Yields keep the Dollar capped.
Equities supported but fragile.
Gold softer despite elevated volatility.
Flows lean cautious.
Global risk = neutral-to-defensive.
IV. Core Drivers
• Dollar behavior inside a neutral environment
• Yield stability across the curve
• Equity sensitivity with elevated volatility
• London open → London fix → U.S. session flow
V. Execution Notes — PEM Logic
Follow higher-timeframe direction
Ignore early-session noise
Wait for structure + flow alignment
Act only on confirmation
Summary
Neutral Dollar, stretched risk, elevated volatility — London opens in a cautious, event-driven environment.
— CORE5DAN
Institutional Logic. Modern Technology. Real Freedom.
