BITCOIN/GOLD BITCOIN/GOLD 🌊
Physical gold vs. Digital gold
2010: 1 BTC 0.0001 GOLD
2025: 1 BTC 27.9 GOLD
Commodities

USOIL | 4H | SWING TRADING Good morning, dear friends
Due to high demand, I’ve prepared a USOIL analysis for you. My target level is set at 63.600.
Once my target is reached, I’ll be sharing updates under this post.
Dear friends, your likes are always my biggest motivation to keep sharing analyses. That’s why I kindly ask each of my followers to show their support—please don’t hold back on the likes.
I sincerely thank everyone who supports me with their likes. It truly means a lot

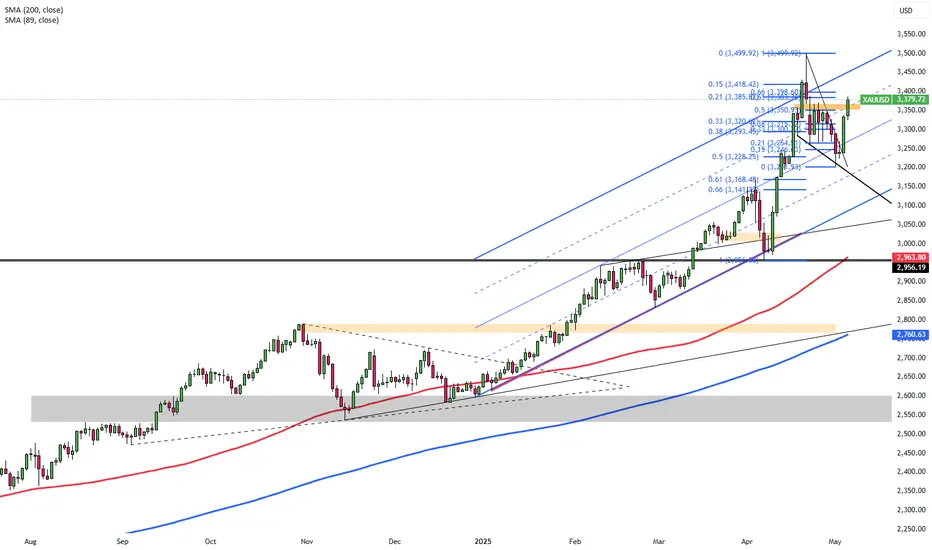
Gold Climbs on Safe-Haven DemandGold climbed to nearly $3,360 per ounce on Tuesday, marking its highest level in over a week, as renewed tariff threats from President Trump increased safe-haven demand. Trump announced a 100% tariff on foreign films and signaled upcoming measures targeting pharmaceuticals. Investors are now focused on the Federal Reserve’s policy decision, with rates expected to stay unchanged despite Trump’s push for cuts.
Resistance is expected at $3,385, then $3,450 and $3,500. Support stands at $3,300, followed by $3,265 and $3,200.
Whats the direction for the Week? We should wait to see...Looking for price to go Bullish...But i need to allow Monday to play out first to give us a solid direction. They could go bullish early or they could pull back to give a lower entry first.

There are short-selling opportunities in gold in the short term!
After gold rebounded, there was strong pressure around 3315, so it was a short opportunity, sl: 3325, tp: 3290

Silver – Bearish Move Toward Support🧠 Market Overview:
Instrument: Likely Silver (based on file name).
Chart Context: The price is currently trading below both the 50 EMA (red) and 200 EMA (blue), indicating bearish momentum and a possible shift in market structure.
📊 Key Technical Components:
🔹 Exponential Moving Averages (EMA):
50 EMA (32.614) is above the 200 EMA (32.526) but both are above the current price.
This crossover is recent and could indicate the beginning of a larger downtrend if confirmed by continued price action below both EMAs.
🔹 Market Structure:
POI (Point of Interest) marks a previous swing high where selling pressure emerged.
The chart shows internal liquidity (INT.LQ) sweeps both above and below consolidation areas, hinting at smart money manipulation to grab liquidity before making a move.
🔹 Resistance Zone:
Clearly defined between approx. 33.4–34.0, where price was rejected after a failed attempt to break higher.
Multiple rejections from this zone show strong selling pressure.
🔹 Support Zone:
Sitting between approx. 30.8–31.2.
Price previously consolidated here before a bullish move, making it a likely target for a return test or a potential bounce.
📉 Bearish Scenario & Projection:
The price broke below a short-term structure and failed to hold above EMAs.
The current price action shows a bearish pullback likely to form a Lower High (LH).
The projected path shows a pullback to previous support-turned-resistance, followed by a breakdown targeting the support zone.
✅ Bias:
Short-term bias: Bearish
Medium-term bias: Bearish, unless price reclaims the 200 EMA and consolidates above the resistance zone.
🔍 Confluences Supporting Bearish Outlook:
Price below EMAs (dynamic resistance).
Failed higher highs with liquidity sweeps (indicating smart money selling).
Clear market structure shift to the downside.
Anticipated retest of support zone around 30.8–31.2.

Gold price suddenly accelerates, approaching the 3,300 USD/ounceAfter two consecutive weeks of decline, the world gold price is showing strong signs of recovery when it skyrocketed to 3,266 USD/ounce - an increase of 25 USD in just one session. Although still quite far from the peak of 3,500 USD/ounce, the increase this morning shows that investor sentiment has begun to change direction.
The increase occurred at the beginning of the session despite previous negative forecasts, reflecting the sensitivity of gold to geopolitical and economic information such as US-China trade negotiations or the strength of the USD. The daily chart shows that gold has bounced strongly from the EMA34 support zone and returned to the resistance zone around 3,320–3,340 USD, opening up an opportunity to retest the 3,400 USD mark if the current increase is maintained.

SILVER Set To Grow! BUY!
My dear subscribers,
My technical analysis for SILVER is below:
The price is coiling around a solid key level - 32.014
Bias - Bullish
Technical Indicators: Pivot Points Low anticipates a potential price reversal.
Super trend shows a clear buy, giving a perfect indicators' convergence.
Goal - 32.660
My Stop Loss - 31.682
About Used Indicators:
By the very nature of the supertrend indicator, it offers firm support and resistance levels for traders to enter and exit trades. Additionally, it also provides signals for setting stop losses
Disclosure: I am part of Trade Nation's Influencer program and receive a monthly fee for using their TradingView charts in my analysis.
———————————
WISH YOU ALL LUCK

Can it hit the bottom and rebound?Fundamental Analysis: Driven by the trade concerns sparked by Trump and the risk aversion sentiment arising from the global economic slowdown, the trajectory of oil prices has been shaped. Additionally, OPEC+ convened an early meeting on Saturday and confirmed an increase in production of 411,000 barrels per day in June. This decision has indubitably intensified the market's apprehensions regarding the oversupply of crude oil 📉.
Technical Analysis: Technically speaking, the price of crude oil has persistently lingered below the midline of the Bollinger Bands, distinctly indicating that the bearish trend is in the ascendancy 📉. Last week, on the weekly chart, it closed with a substantial bearish candlestick, exhibiting a downward tail pattern, and in the short term, the price has been fluctuating within a trading range 📊. As for the upcoming week's trend, whether the support level established by the previous double doji bottoming formation will be broken through effectively will be the focal point of market attention 👀. Nevertheless, once the price reaches the crucial support level, there exists the potential for a technical rebound. Investors should closely monitor the variations in trading volume and the response of the moving average system 📈.
Market Situation: It is crucial to note that due to the holiday factor in the Asian market next Monday, market liquidity is anticipated to decline significantly. Under such circumstances, the oil price is likely to encounter a higher risk of more pronounced volatility, further escalating the uncertainty of the market situation ⚠️.
⚡⚡⚡ USOIL ⚡⚡⚡
🚀 Buy@56.0 - 57.0
🚀 TP 59.0 - 60.0
Accurate signals are updated every day 📈 If you encounter any problems during trading, these signals can serve as your reliable guide 🧭 Feel free to refer to them! I sincerely hope they'll be of great help to you 🌟

How to plan when gold’s rise encounters resistance🗞News side:
1. Pay attention to the recent trade situation and news about the Fed's interest rate cuts
2. Be wary of DXY trends
3. The situation of the Russian-Ukrainian war and the follow-up events of the India-Pakistan conflict
4.Trump imposes 100% tariff on non-US films
📈Technical aspects:
Compared with today's market, the morning rise happened to be a sideways price, breaking through the previous high point. In a volatile rise, it doesn't matter. It is very likely that in the later trend, the price will return to the starting point or even lower, but it can continue to rise. This is a feature of the shock. At the same time, the current market is not extremely strong, and it is still in a volatile rise. Therefore, do not chase long, but retrace as much support as possible.
🎁SELL 3315-3325
🎁TP 3280-3270
🎁BUY 3270-3280
🎁TP 3300-3310
If you agree with this point of view, or you have a better idea, please leave a message in the comment area. I look forward to hearing different voices.
OANDA:XAUUSD FX:XAUUSD FXOPEN:XAUUSD FOREXCOM:XAUUSD TVC:GOLD

GOLD - Bearish Head and ShouldersHello Traders !
The GOLD price formed a head and shoulders pattern.
Currently, The neckline is broken !
So, I expect a bearish move📉
_______________
TARGET: 3170🎯

GOLD SENDS CLEAR BEARISH SIGNALS|SHORT
GOLD SIGNAL
Trade Direction: short
Entry Level: 3,270.07
Target Level: 3,197.87
Stop Loss: 3,317.86
RISK PROFILE
Risk level: medium
Suggested risk: 1%
Timeframe: 2h
Disclosure: I am part of Trade Nation's Influencer program and receive a monthly fee for using their TradingView charts in my analysis.
✅LIKE AND COMMENT MY IDEAS✅

GOLD Will Grow! Buy!
Please, check our technical outlook for GOLD.
Time Frame: 4h
Current Trend: Bullish
Sentiment: Oversold (based on 7-period RSI)
Forecast: Bullish
The market is approaching a key horizontal level 3,257.82.
Considering the today's price action, probabilities will be high to see a movement to 3,352.14.
P.S
We determine oversold/overbought condition with RSI indicator.
When it drops below 30 - the market is considered to be oversold.
When it bounces above 70 - the market is considered to be overbought.
Disclosure: I am part of Trade Nation's Influencer program and receive a monthly fee for using their TradingView charts in my analysis.
Like and subscribe and comment my ideas if you enjoy them!

"US Oil Spot / WTI" Energy Market Heist Plan (Scalping/Day)🌟Hi! Hola! Ola! Bonjour! Hallo! Marhaba!🌟
Dear Money Makers & Robbers, 🤑 💰💸✈️
Based on 🔥Thief Trading style technical and fundamental analysis🔥, here is our master plan to heist the "US Oil Spot / WTI" Energy Market. Please adhere to the strategy I've outlined in the chart, which emphasizes long entry. Our aim is to escape near the high-risk MA Zone. Risky level, overbought market, consolidation, trend reversal, trap at the level where traders and bearish robbers are stronger. 🏆💸"Take profit and treat yourself, traders. You deserve it!💪🏆🎉
Entry 📈 : "The vault is wide open! Swipe the Bullish loot at any price - the heist is on!
however I advise to Place buy limit orders within a 15 or 30 minute timeframe nearest or swing low or high level for pullback entries.
Stop Loss 🛑:
📍 Thief SL placed at the recent/swing low level Using the 3H timeframe (60.50) Day/Scalping trade basis.
📍 SL is based on your risk of the trade, lot size and how many multiple orders you have to take.
🏴☠️Target 🎯: 68.70
💰💵💴💸"US Oil Spot / WTI" Energy Market Heist Plan (Day / Scalping Trade) is currently experiencing a bullishness🐂.., driven by several key factors.☝☝☝
📰🗞️Get & Read the Fundamental, Macro Economics, COT Report, Seasonal Factors, Intermarket Analysis, Inventory and Storage Analysis, Future trend targets with targets... go ahead to check 👉👉👉🔗🔗
⚠️Trading Alert : News Releases and Position Management 📰 🗞️ 🚫🚏
As a reminder, news releases can have a significant impact on market prices and volatility. To minimize potential losses and protect your running positions,
we recommend the following:
Avoid taking new trades during news releases
Use trailing stop-loss orders to protect your running positions and lock in profits
💖Supporting our robbery plan 💥Hit the Boost Button💥 will enable us to effortlessly make and steal money 💰💵. Boost the strength of our robbery team. Every day in this market make money with ease by using the Thief Trading Style.🏆💪🤝❤️🎉🚀
I'll see you soon with another heist plan, so stay tuned 🤑🐱👤🤗🤩

Analysis of the latest gold trend on May 5:
Core logic analysis
Impact of non-farm data:
The 177,000 new jobs in April exceeded expectations, but the downward revision of historical data (revised from 228,000 to 185,000 in March) weakened the absolute positive of the data, showing that the resilience of the labor market contains implicit fluctuations.
The slowdown in hourly wage growth (0.2% lower than expected month-on-month) eased inflationary pressure, and the market continued to play the game on the Fed's expectations of rate cuts. Gold rebounded after short-term pressure, reflecting the long-short tug-of-war.
Key technical signals:
The shock range is established: 3240-3270 US dollars is the short-term long-short balance range, and the breakthrough direction determines the medium-term trend.
Signs of momentum conversion: 1-hour moving average dead cross but turn, if it stands firm at 3265-3270 resistance, it may trigger short covering to promote the rise; on the contrary, if it falls below 3220-3215 support, it will open up space for continued decline.
Closing price guidance: On Friday (May 2), the market bottomed out and rebounded to close at around 3240, showing buying support below, but the trend is still unclear before the resistance is effectively broken.
Trading strategy suggestions
1. Short-term shock market (not breaking through the range)
High: 3260-3265 light position short test, stop loss 3272, target 3240-3230.
Low long: 3225-3220 batch long orders, stop loss 3215, target 3245-3255.
Reason: The market sentiment is cautious after the non-agricultural data, and the high-selling and low-buying within the range need to strictly stop losses.
2. Breakthrough market response
Break above 3270: follow up long orders at 3260-3255, stop loss 3250, target 3280-3300.
Logic: After the breakthrough, confirm that the bulls are dominant, or test the previous high pressure level.
Breaking below 3215: short near rebound 3225, stop loss 3232, target 3200-3180.
Logic: Open the downward channel, may test the support of the April low.
Key risk reminder
Fed policy expectations: Before the June interest rate decision, economic data (especially inflation) may cause sharp fluctuations.
Geopolitics: The escalation or easing of the situation in the Middle East will directly impact the safe-haven properties of gold.
Dollar linkage: If the US dollar index returns to above 101, it will suppress the rebound space of gold.

USOIL Today's strategyFrom a technical perspective, if USOIL can take advantage of the weakening of the DXY, stabilize and rebound near the current price, and break through the key resistance level, it may be able to form an upward trend. However, if it fails to effectively withstand the impact of the production increase by OPEC+, and breaks below the key support level, the price is likely to decline further.
Currently, it is necessary to closely monitor the competition around the price level of $55. If this level can be held, the probability of a rebound will increase. Once it is broken, the next support level may be around the $53 area. At the same time, continuously tracking the trend of the DXY and the subsequent policy dynamics of OPEC+ is of vital importance for judging the future trend of USOIL.
USOIL
buy@55-56
tp:57.5-58.5
I am committed to sharing trading signals every day. Among them, real-time signals will be flexibly pushed according to market dynamics. All the signals sent out last week accurately matched the market trends, helping numerous traders achieve substantial profits. Regardless of your previous investment performance, I believe that with the support of my professional strategies and timely signals, I will surely be able to assist you in breaking through investment bottlenecks and achieving new breakthroughs in the trading field.

Bullish continuation?The Gold (XAU/USD) is falling towards the pivot which lines up with the 61.8% Fibonacci support and could bounce to the 1st resistance which acts as a pullback resistance.
Pivot: 3,148.98
1st Support: 3,051.82
1st Resistance: 3,430.57
Risk Warning:
Trading Forex and CFDs carries a high level of risk to your capital and you should only trade with money you can afford to lose. Trading Forex and CFDs may not be suitable for all investors, so please ensure that you fully understand the risks involved and seek independent advice if necessary.
Disclaimer:
The above opinions given constitute general market commentary, and do not constitute the opinion or advice of IC Markets or any form of personal or investment advice.
Any opinions, news, research, analyses, prices, other information, or links to third-party sites contained on this website are provided on an "as-is" basis, are intended only to be informative, is not an advice nor a recommendation, nor research, or a record of our trading prices, or an offer of, or solicitation for a transaction in any financial instrument and thus should not be treated as such. The information provided does not involve any specific investment objectives, financial situation and needs of any specific person who may receive it. Please be aware, that past performance is not a reliable indicator of future performance and/or results. Past Performance or Forward-looking scenarios based upon the reasonable beliefs of the third-party provider are not a guarantee of future performance. Actual results may differ materially from those anticipated in forward-looking or past performance statements. IC Markets makes no representation or warranty and assumes no liability as to the accuracy or completeness of the information provided, nor any loss arising from any investment based on a recommendation, forecast or any information supplied by any third-party.

GOLD - Is this the end of the Bull Run?Gold has once again followed my previous analysis — turning bearish right at key levels! 🚩 After an incredible bull run where price kept making new highs, signs are now pointing to a possible top. We could be entering a short-term bearish phase here, with potential for a deeper correction if momentum builds.
Right now, I’m holding a bearish bias. I’ll be watching for solid sell setups, especially around those well-defined resistance zones. There’s also an unfilled gap below that could attract price action — keep an eye on that level (chart shows the zone clearly 🔎).
I’ll be looking for confirmation through structure breaks and clean retests before entering shorts.
What’s your take — are we seeing a reversal brewing, or is this just a dip before the next leg up? Drop your thoughts below!
If this analysis helps, a boost or follow would mean a lot — and keeps you in the loop for the next moves! 🚀

#202518 - priceactiontds - weekly update - oilGood Evening and I hope you are well.
comment: Bears defended the breakout area and kept the market in a bear trend. Bulls tried to print a higher low with a decent bull reversal bar on Thursday. Now what? No idea. Oil below 60 is a big thing and staying below is somewhat low probability, given the past 6 years. The chart is still pretty bearish and if you want to be a bull and look at this, would you be thrilled to buy it at 58? I’m not sure. If you could hold below 53 and add lower as well, sure but as of now, bulls have not done enough to convice me this is a credible bottom.
current market cycle: trading range on monthly tf and bear trend on the daily
key levels: 54 - 65
bull case: Bulls want to keep Thursday the higher low and go up from here. Above 60 they are slightly favored to test 62/64 again but one could also draw another bear trend line from 71.66 to 63.9 from last Monday. So buying here is not favorable, no matter how you look at this chart. Only above 65 do bulls take control again and can test the next bigger bear trend line around 67.
Invalidation is below 54.
bear case: Bears kept the bounce around the breakout area from the W1 low. Now they need to make lower lows to confirm the acceleration of this bear trend. If they fail, this will become fuel for the bulls to test back up to either 67 or even the W2 high at 71.66. My line in the sand for the bears is a daily bull bar close above the daily 20ema. If bulls can get that, I think more bears will give up. Until then, bears are slightly favored, especially below 56.29 to test 54.48 again.
Invalidation is a daily close above 62 and for sure anything above 65.
short term: Neutral around 58. Below 56.29 I think we can do 54.48 or lower and above 62 I expect more upside for 64 or higher.
medium-long term - Update from 2025-04-27: This does look like another bear trap below 60, which was to be expected.

Silver is Again in the Bullish directionHello Traders
In This Chart XAGUSD HOURLY Forex Forecast By FOREX PLANET
today XAGUSD analysis 👆
🟢This Chart includes_ (XAGUSD market update)
🟢What is The Next Opportunity on XAGUSD Market
🟢how to Enter to the Valid Entry With Assurance Profit
This CHART is For Trader's that Want to Improve Their Technical Analysis Skills and Their Trading By Understanding How To Analyze The Market Using Multiple Timeframes and Understanding The Bigger Picture on the Charts

A Preliminary Double Bottom Support Pattern May Be FormingCurrently, factors such as geopolitics, OPEC+ policies, and the trend of the US dollar all have a two-sided impact on USOIL. Only the technical aspect reveals directional signals.
This week, the crude oil price rebounded rapidly after hitting a low of $56. It has formed the embryonic form of a double bottom with the previous low point, and this pattern may become a turning point in the market trend. According to the theory we proposed earlier, "A deep correction breeds a strong rebound," the price of $56 has become a key support level. If the oil price stabilizes at this level next week, the double bottom pattern is expected to be confirmed, which will in turn trigger a technical rebound. Conversely, once this key level is effectively broken, it is likely to trigger a concentrated sell-off of stop-loss orders, intensifying the downward pressure on the price.
I am committed to sharing trading signals every day. Among them, real-time signals will be flexibly pushed according to market dynamics. All the signals sent out last week accurately matched the market trends, helping numerous traders achieve substantial profits. Regardless of your previous investment performance, I believe that with the support of my professional strategies and timely signals, I will surely be able to assist you in breaking through investment bottlenecks and achieving new breakthroughs in the trading field.

Oil on high time frame
"Regarding WTI oil, the price trend on high time frames is bearish, especially on the daily chart. After completing its pullback on the 4-hour chart, there are indications of further downside potential.
The market's volatility may be influenced by geopolitical tensions and political factors between Iran and the USA, as well as tariff issues. Despite these fluctuations, candle formations suggest the potential for prices to drop towards the $58 zone."
If you require more assistance or have any specific questions, feel free to ask!

BUYS For the Markets. Wait for BUYS in Gold and Silver.In this video, we will analyze the S&P 500, NASDAQ, DOW JONES, Gold and Silver futures, for the week of May 5 - 9th.
The Indices are moving higher, and it's buys until they are not. Simple.
Gold is near potential support at 3201. This may present a great buying opportunity once the lows are swept. A weakened USD will help this cause.
Silver has made a bearish market structure shift (MSS), so buys are not yet on the table. If it disrespects a Daily -FVG, then sells are warranted. It is considerably weaker than Gold.
Enjoy!
May profits be upon you.
Leave any questions or comments in the comment section.
I appreciate any feedback from my viewers!
Like and/or subscribe if you want more accurate analysis.
Thank you so much!
Disclaimer:
I do not provide personal investment advice and I am not a qualified licensed investment advisor.
All information found here, including any ideas, opinions, views, predictions, forecasts, commentaries, suggestions, expressed or implied herein, are for informational, entertainment or educational purposes only and should not be construed as personal investment advice. While the information provided is believed to be accurate, it may include errors or inaccuracies.
I will not and cannot be held liable for any actions you take as a result of anything you read here.
Conduct your own due diligence, or consult a licensed financial advisor or broker before making any and all investment decisions. Any investments, trades, speculations, or decisions made on the basis of any information found on this channel, expressed or implied herein, are committed at your own risk, financial or otherwise.
