April 17, 2025 - Powell, Japan & TrumpHello everyone, it’s April 17, 2025. Yesterday’s U.S. trading was pure market carnage. Semiconductors ( NASDAQ:NVDA , NASDAQ:AMD , NASDAQ:ASML ) were steamrolled as AI chip bans to China kicked in and Trump dropped another tariff bomb, hiking duties to 245%. That wiped $200 billion off Nvidia alone.
In Chicago, Powell stoked the flames, warning tariffs will fuel inflation and choke growth, and insisted he’s in no rush to cut rates. The CME_MINI:NQ1! tumbled 3%, the CME_MINI:SOX1! lost 4.1%, and bond futures plunged.
This morning, U.S. futures are up about 0.75% on headlines that Trump’s talks with Japanese negotiators are “going very well,” sparking rallies across Asia: Nikkei +1%, Hong Kong +2.7%, Shanghai +1%. It seems even a whiff of détente with Japan sends everyone scrambling back into risk assets.
On commodities, BLACKBULL:WTI jumps to $63.35 amid fresh U.S. sanctions on Iran and OPEC output cuts; OANDA:XAUUSD rockets to $3,352 /oz; INDEX:BTCUSD hovers near $83,500.
Today watch the ECB’s rate cut, Powell’s next speech, Philly Fed and jobless claims before the Good Friday shutdown. With Trump’s erratic tariff theatrics and Powell’s warning of higher inflation and slower growth, volatility is set to reign supreme. Buckle up.
Commodities

USDJPY / 1 DAY / BULLHello Guys;
My USDJPY target level is 147,500.
My target may come a bit late because this trade is a swing trade.
I would appreciate it very much if you do not miss your likes within the framework of Respect for Labor Thank you very much in advance

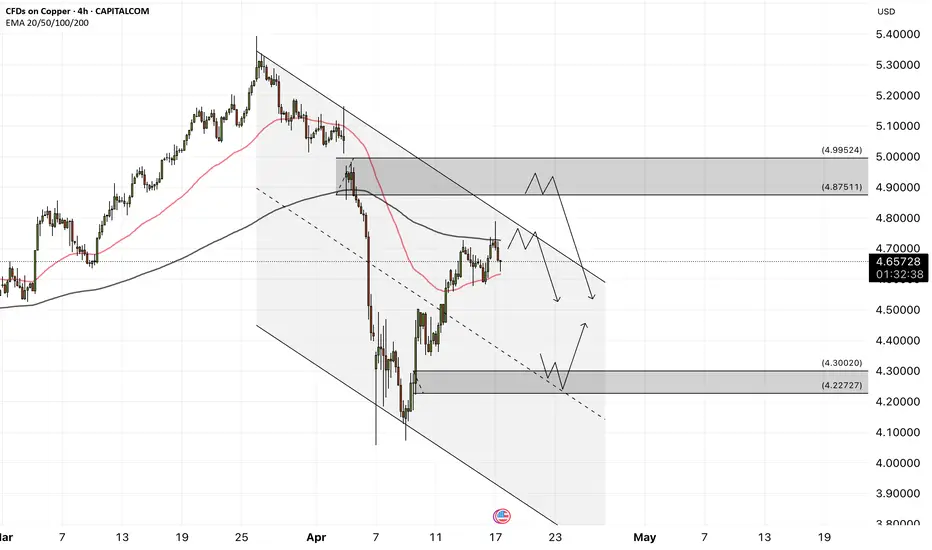
Copper: Markets are waiting for the continuation of trade tensioCopper is located between the EMA200 and EMA50 on the 4-hour timeframe and is moving in its descending channel. An upward correction of copper will provide us with a good risk-reward selling position. If the downward trend continues, we can buy copper at the next demand zone.
The World Trade Organization (WTO) has significantly downgraded its outlook for global merchandise trade in its latest report, now forecasting a 0.2% contraction in 2025. Previously, it had projected a 3% growth. The organization warned that if the United States fully enforces its reciprocal tariffs and their effects intensify, global trade could shrink by as much as 1.5%.
While the temporary suspension of some tariffs recently announced by Washington has somewhat eased the downturn in trade, the WTO emphasized that substantial downside risks remain. However, for 2026, the organization painted a more optimistic picture, anticipating a moderate 2.5% rebound in trade growth.
In a pointed address, Chinese Vice Premier He Lifeng sent a clear message to the international community, especially the U.S., asserting that China has no intention of backing down and will stand firm if its interests are threatened. His remarks came as a new wave of heavy U.S. tariffs—including duties as high as 245% on certain Chinese exports—has reignited tensions between the two economic powers.
He Lifeng affirmed that China remains a reliable trade partner for the world. He also announced increased government support for Chinese businesses engaged in foreign trade and encouraged them to leverage opportunities at the Canton Fair and explore broader global markets. According to him, China’s vast domestic market could become a key destination for high-quality imported goods.
Alongside these economic and diplomatic messages, Chinese officials’ rhetoric has turned more confrontational in response to recent U.S. actions. He dismissed what he called the U.S.’s “numerical games” and warned that China’s response to threats would be decisive. Stressing the importance of a healthy business environment, he urged officials to implement supportive policies effectively, ensuring foreign trade and economic activity proceed with greater transparency, efficiency, and ease.
Meanwhile, the global maritime shipping industry has entered a concerning phase. New data from Vizion shows that bookings for shipments to the U.S. have sharply declined following the implementation of new tariffs by the American government.
This sudden drop occurred just one week after the tariffs were imposed and reflects how businesses are reacting to deep policy uncertainty. High-traffic routes such as Shanghai to Los Angeles—which typically take 20–30 days—and routes through the Panama Canal to New York—which add another 15 days—have seen notable declines in bookings. This downturn is occurring precisely when summer orders should be peaking.
The data clearly indicates that the anticipated decline in U.S. port volumes will materialize soon and with greater intensity in May. The plunge in bookings is sounding alarms not just for importers and retailers but also for the broader logistics industry, ports, and even Asian manufacturers, potentially leading to a slowdown in all these sectors.
In parallel, Deutsche Bank’s latest report sharply downgraded the U.S. economic growth forecast for 2025 while raising inflation projections, signaling a shift in the bank’s analysis toward a stagflation scenario.
According to the report, U.S. GDP is expected to grow by only 0.9% on a quarterly basis in 2025—markedly lower than earlier estimates. Key factors behind this revision include trade tariffs, policy uncertainty, and tighter financial conditions. The new wave of tariffs, particularly those targeting Chinese imports, has been cited as a major driver of renewed inflationary pressures.
On the monetary front, Deutsche Bank warned that the abrupt economic policies of the U.S. administration have created unprecedented instability in the global financial system—an impact that will likely persist even if some tariffs are temporarily rolled back. The report also raised concerns about the future of the U.S. dollar as the world’s reserve currency and suggested that the country’s ability to finance its growing fiscal deficits could be seriously undermined.
XAU/USD) Flag Analysis Read The ChaptianSMC Trading point update
Analysis presents a bullish outlook for XAU/USD (Gold vs USD) on the 1-hour timeframe, based on Smart Money Concepts (SMC). Here’s a breakdown of the key elements:
---
Key Analysis Points:
1. Order Block + Key Support Zone:
Price recently tapped into a bullish order block around the $3,166.74–$3,208.62 zone.
This area is also marked as a "key support level", suggesting a strong demand zone.
The confluence of the Fair Value Gap (FVG) and order block gives this zone higher validity for potential reversal.
2. Bullish Market Structure:
The chart shows higher highs and higher lows, indicating a bullish trend.
Price action broke above a small consolidation, showing bullish momentum is resuming.
3. Projected Target:
The target point is set at $3,283.01, suggesting about a 55-point upside from the current price.
This target sits above a previous high, indicating anticipation of a liquidity grab or breakout.
4. RSI (Relative Strength Index):
RSI is at 57.94, which is a neutral-to-bullish zone. It supports the idea that there's still room for price to move up before being overbought.
5. EMA 200 (Exponential Moving Average):
The price is well above the 200 EMA, confirming a bullish bias in the higher timeframe.
Mr SMC Trading point
---
Possible Strategy:
Long (Buy) Entry Zone: Between $3,166–$3,208 (ideal near the order block/FVG).
Target: $3,283
Stop Loss: Below the order block, ideally below $3,166 to avoid getting wicked out.
---
Final Thoughts:
This is a well-structured bullish setup based on institutional concepts like order blocks and FVGs. The price is aligned with the trend, and RSI supports more upside. However, watch for any major news catalysts (especially with those economic event icons shown).
Pales support boost 🚀 analysis follow)

DeGRAM | GOLD Growth in the Channel📊 Technical Analysis
- Uptrending channel
XAU/USD steadily climbs within a clear ascending channel, rebounding from support towards resistance.
- Key resistance
Main barrier at $3225; a breakout here confirms bullish momentum.
- Predictive scenario
Breaking $3225 opens doors for further upward movement.
💡 Fundamental Analysis
Trump's imposition of trade duties, has caused geopolitical instability, which has contributed to further demand for GOLD.
✨ Summary
Positive technical setup combined with supportive fundamentals. Break above $3225 signals continued bullish momentum!
-------------------
Share your opinion in the comments and support the idea with a like. Thanks for your support!

Gold at strong resistanceGold now has reached to a very strong resistance at about 3350 which is a trend line in the past and can work as a strong resistance now

GLD Weekly Options Trade Plan 2025-04-16GLD Weekly Analysis Summary (2025-04-16)
Below is a consolidated view of the various model reports and our resulting trade rationale:
──────────────────────────────
Comprehensive Summary of Each Model’s Key Points
• Grok/xAI Report – Notes that GLD closed around $306.52 with recent upward momentum and bullish daily indicators. – Technicals (moving averages, Bollinger Bands, and MACD on daily charts) support a moderately bullish bias despite some near-term caution from 5‑minute signals. – Recommends buying the $311 call (premium ~ $0.99) with a plan to exit if the price breaks key support or slides 20% in premium.
• Claude/Anthropic Report – Highlights strong daily uptrend fundamentals with GLD well above its key moving averages, although the daily RSI is high (76.59) which raises a caution flag. – Points to robust call open interest at nearby strikes ($310) and suggests a bullish trade via the call option—even though a slightly lower strike ($310) is mentioned, the overall picture is bullish. – The recommended entry is at market open with a target around a 50% premium gain and a stop if the premium retracts significantly.
• Gemini/Google Report – Emphasizes strong longer‐term bullish momentum but expresses caution given immediate overbought conditions (daily RSI above 70 and price trading above the upper Bollinger Band). – Also notes the strangely low max pain ($275) in contrast to the current price, warning of potential early pullbacks. – Concludes that the overall picture is too conflicted to recommend a trade at the open at this time.
• Llama/Meta Report – Combines technical indicators (EMA, RSI, Bollinger Bands) with strong news sentiment to determine GLD is in a bullish phase. – Identifies the $311 call (premium ~$0.99) as attractive given its liquidity and distance from the current price (about 1.46% above). – Recommends market-open entry with targets set at roughly 150% of the premium and stop-loss based on a percentage of the premium.
• DeepSeek Report – Provides a balanced trade plan noting the very strong 30‑day price performance and bullish daily MACD while cautioning on the overbought RSI reading. – Recommends the $311 call (midpoint premium ~$0.99) with a profit target of roughly a 50% gain and a stop tied to technical support breaks (around $304.90). – Maintains a moderate confidence level (around 65%) because of the chance that short‑term pullbacks may materialize.
────────────────────────────── 2. Areas of Agreement and Disagreement
• Agreement: – Most models agree on an underlying moderately bullish trend for GLD based on daily technical indicators and positive news (e.g., fund inflows and safe‑haven demand). – A majority favor a call option trade on the weekly expiry, with many models arriving at the vicinity of the $311 strike (with premiums around $0.99) as an optimal entry.
• Disagreement: – The Gemini/Google report raises concerns about overbought conditions on the daily chart and highlights a very low max pain level that suggests downside pressure, recommending against an immediate open trade. – Claude mentions a slightly lower strike ($310) but still a call trade; however, the bulk of reports lean toward the $311 call as a balanced choice, accepting the premium being a bit above the ideal $0.30–$0.60 range.
────────────────────────────── 3. Conclusion and Trade Recommendation
Overall Market Direction Consensus: Most models point to an overall moderately bullish outlook on GLD. While the daily trend is robust, some short‑term technicals (e.g., the overbought RSI and near-term MACD signs) advise caution. Nevertheless, the prevailing momentum and strong news sentiment favor a bullish call—even if a temporary pullback remains possible.
Recommended Trade: Trade Idea: Buy a single‑leg, naked CALL option on GLD. • Strike: $311.00 (this strike shows sufficient liquidity with about 1,055 open interest and a traded premium of roughly $0.99) • Expiration: Weekly options expiring 2025‑04‑17 • Premium: ~ $0.99 (slightly above the ideal range, but justified by good risk/reward and high liquidity) • Entry Timing: At the open • Profit Target: Approximately a 50% increase (target premium ~ $1.50) • Stop Loss: Approximately 20% drop in the premium (≈ $0.79) • Confidence Level: Moderately confident (≈70%) given the bullish trend tempered by the risk of an intraday pullback • Key Risks/Considerations: – The daily RSI is in overbought territory, so be alert for any pullback. – The inherent conflict with the very low max pain point ($275) suggests potential short-term volatility. – Monitor support levels (e.g., $304.90 on the 5‑minute chart) for early signs of reversal.
────────────────────────────── 4. TRADE_DETAILS (JSON Format)
{ "instrument": "GLD", "direction": "call", "strike": 311.0, "expiry": "2025-04-17", "confidence": 0.70, "profit_target": 1.50, "stop_loss": 0.79, "size": 1, "entry_price": 0.99, "entry_timing": "open" }
Disclaimer: This newsletter is not trading or investment advice but for general informational purposes only. This newsletter represents my personal opinions based on proprietary research which I am sharing publicly as my personal blog. Futures, stocks, and options trading of any kind involves a lot of risk. No guarantee of any profit whatsoever is made. In fact, you may lose everything you have. So be very careful. I guarantee no profit whatsoever, You assume the entire cost and risk of any trading or investing activities you choose to undertake. You are solely responsible for making your own investment decisions. Owners/authors of this newsletter, its representatives, its principals, its moderators, and its members, are NOT registered as securities broker-dealers or investment advisors either with the U.S. Securities and Exchange Commission, CFTC, or with any other securities/regulatory authority. Consult with a registered investment advisor, broker-dealer, and/or financial advisor. By reading and using this newsletter or any of my publications, you are agreeing to these terms. Any screenshots used here are courtesy of TradingView. I am just an end user with no affiliations with them. Information and quotes shared in this blog can be 100% wrong. Markets are risky and can go to 0 at any time. Furthermore, you will not share or copy any content in this blog as it is the authors' IP. By reading this blog, you accept these terms of conditions and acknowledge I am sharing this blog as my personal trading journal, nothing more.

Cocoa's Future: Sweet Commodity or Bitter Harvest?The global cocoa market faces significant turbulence, driven by a complex interplay of environmental, political, and economic factors threatening price stability and future supply. Climate change presents a major challenge, with unpredictable weather patterns in West Africa increasing disease risk and directly impacting yields, as evidenced by farmer reports and scientific studies showing significant yield reductions due to higher temperatures. Farmers warn of potential crop destruction within the decade without substantial support and adaptation measures.
Geopolitical pressures add another layer of complexity, particularly regarding farmgate pricing in Ghana and Côte d'Ivoire. Political debate in Ghana centres on demands to double farmer payments to align with campaign promises and counter the incentive for cross-border smuggling created by higher prices in neighbouring Côte d'Ivoire. This disparity highlights the precarious economic situation for many farmers and the national security implications of unprofitable cocoa cultivation.
Supply chain vulnerabilities, including aging trees, disease prevalence like Swollen Shoot Virus, and historical underinvestment by farmers due to low prices, contribute to a significant gap between potential and actual yields. While recent projections suggest a potential surplus for 2024/25 after a record deficit, pollination limitations remain a key constraint, with studies confirming yields are often capped by insufficient natural pollination. Concurrently, high prices are dampening consumer demand and forcing manufacturers to consider reformulating products, reflected in declining cocoa grinding figures globally.
Addressing these challenges necessitates a multi-pronged approach focused on sustainability and resilience. Initiatives promoting fairer farmer compensation, longer-term contracts, agroforestry practices, and improved soil management are crucial. Enhanced collaboration across the value chain, alongside government support for sustainable practices and compliance with new environmental regulations, is essential to navigate the current volatility and secure a stable future for cocoa production and the millions who depend on it.

Gold Trading Zones: 17-APRIL-2025Gold trading made easier: Explore today's zones and refine your strategy.

Silver Ascending TriangleA triangle that extends waayyy back into the 1900s
Price should break out of this triangle in a magnificent way
Should follow gold in my opinion
Monthly chart

"SOYBEAN" Commodities CFD Market Bearish Heist (Swing/Day Trade)🌟Hi! Hola! Ola! Bonjour! Hallo! Marhaba!🌟
Dear Money Makers & Robbers, 🤑 💰💸✈️
Based on 🔥Thief Trading style technical and fundamental analysis🔥, here is our master plan to heist the 🥔🍀🍃SOYBEAN🍃🥔🍀 Commodities CFD Market. Please adhere to the strategy I've outlined in the chart, which emphasizes long entry. Our aim is to escape near the high-risk MA Zone. Risky level, overbought market, consolidation, trend reversal, trap at the level where traders and bearish robbers are stronger. 🏆💸"Take profit and treat yourself, traders. You deserve it!💪🏆🎉
Entry 📈 : "The vault is wide open! Swipe the Bullish loot at any price - the heist is on!
however I advise to Place buy limit orders within a 15 or 30 minute timeframe nearest or swing low or high level for pullback entries.
Stop Loss 🛑:
📍 Thief SL placed at the recent/swing low level Using the 30mins timeframe (1015) Day trade basis.
📍 SL is based on your risk of the trade, lot size and how many multiple orders you have to take.
🏴☠️Target 🎯: 1060 (or) Escape Before the Target
🧲Scalpers, take note 👀 : only scalp on the Long side. If you have a lot of money, you can go straight away; if not, you can join Day traders and carry out the robbery plan. Use trailing SL to safeguard your money 💰.
🥔🍀🍃"SOYBEAN"🍃🥔🍀Commodities CFD Market Heist Plan (Swing/Day) is currently experiencing a bullishness,., driven by several key factors.☝☝☝
📰🗞️Get & Read the Fundamental, Macro, COT Report, Inventory and Storage Analysis, Seasonal Factors, Sentimental Outlook, Intermarket Analysis, Future trend targets and Overall outlook score..., go ahead to check 👉👉👉🔗🔗
⚠️Trading Alert : News Releases and Position Management 📰 🗞️ 🚫🚏
As a reminder, news releases can have a significant impact on market prices and volatility. To minimize potential losses and protect your running positions,
we recommend the following:
Avoid taking new trades during news releases
Use trailing stop-loss orders to protect your running positions and lock in profits
💖Supporting our robbery plan 💥Hit the Boost Button💥 will enable us to effortlessly make and steal money 💰💵. Boost the strength of our robbery team. Every day in this market make money with ease by using the Thief Trading Style.🏆💪🤝❤️🎉🚀
I'll see you soon with another heist plan, so stay tuned 🤑🐱👤🤗🤩

"SoyBeans" Commodities CFD Market Robbery Plan (Swing Trade)🌟Hi! Hola! Ola! Bonjour! Hallo! Marhaba!🌟
Dear Money Makers & Robbers, 🤑💰✈️
Based on 🔥Thief Trading style technical and fundamental analysis🔥, here is our master plan to heist the "SoyBeans" Commodities CFD Market. Please adhere to the strategy I've outlined in the chart, which emphasizes short entry. Our aim is the high-risk Green Zone. Risky level, oversold market, consolidation, trend reversal, trap at the level where traders and bullish robbers are stronger. 🏆💸Book Profits Be wealthy and safe trade.💪🏆🎉
Entry 📈 : "The heist is on! Wait for the breakout (975.0) then make your move - Bearish profits await!"
however I advise placing Sell Stop Orders below the breakout MA or Place Sell limit orders within a 15 or 30 minute timeframe. Entry from the most recent or closest low or high level should be in retest. I Highly recommended you to put alert in your chart.
📌I strongly advise you to set an "alert (Alarm)" on your chart so you can see when the breakout entry occurs.
Stop Loss 🛑: Thief SL placed at (1015.0) Swing Trade Basis Using the 4H period, the recent / swing high or low level.
SL is based on your risk of the trade, lot size and how many multiple orders you have to take.
Target 🎯: 935.0 (or) Escape Before the Target
🧲Scalpers, take note 👀 : only scalp on the Short side. If you have a lot of money, you can go straight away; if not, you can join swing traders and carry out the robbery plan. Use trailing SL to safeguard your money 💰.
🥔🍀🍃"SoyBeans" Commodities CFD Market Heist Plan is currently experiencing a bearishness,., driven by several key factors.
📰🗞️Get & Read the Fundamental, Macro, COT Report, Inventory and Storage Analysis, Seasonal Factors, Sentimental Outlook, Intermarket Analysis, Future trend targets.. go ahead to check 👉👉👉🔗
⚠️Trading Alert : News Releases and Position Management 📰 🗞️ 🚫🚏
As a reminder, news releases can have a significant impact on market prices and volatility. To minimize potential losses and protect your running positions,
we recommend the following:
Avoid taking new trades during news releases
Use trailing stop-loss orders to protect your running positions and lock in profits
💖Supporting our robbery plan 💥Hit the Boost Button💥 will enable us to effortlessly make and steal money 💰💵. Boost the strength of our robbery team. Every day in this market make money with ease by using the Thief Trading Style.🏆💪🤝❤️🎉🚀
I'll see you soon with another heist plan, so stay tuned 🤑🐱👤🤗🤩

Let the Repricing Begin: Uranium vs. GoldUranium should experience significant upside as it becomes repriced accordingly to gold

XAUUSD - Strong Parabolic RallyA parabolic rally for gold on this daily chart
Could go much higher as long as this curved trend line stays in tact
I'm not sure how high it could go but currently it is very bullish
This bullishness could be due to instability in the USA right now, an attempt to find a store of value
Daily timeframe

Gold 1H Intra-Day Chart 17.04.2025Gold is extremely bullish right now due to Tariff wars! So what's next?
Option 1: Gold pushes higher into $3,362 - $3,367 before rejecting and dropping down towards $3,326.
Option 2: Gold climbs a little higher towards $3,372 which will confirm a bullish bias towards $3,460. But after touching $3,372 we will see a cool off towards $3,270.
Which scenario do you find more likely?

$ETH = Silver and $BTC = Gold Means WHAT!?They say Ethereum is the Silver to ₿itcoin being Gold.
If that's the case, does that mean that the ceiling for CRYPTOCAP:ETH will forever be stuck at $4,800
just like TVC:SILVER being capped at $48 for the past 45 years?
Does anyone really think ETH will be higher than $4,800 in 45 years???😆
A true store of value 💯

GOLD → If you didn't catch the train, what should you do?FX:XAUUSD in a rally. Running into a train that is already in motion is prohibited due to the lack of ability to calculate risks. Ahead of the news, a correction is possible, which will allow us to find a place to trade
Gold continues to update an all-time high on the back of expectations of retail sales in the US and the speech of Fed chief Powell. Price growth was supported by strong data from China, increased demand for “protective assets” due to geopolitical tensions and trade risks between the U.S. and China. Additional support was provided by forecasts of gold price growth from ANZ to $3,600 by the end of the year
Technically, the psychological zones of interest 3325 - 3350 are ahead, from which a correction may form. The ideal scenario is to wait for a correction to local or intermediate support levels and only there look for an entry point.
Resistance levels: 3318, 3335, 3350
Support levels: 3275, 3265, 3244
On the background of a strong bull market it is worth using as a productive strategy to trade on the breakdown of resistance in order to continue growth, but in this case we need to wait for consolidation, we do not have it.
Or wait for correction, support retest and only then consider buying.
Regards R. Linda!

Gold hits record as Polymarket flips Fed callFederal Reserve Chair Jerome Powell has warned that President Donald Trump’s tariff policy is likely to fuel higher inflation and slow economic growth.
Speaking at the Economic Club of Chicago on Wednesday, Powell said, “Markets are struggling with a lot of uncertainty, and that means volatility.” His comments were quickly reflected in the markets, with the Dow shedding 1.7%, the S&P 500 falling 2.3%, and the Nasdaq tumbling 3.4%. Meanwhile, gold extended its rally to a new record high of $3,337.
What may not be uncertain is the Fed’s next rate decision. According to Polymarket data, there's now an 89% chance the Federal Reserve will hold rates steady at its May meeting—up from 69% just a month ago.
Polymarket is also pricing the odds of Powell being replaced by Trump with a more servile director this year at 17% (which could likely send the odds of a rate cut in May shooting up).

Short Idea on Silver (XAGUSD)Based On :
- 1h Supply covered by weekly
- POIV divergence
- IQMS Extremes about to flip

Gold 2025: The Asset of Last Trust - Deep Research by EXCAVOThe Influences on Gold Prices in 2025
As of 2025, gold continues to assert its status as a safe-haven asset, with prices accelerating dramatically. This surge is driven by economic uncertainties, increased central bank demand, and geopolitical tensions. The analysis focuses on the multifaceted factors influencing gold prices, including inflation fears, a declining U.S. dollar, and recent debates surrounding Fort Knox's transparency.
I've delved a bit into the gold landscape and will provide ideas here aimed at helping investors and analysts navigate the complexities of the gold market.
The Current Economic Climate and Its Impact
Recent developments in global economic conditions have laid the groundwork for significant fluctuations in gold prices in 2025. Economic volatility, primarily driven by fears of inflation and weakening currencies, has led investors and central banks to increasingly view gold as a reliable hedge against financial instability. The aftermath of trade disputes, particularly between major economic powers, has further intensified these economic shifts.
Globally, economic growth forecasts for 2025 have been downgraded significantly. According to Fitch Ratings, the world economy is expected to grow by just 2.3%, down from previous estimates of 2.9%. This deceleration is attributed to extensive tariffs imposed by the United States, leading to broader global economic uncertainty. The United States itself is seeing a contraction in growth expectations, with projections cut to 1.7% amid these tensions. Inflation in the U.S., driven by increased tariff costs, is another immediate concern, marking a sustained presence at around 3%
The U.S. dollar, although currently strong, is predicted to depreciate due to ongoing inflation and economic stagnation, despite current high real trade-weighted indices—the highest since the 1980s. This depreciation trend, anticipated by analysts, could significantly impact currency markets worldwide, putting pressure on countries with high dollar exposure S&P Global.
In this environment of weakening currency strength and persistent inflation, gold serves as the optimal hedge. Although the role of gold isn't directly covered in some of the current economic reports, it remains a traditional safe haven during tumultuous times—a response to the depreciation of currency values and the pervasive fear of inflationary spirals that affect purchasing power and savings CFA Institute.
The global shift away from excessive reliance on the dollar reflects a broader strategy by some nations to safeguard their economies against the capricities of prevailing geopolitical circumstances. This shift may lead to increased gold purchases by central banks, aiming to stabilize financial reserves in light of uncertain future economic policies. As inflation fears continue to wear on investor confidence, gold’s relative safety seems set to keep its allure in the modern financial landscape.
Geopolitical Forces Shaping Gold Prices
Geopolitical tensions in 2025 remain potent catalysts driving the dynamics of gold prices. As international relations remain strained, especially between leading economies, the markets have been exceptionally responsive to developments that unsettle the economic landscape. One critical component in this scenario is the burgeoning U.S.-China trade conflict, which saw tariffs climb to an unprecedented 145% and 125% respectively, spiking gold’s appeal as a safe asset against market turmoil.
This extensive strain on trade and economic relations translates into significant instability across foreign exchange markets. A pronounced example is the substantial 8% decline in the Dollar Index, making gold an attractive alternative as its purchasing power for non-U.S. investors increases . The strategic shift by some nations away from the U.S. dollar is further evidenced by noteworthy purchases of gold by central banks as they seek to diversify their foreign exchange reserves .
Furthermore, the geopolitical climate is marked by a flight to safety among investors, reflected in the significant inflow of gold-backed exchange-traded funds (ETFs), which absorbed 227 tonnes in Q1 of 2025 alone. This highlights how geopolitical strife propels gold as both a buffer against inflation and a refuge amidst escalating equity volatilities.
Amidst these conditions, global policy adjustments also play a role. Central banks have been proactively increasing gold holdings, exemplifying a growing distrust of dollar-denominated assets. For instance, policy shifts seen with the Trump administration's enforcement of new tariffs further exacerbated market fears, as paralleled in previous periods like 2018-2020 where gold gained significant value amidst trade wars.
As geopolitical uncertainty continues to prevail, the inherent security associated with gold, coupled with mounting inflationary pressures from such tensions, suggests that gold prices may well remain heavily influenced by these forces through 2025.
Fort Knox: Transparency and Its Market Implications
Fort Knox, a symbol of American financial might, famously houses a substantial portion of the United States' gold reserves. Recent calls for transparency have surged, fueled by high-profile figures such as Elon Musk and Donald Trump. This movement seeks to address long-standing skepticism surrounding the visibility and security of these reserves. Fort Knox's vaults hold approximately 147 million ounces of gold, valued at over $459 billion at today's market rates. The last independent audit of these reserves dates back several decades, to 1953, prompting increasing demands for accountability .
Elon Musk has proposed a surprising move to audit these reserves, suggesting that the audit be livestreamed. This unprecedented proposal aims to provide public visibility into the wealth residing in the Fort Knox vaults, arguing that the American populace deserves to confirm its existence. However, despite its garnering attention, this idea encounters significant security and logistical obstacles.
While the U.S. Treasury asserts that gold audits occur annually through internal procedures, skepticism remains due to the lack of external verification. Past visits, including former Treasury Secretary Steven Mnuchin's confirmation in 2017 that the reserves appeared intact, have not fully silenced doubts.
Compounding this dialogue, another proposal involves employing blockchain technology to monitor the reserves. Proponents, like NYDIG's Greg Cipolaro, posit that blockchain could enhance audit transparency despite still necessitating trust in the overseeing government entities.
The conversation surrounding Fort Knox's transparency underscores mounting tensions over governmental accountability in financial stewardship. If a comprehensive audit were confirmed, it could significantly bolster public confidence, contributing to more stable gold market conditions. Conversely, revealing discrepancies could heighten market volatility and public distrust. This transparency debate continues amid the broader conversation about economic policy and international financial stability.
Gold Price Predictions for 2025 and Beyond
Gold price predictions for 2025 highlight a growing consensus among major financial institutions that the precious metal is poised to reach new heights. With current prices hovering around $3,223 per ounce, the perspectives of Goldman Sachs, UBS, and the Bank of America offer crucial insights into the potential trajectories of gold's value.
Goldman Sachs has led the charge in bullish projections, recently upgrading their gold price forecast to $3,700 per ounce by the end of 2025. This marks the third upward revision this year due to ongoing recession risks, central bank demand, and inflows into exchange-traded funds (ETFs). The bank envisions a potential rise to $4,500 should extreme economic scenarios unfold . Their analysis highlights a growing reliance on gold as a hedge against global macroeconomic uncertainties, including geopolitical tensions and inflationary pressures .
UBS, another major player, shares this optimistic outlook by projecting gold to reach $3,500 in 2025. UBS's forecast aligns with several macroeconomic indicators, including persistent inflation and central bank demand, which remains robust as an average purchase exceeds previous years. Furthermore, UBS sees structural shifts, with entities such as Chinese insurance funds increasing their gold allocations. This shift underscores gold's strategic role as a portfolio stabilizer in uncertain economic landscapes.
The Bank of America's approach reflects a slightly more conservative position, adjusting their gold price forecast for 2025 to $3,250 per ounce. However, they emphasize significant factors driving their projections, such as central bank accumulation and the political intricacies surrounding U.S. trade measures. The bank's analysis also anticipates gold stabilization in 2025 owing to potential profit-taking, but maintains the broader bullish trajectory through 2026 and beyond .
Overall, these insights paint a vivid picture of an evolving gold market, shaped by multifaceted economic variables and featuring gold as a resilient asset and hedge amid swirling global uncertainties.
Investment Strategies in Today's Gold Market
Amidst the dynamic landscape of 2025, gold continues to offer opportunities for portfolio diversification, driven by economic uncertainty, inflationary pressures, and record-breaking prices. With the gold price surpassing $3,250 per ounce in April 2025, several factors contribute to the increased demand and strategic considerations for gold investment. Trade tensions and proposed tariffs under new U.S. policies have amplified global economic uncertainty, while persistent inflation, hovering at 2.8%, remains above the Federal Reserve's target, delaying expected interest rate cuts. Additionally, stock market volatility has prompted investors to seek diversification amidst equity downturns .
Investment strategies in today's gold market require thoughtful portfolio allocation and diversification. Experts recommend limiting exposure to gold to 7–10% of total assets. This balance ensures investors benefit from gold's non-correlation with stocks and bonds without overexposure to risk . Exchange-traded funds (ETFs) like the SPDR Gold Trust (GLD) or Sprott Gold Miners ETF (SGDM) are favored for their liquidity and ability to provide broad exposure to the gold market .
Tactical investment options also play a critical role in maximizing returns. Fractional gold investments allow access to smaller gold amounts, such as bars or coins under one ounce, making it easier to benefit from price trends without high entry costs . Gold mining stocks present opportunities for those targeting companies with strong margins, especially as costs are significantly below current market prices .
Moreover, strategic fund selection can enhance a portfolio's potential. Funds like the WisdomTree Efficient Gold Plus Gold Miners Strategy Fund (GDMN), which combines physical gold and mining equities, offer a hybrid exposure to gold investments .
The key to navigating 2025's gold market is a disciplined approach to allocation, awareness of market shifts, and strategic use of available investment options. By doing so, investors can hedge against inflation and capitalize on market volatility for potential long-term gains.
Conclusions
The year 2025 has exposed the fragility of the global financial system. Gold isn’t just a haven anymore — it’s a barometer of panic, fear, and institutional failure. When markets shake, inflation becomes chronic, and Fort Knox becomes a meme, gold rises — quietly but relentlessly.
What we’re witnessing is an institutional drift away from the U.S. dollar. Central banks are hoarding metal like they're bracing for something big. The global economy is cracking under tariffs, geopolitical chess moves, and eroding trust in the "reserve currency." At this point, $3,250 per ounce isn’t the top — it’s just another step up the ladder.
The key: gold is no longer just a defensive asset. It has become a strategic tool of sovereignty and power. Nations diversifying into gold are building economic independence. Investors stepping in now aren’t just protecting wealth—they’re gaining leverage.
My advice: keep gold in focus. Physical bullion, ETFs, mining stocks, hybrid funds — each is a puzzle piece. Gold is not hype. It’s the anchor of reason in an era where digital noise drowns out reality.
Watch zones: $3500 — then $3700+. If the global system wobbles harder, $4200 won’t be a forecast — it will be the signal that the fiat era is capitulating.
He who controls gold, controls trust. And he who controls trust… writes the script for the future.
Best regards EXCAVO
— EXCAVO

Potential bullish rise?COPPER has bounced off the support level which is an overlap support and could rise from this level to our take profit.
Entry: 4.5751
Why we like it:
There is an overlap support level.
Stop loss: 4.4681
Why we like it:
There is a pullback support level that is slightly above the 38.2% Fibonacci retracement.
Take profit: 4.8155
Why we like it:
There is a pullback resistance level that lines up with the 61.8% Fibonacci retracement.
Enjoying your TradingView experience? Review us!
Please be advised that the information presented on TradingView is provided to Vantage (‘Vantage Global Limited’, ‘we’) by a third-party provider (‘Everest Fortune Group’). Please be reminded that you are solely responsible for the trading decisions on your account. There is a very high degree of risk involved in trading. Any information and/or content is intended entirely for research, educational and informational purposes only and does not constitute investment or consultation advice or investment strategy. The information is not tailored to the investment needs of any specific person and therefore does not involve a consideration of any of the investment objectives, financial situation or needs of any viewer that may receive it. Kindly also note that past performance is not a reliable indicator of future results. Actual results may differ materially from those anticipated in forward-looking or past performance statements. We assume no liability as to the accuracy or completeness of any of the information and/or content provided herein and the Company cannot be held responsible for any omission, mistake nor for any loss or damage including without limitation to any loss of profit which may arise from reliance on any information supplied by Everest Fortune Group.

Analysis of the BRENT chart with expectations for 2025-2026◽️Technically, all conditions for the completion of the second wave correction have been met, and now quotes can be safely reversed up. However, current events in the global economy do not yet provide grounds for confidently asserting this. Locally, the price may still be driven down to $50 per barrel and even slightly lower. One way or another, it is important to understand a simple thing: everything below $70 per barrel should be seen as an opportunity to buy oil and everything related to it cheaply.
◽️According to my estimates, there is probably still time for deliberation on purchases until the end of spring. But further, from the beginning of summer, I expect a sharp rise in prices amid the escalation in the Middle East. From above, in the $100-150 range, growth will likely be contained for some time, which will be interpreted as the formation of sub-waves (i)-(ii), where after sharp rise in the first sub-wave from approximately $50-60 to $120-130, a local correction will follow within the second sub-wave.
◽️The growth period may take 3-6 months, and the correction to it another 2-4 quarters, and then a breakout of the $120-150 resistance zone and further "to the moon" in the third waves is expected.
🙏 Thank you for your attention and 🚀 for the idea.
☘️ Good luck, take care!
📟 See you later.

#BRENT Gold/Oil Ratio, Stocks/Oil RatioOn chart I tried to fit three instruments at once:
1️⃣ Bottom (white) chart: Gold to Oil Ratio.
2️⃣ Middle (red) chart: BRENT crude oil price.
3️⃣ Top (blue) chart: Dow Jones Industrial Average to Oil Price Ratio.
1️⃣ The first thing to pay attention to is the white chart: GOLD/OIL Ratio , specifically where this ratio is today. Over the last 75 years of observation, the ratio has reached unprecedented levels. The spread is once again testing the record values of the COVID-19 hysteria of 2020, when panic caused oil prices to plummet sharply. At the current moment, the ⚖️Gold to Oil Ratio is around the 50 mark, meaning that one ounce of gold can buy as much as 50 barrels of oil. Over the last century, when the spread exceeded 25 barrels per ounce, it was interpreted as a moment of cheap oil relative to gold. Today, against the backdrop of the chaos reigning in the world, the GOLD/OIL Ratio is entering what can be called the " MAGA Mega Cheap Oil Zone" if it is again valued in gold, and not in fiat green piece of paper. Further, we should expect at least a return to its average values, and here three scenarios are possible:
1. First Scenario. Let's assume that today's price of $60-70 per barrel of oil is "fair" and this is where it belongs. In this case, gold is currently strongly overvalued, and it's time for a correction from $3300 to the $2500-2800 range.
2. Second Scenario. Everything is fine with gold, and it will continue to rise without correction. In this case, oil is severely undervalued relative to gold, and it's time for it to catch up so that the spread of 50 returns to its average values in the 10-25 range.
3. Third Scenario suggests that both oil is significantly undervalued and gold has risen too sharply, and now it's time for a correction in gold and a rise in oil prices.
In any of the three scenarios described above, the GOLD/OIL Ratio will sooner or later return to its normal values of the last century, that is, to the range of 10-25 barrels per ounce of gold. And most likely, we will see the third scenario unfold this year, where against the backdrop of a stock market crash, problems with liquidity in the global financial system, the entry of Western economies into recession, as well as the start of a full-scale war in the Middle East this summer, all of this together will provoke a correction in gold and an explosive growth in oil prices, and consequently, a return of the gold to oil ratio to its historical averages.
2️⃣ On the second (red) linear chart of BRENT crude oil prices , everything looks quite ordinary. If we briefly describe the chart for the last twenty years in simple terms, it's worth saying the following: since 2008, they have been trying in every possible way to keep the oil price below $130 per barrel, and as soon as the price approaches the $120-150 zone, some "invisible hand of the market" throws it down. The first test of this resistance zone occurred during the GFC global financial crisis of 2008, the second test with prolonged trading took place during the Eurozone debt crisis of 2011-2014 (culminating in the Greek default), and the third test was in 2022, as a consequence of the monetary madness of 2020 (global lockdown, unlimited QE, and as a result: a wave of monetary + structural inflation worldwide). One way or another, from the fourth or fifth time, the $120-150 per barrel boundary will be finally broken. And then the price above, like a samurai, "has no destination, only the path," and this path is upwards, "to the moon"🚀
3️⃣ Now it remains to consider the last (blue) chart at the top, the ⚖️Dow Jones Industrial Average to Oil Price Ratio . This chart should be understood as a long-term trend indicator of cycle changes in financial markets. When it rises, it implies a 10 or even 20-year growth cycle in the stock market, and accordingly, corrections in the commodity market. And when it falls, then vice versa, the cycle changes to growth in the commodities market and a correction in the risky stock market, which also lasts one or even two decades. Today, it can be said with certainty that since 2020, the cyclicality has changed, and we are just entering a ten or even twenty-year growth trend in the commodity sector, which portends a change from the "eternally" growing trend in the American stock market to a fall or at least a multi-year sideways movement a la the 1970s.
🙏 Thank you for your attention and 🚀 for the idea.
☘️ Good luck, take care!
📟 See you later.
