Silver Massive C&H Bull Market 400%+ gains Lifetime opportunity🏆 Silver Market Update (April 13th, 2025)
📊 Technical Outlook Update
▪️Long-term outlook 2weeks/candle
▪️Massive C&H formation in progress
▪️40 USD breakout pending now
▪️PT BULLS 400%+ gains BUY/HOLD
▪️Price Target BULLS 125/150 USD
▪️Bull market still pending
▪️BUY/HOLD now or miss out on gains
📢 Silver Market Update – April 2025
📈Silver is widely used in electronics due to its exceptional electrical and thermal conductivity, making it ideal for various applications, including printed circuit boards, connectors, and contact surfaces.
🚀 It is also employed in devices like touch screens, batteries, and solar panels. Silver's high conductivity, solderability, and resistance to corrosion and oxidation contribute to its popularity in the electronics industry.
Commodities

EURUSD Monthly : BULL-Market will be Start for EURHI Guys,
As you can see, the trend line has been broken very strongly and with the structure changing to lower time frames as well, given the easing of the political crises in Europe. Weakening of the Dollar Index We have entered a new round of strength gains in EURUSD.
SecondChanceCrypto
⏰ 13/april/26
⛔️DYOR
Always do your research.
If you have any questions, you can write them in the comments below and I will answer them.
And please don't forget to support this idea with your likes and comments.

GOLD (XAUUSD): Support & Resistance Analysis For Next Week
Here is my latest structure analysis
and important support & resistance levels/zone on Gold for next week.
Consider these structures for pullback/breakout trading.
❤️Please, support my work with like, thank you!❤️
I am part of Trade Nation's Influencer program and receive a monthly fee for using their TradingView charts in my analysis.

XOM Analysis: Oil's Next Move & Policy ShiftsNYSE:XOM currently piques my interest, particularly with oil prices potentially stabilizing or rising further. Recent geopolitical developments and policy shifts under Trump’s administration—such as rolling back Biden-era energy regulations, reducing methane fees, and easing LNG export permits—could significantly influence the energy landscape.
My intuition suggests Trump’s "Mar-a-Lago Accord" might involve major global economies reducing holdings of US dollar assets, swapping short-term treasuries for century bonds. Such currency shifts and reduced drilling activity could lead to a tighter oil supply, benefiting prices. Additionally, a weakening US dollar could positively impact technology stocks, as investors rotate towards sectors less affected by traditional commodities.
Technical Analysis (Daily & Hourly Chart)
Current Price: Approximately $103.00
Key Resistance Levels:
Immediate resistance: $103.93 (L.Vol ST 1b)
Important resistance zone: $104.74 (118 AVWAP)
Critical resistance (Last week's high): ~$106.46
Key Support Levels:
Near-term support: $101.13 (Weeks Low Long)
Major support: $97.92 (Best Price Short)
Trading Scenarios
Bullish Scenario (Continued oil strength & supportive policy shifts):
Entry Trigger: Sustained breakout and close above immediate resistance at $103.93.
Profit Targets:
Target 1: $104.74 (AVWAP resistance)
Target 2: $106.46 (recent swing high)
Stop Loss: Below recent pivot around $101.00, limiting risk effectively.
Bearish Scenario (Oil price weakness or production surge):
Entry Trigger: Failure to sustain the above resistance at $103.93 or a breakdown below near-term support at $101.13.
Profit Targets:
Target 1: $99.00 (psychological & short-term support)
Target 2: $97.92 (strong support, ideal short target)
Stop Loss: Above $104.75 to control risk in case of a reversal.
Thought Process & Final Thoughts
Given the current geopolitical and regulatory environment, XOM appears poised for potential upside if oil prices remain strong and policy shifts materialize. However, caution is warranted, as oil companies seem hesitant to increase production due to profitability concerns. Clearly defined technical levels will help navigate trade entries and exits effectively around these evolving macroeconomic conditions.
Earnings Date: May 2nd—Keep positions nimble as earnings can significantly impact short-term volatility.

$GLD - bullish momentum soon to stallHello, I was bullish on AMEX:GLD for a bit and now examining the charts, multiple frames, this may be setting up for a good short. If geopolitics and tariff talks deescalate then this should cool off. The Elliot wave placed indicates some time for a correction/pull back on this hot commodity and the candle on the Daily from Friday is a spinning stop doji which can indicate reversal in an uptrend. Also, we have so many gaps up that happened in 3 day span, crazy actually. I labeled areas of targets to fill these gaps. Expecting a retracement to $280.
WSL.

I've Cracked the BULLISH Code in Crude Oil Using COTCrude oil is setup for longs based on fundamental conditions underlying the market place.

Gold outlook for next week. Expecting massive bullishnessCrosshairs on $3800. Extremely bullish on gold after this weekly closure

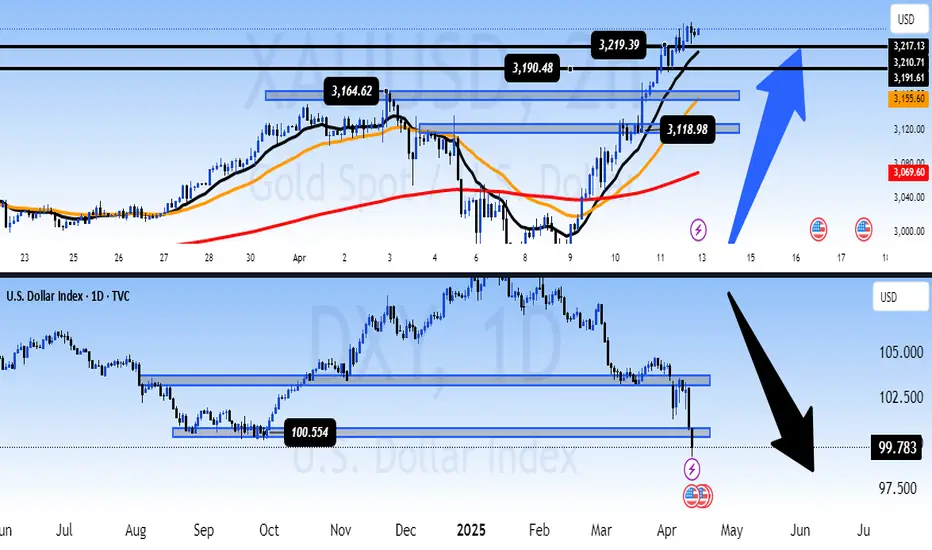
[XAU/USD & DXY] – Long-Term Outlook📌 – Long-Term Outlook: Is Gold Entering a New Bull Cycle as USD Weakens?
📊 Technical Analysis – Gold & DXY
The divergence between Gold and the U.S. Dollar Index (DXY) has become increasingly clear:
🔹 Gold (XAU/USD):
Price has broken the previous high at 3,190 and is now testing 3,219 – a fresh all-time high on the daily chart.
The MA13, MA34, and MA200 are showing a perfect “bullish fan” formation, indicating a sustainable uptrend rather than a short-term pump.
The key support zone around 3,164 – 3,118 remains critical for any healthy pullback.
🔻 U.S. Dollar Index (DXY):
Price has decisively broken below the psychological 100.55 support and is now hovering near 99.78.
If DXY fails to hold above 99.7, the next downside target could be 97.5 in the coming quarter.
The technical structure is clearly bearish, confirming USD weakness across the board.
→ This negative correlation aligns with macro expectations: a weaker dollar is fueling gold’s bullish momentum.
🌍 Fundamental Analysis – Macro Drivers
US PPI & CPI both come in lower than expected:
Inflation is showing clear signs of cooling.
Markets are now pricing in a possible rate cut as early as June.
Shift in Fed tone – from hawkish to neutral:
While not officially declared, recent Fed statements have been more dovish, supporting risk assets and weakening the dollar.
Strong safe-haven demand remains:
Geopolitical risks and economic uncertainty continue to push capital into gold, especially as USD enters a weakening phase.
🧭 Long-Term Perspective
Gold is potentially entering a new bull cycle. With consecutive ATH breakouts and favorable macro conditions (falling inflation, expected rate cuts, USD weakness), gold could push to even higher levels into Q2 and Q3.
The USD faces downside pressure in the coming months, especially if the Fed signals a firm pivot toward easing.
⚠️ Strategy Caution
Short-term corrections may occur, especially after such a sharp rise.
However, any pullbacks into key support zones could present strategic long opportunities for longer-term investors.
💬 What’s Your Take?
Is this the beginning of a major bull cycle in gold, or do you expect deeper pullbacks before continuation?
Drop your analysis and charts below! 👇👇👇
USOIL Set To Fall! SELL!
My dear friends,
Please, find my technical outlook for USOIL below:
The price is coiling around a solid key level - 61.43
Bias - Bearish
Technical Indicators: Pivot Points Low anticipates a potential price reversal.
Super trend shows a clear sell, giving a perfect indicators' convergence.
Goal - 60.40
About Used Indicators:
The pivot point itself is simply the average of the high, low and closing prices from the previous trading day.
Disclosure: I am part of Trade Nation's Influencer program and receive a monthly fee for using their TradingView charts in my analysis.
———————————
WISH YOU ALL LUCK

SPY/QQQ Plan Your Trade Overview For 4-12 : Thank youThis video is mostly a big thank you for all the great comments and questions over the past few weeks.
I've been posting these videos on TradingView for almost a year and the types of viewers/followers I've been gaining is incredible.
You guys & gals have really impressed me with your questions and engagement. Many of you follow me for months without ever commenting or asking any questions.
I received a call from a client/follower in Alberta last night and he reported last week's gains at over 300% by following my videos.
I received a message from another TV follower saying he's been following my videos for many months and, after a bad loss a few years back, he has decided to give trading another go.
I've stated it before and I'll keep saying it.. I'm not trying to scam you out of anything. I'm trying to show you the RIGHT SKILLS and TECHNIQUES for you to learn to become a better, more skilled trader.
The way I look at it is like this...
If I can teach you half of what I know and see on the charts, then you guys will be able to achieve so much greater success and have gained/retained the knowledge to do it on your own.
You watch me do it over and over on these charts. Guess what - you are LEARNING at the same time.
Now, after a couple of years of doing this and following my videos, you've GAINED an education on how to trade more efficiently, manage risk more efficiently, and achieve your trading goals (I hope).
Right now, I'm getting messages/comments from people saying they are making 200%, 300%, 500%, or more every week or two from my videos.
That is absolutely incredible. I just want to urge you to remember I'm not 100% perfect in predicting the markets. No one EVER really is 100% perfect at it.
In the long run, as long as you don't get super greedy, you'll survive any minor losses and live to trade another day.
That is probably the most important thing I can teach you - trade within a proper scale to your RISK LEVEL. Never BET THE FARM on your trades. Always have a 50% to 70% cash reserve.
Anyway. Thank you. I really appreciate all of you.
Hope you enjoy this video.
#trading #research #investing #tradingalgos #tradingsignals #cycles #fibonacci #elliotwave #modelingsystems #stocks #bitcoin #btcusd #cryptos #spy #gold #nq #investing #trading #spytrading #spymarket #tradingmarket #stockmarket #silver

Long Term Brent Outlook, $32 by 2026Weekly Brent has broken a clear barrier and formed a Bull Flag pattern, but the subsequent rally has been weak, not even reaching the breakout level.
The global economy is showing signs of weakening, leading to a reduction in oil demand. Concurrently, Trump's move to lift US production restrictions is boosting oil supply. However, the slight depreciation of the dollar is providing upward pressure on oil prices.
Given these factors, Brent remains relatively weak, and we may see a continued decline in line with Scenario 1, potentially targeting ML by 2026. Further downside is also likely.
Given the current conditions, I consider shorting oil at any reasonable price on lower timeframes.

GOLD Analysis: Will buyers push toward 3,230?OANDA:XAUUSD continues to trade within a clearly defined ascending channel, with price action consistently respecting both upper and lower boundaries. The recent price action suggests buyers are currently in control, indicating the potential for continued upside.
Given the strength of the current bullish momentum, there is a strong likelihood that price may break above the key resistance zone. If that happens, it could come back to retest the level as support before continuing higher. A successful retest would reinforce the bullish structure and open the door for a potential move toward the 3,230 target, which aligns with the channel’s upper boundary.
However, if price fails to break above the resistance zone, it could signal weakening bullish momentum and open the door for a deeper pullback toward the lower boundary of the ascending channel.
Always confirm your setups and manage your risk accordingly.
Best of luck!

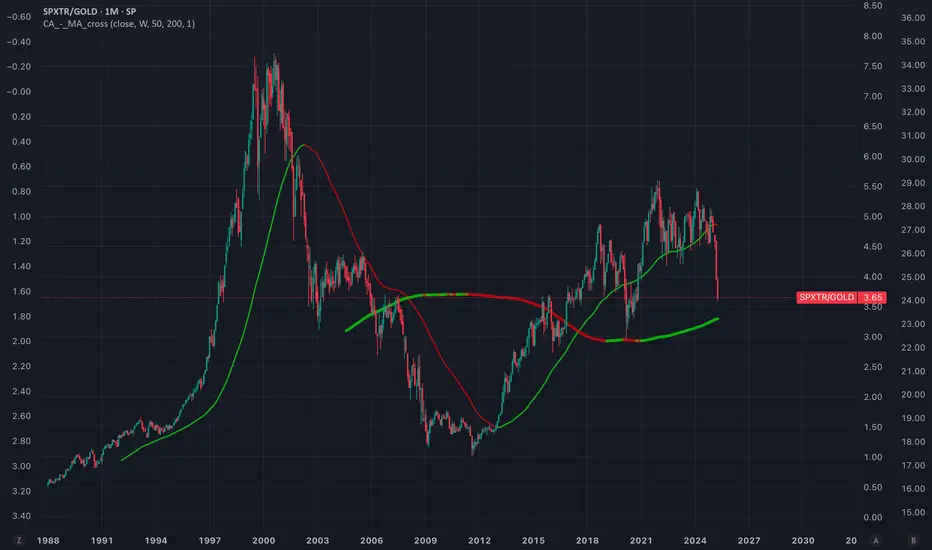
SPX/GOLD ratio near to key supportcrossing below moving average of 200 months could trigger a secular movement in favour of gold.
Potential global debt colapse and lack of confidence in USD + high valuation, mag-7 concentration and high growths expectations on AI are macro/fundamental facts that supports this idea.
BRIEFING Week #15 : Arbitrages on the lookoutHere's your weekly update ! Brought to you each weekend with years of track-record history..
Don't forget to hit the like/follow button if you feel like this post deserves it ;)
That's the best way to support me and help pushing this content to other users.
Kindly,
Phil

Are You Taking the Right Risks in Trading? RISK Per Trade Basics
What portion of your equity should you risk for your trading positions?
In the today's article, I will reveal the types of risks related to your position sizing.
Quick note: your risk per trade will be defined by the distance from your entry point to stop loss in pips and the lot size.
🟢Risking 1-2% of your trading account per trade will be considered a low risk.
With such a risk, one can expect low returns but a high level of safety of the total equity.
Such a risk is optimal for conservative and newbie traders.
With limited account drawdowns, one will remain psychologically stable during the negative trading periods.
🟡2-5% risk per trade is a medium risk. With such a risk, one can expect medium returns but a moderate level of safety of the total equity.
Such a risk is suitable for experienced traders who are able to take losses and psychologically resilient to big drawdowns and losing streaks.
🔴5%+ risk per trade is a high risk.
With such a risk, one can expect high returns but a low level of safety of the total equity.
Such a risk is appropriate for rare, "5-star" trading opportunities where all stars align and one is extremely confident in the positive outcome.
That winner alone can bring substantial profits, while just 2 losing trades in a row will burn 10% of the entire capital.
🛑15%+ risk per trade is considered to be a stupid risk.
With such a risk, one can blow the entire trading account with 4-5 trades losing streak.
Taking into consideration the fact that 100% trading setups does not exist, such a risk is too high to be taken.
The problem is that most of the traders does not measure the % risk per trade and use the fixed lot.
Never make such a mistake, and plan your risks according to the scale that I shared with you.
❤️Please, support my work with like, thank you!❤️
I am part of Trade Nation's Influencer program and receive a monthly fee for using their TradingView charts in my analysis.

USOIL: Local Bearish Bias! Short!
My dear friends,
Today we will analyse USOIL together☺️
The in-trend continuation seems likely as the current long-term trend appears to be strong, and price is holding below a key level of 61.501 So a bearish continuation seems plausible, targeting the next low. We should enter on confirmation, and place a stop-loss beyond the recent swing level.
❤️Sending you lots of Love and Hugs❤️
