USOIL:Sharing of the Latest Trading StrategyThis week’s trading wrapped up successfully. Our exclusive VIP trading signals achieved a 90% accuracy rate!👉👉👉
This week, crude oil prices have consecutively closed with bearish candles and declined. On the 4-hour chart, there are four consecutive bearish candles exerting pressure. On Saturday, the OPEC+ convened a meeting ahead of schedule and confirmed the decision to increase production by 411,000 barrels per day in June, which further intensifies the market's concerns about oversupply. It is recommended that for crude oil trading next Monday, short positions should be mainly taken at the resistance level during rebounds.
Trading Strategy:
sell@59.5-58.5
TP:57-55
The signals in the Signature have brought about continuous profits, and accurate signals are shared every day. Hurry up and click to get them!
👇 👇 👇 Obtain signals👉👉👉
Commodities

BUYS For the Markets. Wait for BUYS in Gold and Silver.In this video, we will analyze the S&P 500, NASDAQ, DOW JONES, Gold and Silver futures, for the week of May 5 - 9th.
The Indices are moving higher, and it's buys until they are not. Simple.
Gold is near potential support at 3201. This may present a great buying opportunity once the lows are swept. A weakened USD will help this cause.
Silver has made a bearish market structure shift (MSS), so buys are not yet on the table. If it disrespects a Daily -FVG, then sells are warranted. It is considerably weaker than Gold.
Enjoy!
May profits be upon you.
Leave any questions or comments in the comment section.
I appreciate any feedback from my viewers!
Like and/or subscribe if you want more accurate analysis.
Thank you so much!
Disclaimer:
I do not provide personal investment advice and I am not a qualified licensed investment advisor.
All information found here, including any ideas, opinions, views, predictions, forecasts, commentaries, suggestions, expressed or implied herein, are for informational, entertainment or educational purposes only and should not be construed as personal investment advice. While the information provided is believed to be accurate, it may include errors or inaccuracies.
I will not and cannot be held liable for any actions you take as a result of anything you read here.
Conduct your own due diligence, or consult a licensed financial advisor or broker before making any and all investment decisions. Any investments, trades, speculations, or decisions made on the basis of any information found on this channel, expressed or implied herein, are committed at your own risk, financial or otherwise.

Oil on high time frame
"Regarding WTI oil, the price trend on high time frames is bearish, especially on the daily chart. After completing its pullback on the 4-hour chart, there are indications of further downside potential.
The market's volatility may be influenced by geopolitical tensions and political factors between Iran and the USA, as well as tariff issues. Despite these fluctuations, candle formations suggest the potential for prices to drop towards the $58 zone."
If you require more assistance or have any specific questions, feel free to ask!

A Preliminary Double Bottom Support Pattern May Be FormingCurrently, factors such as geopolitics, OPEC+ policies, and the trend of the US dollar all have a two-sided impact on USOIL. Only the technical aspect reveals directional signals.
This week, the crude oil price rebounded rapidly after hitting a low of $56. It has formed the embryonic form of a double bottom with the previous low point, and this pattern may become a turning point in the market trend. According to the theory we proposed earlier, "A deep correction breeds a strong rebound," the price of $56 has become a key support level. If the oil price stabilizes at this level next week, the double bottom pattern is expected to be confirmed, which will in turn trigger a technical rebound. Conversely, once this key level is effectively broken, it is likely to trigger a concentrated sell-off of stop-loss orders, intensifying the downward pressure on the price.
I am committed to sharing trading signals every day. Among them, real-time signals will be flexibly pushed according to market dynamics. All the signals sent out last week accurately matched the market trends, helping numerous traders achieve substantial profits. Regardless of your previous investment performance, I believe that with the support of my professional strategies and timely signals, I will surely be able to assist you in breaking through investment bottlenecks and achieving new breakthroughs in the trading field.

Natural Gas | Oil | Dollar | Silver | Gold Price ForecastPrice action, multi time frame, trend analysis on
NYMEX:NG1! PEPPERSTONE:NATGAS AMEX:UNG | Oil | Dollar | Silver | Gold Price Forecast

Why Palladium Is the Smart Play Right NowGold is hitting record highs, and silver is riding the wave—but smart investors know that diversification is key. While everyone is chasing gold, Palladium and Platinum are quietly setting up for a massive opportunity.
🔹 Palladium’s Market Position
✅ Palladium is rarer than gold—annual production is significantly lower.
✅ Industrial demand is surging, especially in automotive catalytic converters.
✅ Supply constraints due to geopolitical factors and mining limitations.
🔹 Palladium’s Role in the Green Revolution
🌍 Palladium is critical for reducing vehicle emissions—used in catalytic converters to meet stricter environmental regulations.
⚡ Hydrogen fuel cells and clean energy tech are increasing demand for Palladium.
🔋 Electronics & semiconductor industries rely on Palladium for conductivity and durability.
🔹 Gold Is at the Top—Time to Rotate?
📈 Gold is at all-time highs, making it expensive for new investors.
📉 Palladium has corrected from its highs, creating a buying opportunity.
💡 Diversifying into Palladium & Platinum now could be a strategic hedge against gold’s potential pullback.
🔹 Palladium’s Supply Crunch
⛏️ Russia & South Africa control most of the world’s Palladium supply—geopolitical risks could tighten availability.
📉 Mining output is declining, while demand remains strong.
💰 Lower supply + rising demand = price surge potential.
🔹 Platinum: The Underrated Hedge
💎 Platinum is historically undervalued compared to gold & Palladium.
🚗 EV & hydrogen fuel cell adoption could drive Platinum demand higher.
📊 Platinum-to-Gold ratio suggests Platinum is deeply discounted.
🔹 Final Thoughts
Gold is great, but smart investors look ahead. Palladium and Platinum are positioned for growth, with strong industrial demand, supply constraints, and undervaluation compared to gold.
📢 Now is the time to accumulate Palladium & Platinum before the market catches on.
TVC:PALLADIUM TVC:PLATINUM TVC:GOLD TVC:SILVER

Can it hit the bottom and rebound?Fundamental Analysis: Driven by the trade concerns sparked by Trump and the risk aversion sentiment arising from the global economic slowdown, the trajectory of oil prices has been shaped. Additionally, OPEC+ convened an early meeting on Saturday and confirmed an increase in production of 411,000 barrels per day in June. This decision has indubitably intensified the market's apprehensions regarding the oversupply of crude oil 📉.
Technical Analysis: Technically speaking, the price of crude oil has persistently lingered below the midline of the Bollinger Bands, distinctly indicating that the bearish trend is in the ascendancy 📉. Last week, on the weekly chart, it closed with a substantial bearish candlestick, exhibiting a downward tail pattern, and in the short term, the price has been fluctuating within a trading range 📊. As for the upcoming week's trend, whether the support level established by the previous double doji bottoming formation will be broken through effectively will be the focal point of market attention 👀. Nevertheless, once the price reaches the crucial support level, there exists the potential for a technical rebound. Investors should closely monitor the variations in trading volume and the response of the moving average system 📈.
Market Situation: It is crucial to note that due to the holiday factor in the Asian market next Monday, market liquidity is anticipated to decline significantly. Under such circumstances, the oil price is likely to encounter a higher risk of more pronounced volatility, further escalating the uncertainty of the market situation ⚠️.
⚡⚡⚡ USOIL ⚡⚡⚡
🚀 Buy@56.0 - 57.0
🚀 TP 59.0 - 60.0
Accurate signals are updated every day 📈 If you encounter any problems during trading, these signals can serve as your reliable guide 🧭 Feel free to refer to them! I sincerely hope they'll be of great help to you 🌟

Bitcoin Hype vs. Reality: A Breakdown of Bitcoin DelusionBitcoin enthusiasts often dream of mass adoption, corporate treasuries, and state-backed investments driving its price to astronomical levels. But let’s examine the actual numbers behind these claims.
🔹 The $1M Bitcoin Fantasy
Many believe Bitcoin will reach $300K, $500K, or even $1M. But what does that actually require?
💰 Bitcoin’s current circulating supply is approximately 19.5 million coins.
💰 At $830K per coin, the total market cap would be $16 trillion—which is:
✅ More than China’s entire GDP ($6T)
✅ 5x the market cap of Apple, Microsoft, Amazon, Google & Tesla combined
To put this into perspective, the entire global crypto market cap is currently around $2.99 trillion. Expecting Bitcoin alone to hit $16 trillion is beyond unrealistic.
🔹 Why Government & Corporate Adoption Won’t Skyrocket Price
Bitcoin believers often cite governments and corporations buying Bitcoin as proof it will moon. But here’s the reality:
⚠️ State & corporate purchases are OTC (Over-The-Counter) deals—they do not impact market prices like retail speculation.
⚠️ Governments negotiate strategically, they don’t impulsively buy at public prices to pump the asset.
⚠️ Treasury holdings do not guarantee higher prices—they only serve as reserves, not market drivers.
State adoption might increase legitimacy, but it won’t magically push Bitcoin past gold or global GDP levels.
🔹 Bitcoin’s Volatility vs. Gold’s Stability
Bitcoin is often compared to gold as a store of value, but its history tells a different story:
📉 Bitcoin has crashed over 80% multiple times—far from a stable asset.
📉 Extreme volatility makes it unreliable for wealth preservation.
📉 Liquidity issues create uncertainty, making it impractical for widespread adoption as money.
Gold, by contrast, has proven stability for centuries, with intrinsic value, industrial use, and universal acceptance.
🔹 Bitcoin Will NOT Absorb the Global Economy
Some claim Bitcoin will replace fiat, surpass gold, and absorb trillions in wealth. But the economic reality is:
❌ Bitcoin remains speculative, driven by market sentiment, not intrinsic value.
❌ No nation will abandon fiat for Bitcoin—they will regulate, integrate, but never replace sovereign currency.
❌ Bitcoin lacks industrial utility—gold has actual use in electronics, medicine, and aerospace.
🔹 The Crypto Dream vs. Financial Reality
Crypto thrives on believers, feeding them narratives that sound appealing but don’t match real-world economic fundamentals.
Bitcoin is not overtaking gold.
Bitcoin is not absorbing global wealth.
Bitcoin is not making every holder a millionaire.
Numbers don’t lie, but ignoring them won’t change reality. When the hype fades, speculative investors will face the harsh truth: Bitcoin is not a guaranteed path to riches—it’s a high-risk, volatile asset that operates in an unpredictable market.

Silver - Short Term Sell Trade Update!!!Hi Traders, on April 30th I shared this idea "Silver - Expecting Retraces Before Prior Continuation Lower"
I expected retraces and further continuation lower until the two Fibonacci resistance zones hold. You can read the full post using the link above.
The bearish move delivered, as expected!!!
If you enjoy this idea, don’t forget to LIKE 👍, FOLLOW ✅, SHARE 🙌, and COMMENT ✍! Drop your thoughts and charts below to keep the discussion going. Your support helps keep this content free and reach more people! 🚀
-------------------------------------------------------------------------------------------------------------------
Disclosure: I am part of Trade Nation's Influencer program and receive a monthly fee for using their TradingView charts in my analysis.

SILVER BEST PLACE TO SELL FROM|SHORT
SILVER SIGNAL
Trade Direction: short
Entry Level: 3,305.2
Target Level: 3,164.4
Stop Loss: 3,398.5
RISK PROFILE
Risk level: medium
Suggested risk: 1%
Timeframe: 12h
Disclosure: I am part of Trade Nation's Influencer program and receive a monthly fee for using their TradingView charts in my analysis.
✅LIKE AND COMMENT MY IDEAS✅

Long positions in the US market remain the main trend🗞News side:
1. The “demand shock” of the Trump administration’s tariffs on the global economy
2. The United States rejected Japan’s request for a comprehensive exemption from 10% reciprocal tariffs and country-specific tariffs in recent negotiations.
3. The conflict between Israel and the Houthis
📈Technical aspects:
The 4H golden moving average spreads upward, the MACD golden cross opens upward, and the 4H overall bullish trend is seen. Gold price encountered resistance at 3386 in the morning of the Asian session. This point can be used as a reference in suppressing the market outlook. If this resistance is effectively broken through, bulls are expected to continue to work towards the 3400 first-line mark above. The daily chart is positive, and the K-line combination is relatively strong. The US market is expected to break through 3386 and reach the space above 3400; the SMA10 moving average of 3370 continues to be bullish as the primary support, with strong resistance to 3400. Even if the price of gold in the US market rises and falls, the middle track of the Bollinger Bands still has good support. On the whole, we mainly focus on long positions in short-term trading. We can consider the 3370-3380 layout to go long, with the target looking towards 3400-3410 above.
If you agree with this view, or have a better idea, please leave a message in the comment area. I look forward to hearing different voices.
TVC:GOLD FOREXCOM:XAUUSD FXOPEN:XAUUSD FX:XAUUSD OANDA:XAUUSD

Gold Forecast: Haven Apetite Back in SightGold is currently testing the 0.618 Fibonacci retracement of the drop from $3,500 to $3,200, located at the $3,380 level.
A clear hold above 3390 could pave the way back toward $3,430 and the $3,500 resistance zone.
• A breakout above $3,500 may extend the rally toward $3,700 and the $4,000 target zone.
• On the downside, short-term support levels may be seen at $3,350, $3,300, and $3,260.
• A confirmed drop below $3,260 could trigger deeper downside risks, with potential moves back toward $3,200, $3,160, $3,080, and $3,000.
Written by Razan Hilal, CMT

Gold surges thanks to China buying goods, waiting for FED waveInternational gold prices jumped to 3,332 USD/ounce, up more than 72 USD compared to the bottom of last night's session. The main driving force came from the wave of gold buying in China, when concerns about the weakening economy caused people to massively turn to gold as a safe haven. The H4 chart shows a strong increase, EMA34 has crossed EMA89, establishing a clear short-term uptrend. If gold surpasses 3,340 USD, it is likely to head towards the old peak around 3,420–3,500 USD.
Crude oil prices are still fluctuating strongly around 57.2 USD/barrel, creating an unstable foundation for the commodity market. The FED will announce its policy in the early morning of May 8. Although it is expected to not change interest rates, any statement can move the market. This will be the next big catalyst for gold.

GOLD The Target Is DOWN! SELL!
My dear friends,
My technical analysis for GOLD is below:
The market is trading on 3377.8 pivot level.
Bias - Bearish
Technical Indicators: Both Super Trend & Pivot HL indicate a highly probable Bearish continuation.
Target - 3357.7
Recommended Stop Loss - 3387.7
About Used Indicators:
A pivot point is a technical analysis indicator, or calculations, used to determine the overall trend of the market over different time frames.
Disclosure: I am part of Trade Nation's Influencer program and receive a monthly fee for using their TradingView charts in my analysis.
———————————
WISH YOU ALL LUCK

BITCOIN/GOLD BITCOIN/GOLD 🌊
Physical gold vs. Digital gold
2010: 1 BTC 0.0001 GOLD
2025: 1 BTC 27.9 GOLD

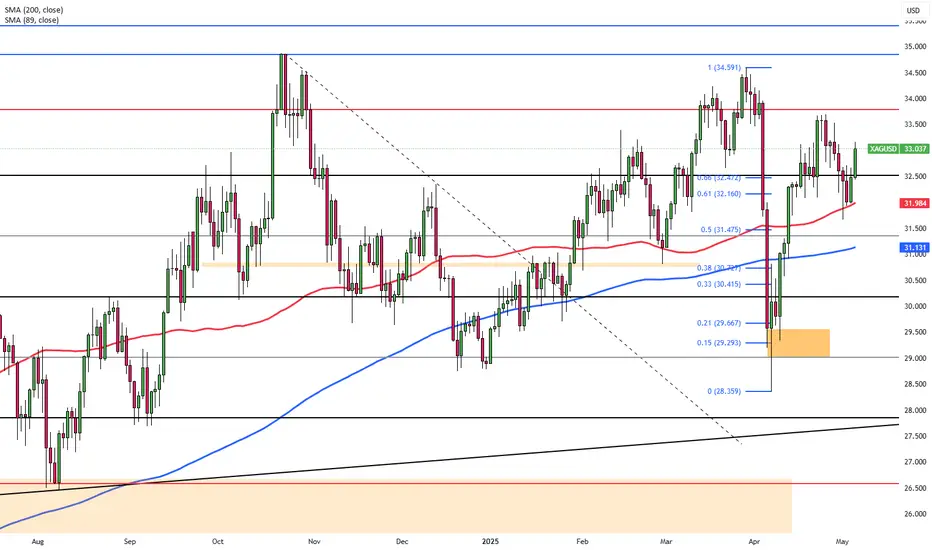
XAG/USD Stable Ahead of Fed DecisionSilver (XAG/USD) held steady on Tuesday, underpinned by safe-haven demand as U.S. tariff tensions and global growth concerns persisted. Although the U.S. dollar saw a slight recovery, silver maintained its ground with markets focused on the upcoming Federal Reserve policy decision. Expectations for unchanged rates and possible future easing could continue to lend support to silver in the near term.
The first resistance is seen at $33.80, with higher levels at $34.20 and $34.85 if momentum builds. Support begins at $32.00, followed by $31.40 and $30.20.
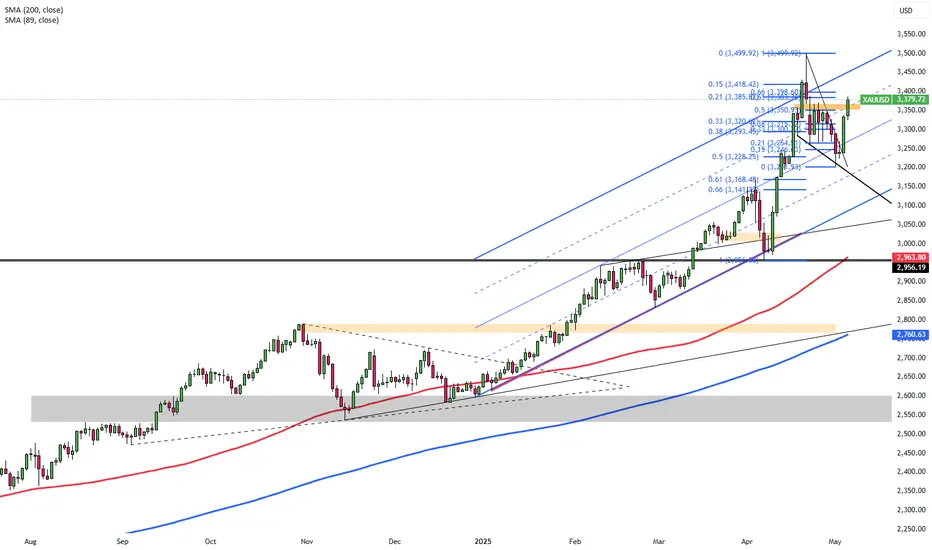
Gold Climbs on Safe-Haven DemandGold climbed to nearly $3,360 per ounce on Tuesday, marking its highest level in over a week, as renewed tariff threats from President Trump increased safe-haven demand. Trump announced a 100% tariff on foreign films and signaled upcoming measures targeting pharmaceuticals. Investors are now focused on the Federal Reserve’s policy decision, with rates expected to stay unchanged despite Trump’s push for cuts.
Resistance is expected at $3,385, then $3,450 and $3,500. Support stands at $3,300, followed by $3,265 and $3,200.
Gold may break out of the range and rise to 3450GOLD is rising and testing the resistance of the trading range. The important prerequisite is no drop after false breakout. Accordingly, buyers are building up and a close above 3367 may give a chance for a rise
The fundamental situation is changing, Trump is imposing new duties. In addition, gold is reacting to the escalation of the conflict in the Middle East. The metal continues to be a magnet for money
Scenario: A break of range resistance and consolidation above 3367 activates buying. The target of 3407 is 3444

USOIL:Adapt to the trendTechnical indicators such as moving averages and MACD have a certain degree of lag. The oil price repeatedly crossing the moving average system highlights the current stalemate between bulls and bears and the volatile and oscillating trend. USOIL is influenced by multiple factors, including geopolitical situations, economic data, and OPEC+ policies. Any sudden change may subvert the price trend, causing a certain deviation in technical analysis signals.
At present, with the trend clearly defined, trading in the direction of the trend is the optimal strategy. In the early trading session, we decisively went long at the price of $57. Currently, we are still holding the position, following the trend closely and waiting for the further expansion of the profit margin.
In the future, we will continue to monitor the market changes and update the trading strategies in real time.
I am committed to sharing trading signals every day. Among them, real-time signals will be flexibly pushed according to market dynamics. All the signals sent out last week accurately matched the market trends, helping numerous traders achieve substantial profits. Regardless of your previous investment performance, I believe that with the support of my professional strategies and timely signals, I will surely be able to assist you in breaking through investment bottlenecks and achieving new breakthroughs in the trading field.

HWQS could be a 5x to 10x stockHWQS breakout level is 10.55, It is expected to cross 50 and 100 level in next 6 to 18 months.
Note: This is not a buy/sell trade call.
Trade at your own will and use stop loss.

$MSFT BEST TRADE EVER? SUB $400 incoming by Mid JuneHey everybody, I hope that rally didn't kick your arses the way it did mine. You know, it's like I'm allergic to taking upside atm due to how bearish the MACRO is. Of course, with time, I'm going to assume I get most of my downside Price Targets in the next several years.
If you refer to the previous 23% Run to the 200DMA from the 50day in 2023 , NASDAQ:MSFT produced a 9 COUNT SELL SIGNAL , RALLIED for a week, and then dropped to new lows. That is what I am expecting here.
NASDAQ:MSFT looks absolutely ripe for the taking. We just rallied 17% and got the 9 COUNT SELL SIGNAL . Mind you, Gaps galore below. The Monthly and the Weekly both have Gaps . Charts do not like that, let me tell ya. I'm excited if you can't tell. NASDAQ:META and NASDAQ:AVGO look great as well. I'm still cautious about a spike out but I figure if we continue higher, i will have opportunity to grab more for cheaper as I am very confident in this move. The price moved above the DEATH CROSS and above the 200DMA . Not ever a healthy move if it moves Vertically from the 50 day and Crosses above both MA's without a stop. Mid June NASDAQ:MSFT should be at new lows.

XAUUSD M15 | Be arish Drop Based on the H4 chart, the price is approaching our sell entry level at 3374.12, a pullback resistance that aligns with the 61.8% Fibo retracement.
Our take profit is set at 3347.96, aligning with the 61.8% Fibo retracement.
The stop loss is set at 3392.59, above a swing high resistance.
High Risk Investment Warning
Trading Forex/CFDs on margin carries a high level of risk and may not be suitable for all investors. Leverage can work against you.
Stratos Markets Limited (tradu.com):
CFDs are complex instruments and come with a high risk of losing money rapidly due to leverage. 63% of retail investor accounts lose money when trading CFDs with this provider. You should consider whether you understand how CFDs work and whether you can afford to take the high risk of losing your money.
Stratos Europe Ltd (tradu.com):
CFDs are complex instruments and come with a high risk of losing money rapidly due to leverage. 63% of retail investor accounts lose money when trading CFDs with this provider. You should consider whether you understand how CFDs work and whether you can afford to take the high risk of losing your money.
Stratos Global LLC (tradu.com):
Losses can exceed deposits.
Please be advised that the information presented on TradingView is provided to Tradu (‘Company’, ‘we’) by a third-party provider (‘TFA Global Pte Ltd’). Please be reminded that you are solely responsible for the trading decisions on your account. There is a very high degree of risk involved in trading. Any information and/or content is intended entirely for research, educational and informational purposes only and does not constitute investment or consultation advice or investment strategy. The information is not tailored to the investment needs of any specific person and therefore does not involve a consideration of any of the investment objectives, financial situation or needs of any viewer that may receive it. Kindly also note that past performance is not a reliable indicator of future results. Actual results may differ materially from those anticipated in forward-looking or past performance statements. We assume no liability as to the accuracy or completeness of any of the information and/or content provided herein and the Company cannot be held responsible for any omission, mistake nor for any loss or damage including without limitation to any loss of profit which may arise from reliance on any information supplied by TFA Global Pte Ltd.
The speaker(s) is neither an employee, agent nor representative of Tradu and is therefore acting independently. The opinions given are their own, constitute general market commentary, and do not constitute the opinion or advice of Tradu or any form of personal or investment advice. Tradu neither endorses nor guarantees offerings of third-party speakers, nor is Tradu responsible for the content, veracity or opinions of third-party speakers, presenters or participants.

Brent under pressure: A rebound may be comingIn 2025, oil prices have come under significant pressure, falling more than 21% since the beginning of the year — from $75 to around $59 per barrel of #BRENT. This decline was driven by increased production from OPEC+ countries, weak global demand (particularly in Asia), heightened economic risks due to trade disputes, and rising output from non-OPEC producers such as the U.S. and Brazil. Together, these factors created an oversupply amid stagnant demand.
Currently, the oil market continues to be shaped by a range of influencing factors. While accurately predicting prices remains a challenge, several key drivers are likely to steer oil price movements in the near term. Here’s a look at the main bullish and bearish factors:
• Geopolitical tensions (Bullish driver): Ongoing or emerging conflicts in key oil-producing regions (such as the Middle East and Eastern Europe) raise concerns about potential supply disruptions. Even without actual disruptions, the perceived risk leads traders to factor in a “risk premium,” pushing prices higher. Any escalation could trigger sharp price spikes.
• OPEC+ policy (Bullish/neutral driver): The alliance’s production decisions remain a major influence on supply. If OPEC+ maintains or tightens its current output cuts to balance the market or target price levels, this will support price growth or at least stability. Conversely, quota breaches or output increases would weigh on prices.
• Global economic outlook (Bearish/bullish driver): The trajectory of global economic growth directly affects oil demand. Signs of GDP slowdowns in major economies (U.S., China, EU) tend to weaken demand and drag prices lower. On the other hand, if economic growth proves more resilient than expected, it would support oil demand and prices. Uncertainty over the growth path of many countries persists in 2025.
• Non-OPEC+ output growth (Bearish driver): Countries outside of the OPEC+ alliance — including the U.S. (shale), Brazil, Guyana, and Canada — continue expanding their production. Significant output increases from these nations could offset OPEC+ efforts and lead to market oversupply, applying downward pressure on prices.
• Energy transition and underinvestment (Medium-term bullish driver): ESG pressures, the global shift toward renewables, and uncertainty around long-term fossil fuel demand have led to underinvestment in new oil exploration and development. If existing capacity declines faster than new projects come online, a structural supply deficit could emerge, supporting higher prices even amid the energy transition.
FreshForex analysts believe that, given ongoing geopolitical risks, strict OPEC+ policies, and underinvestment in production, the oil market is nearing a potential upward reversal. A modest uptick in demand or increased tension could be enough to put oil back on a growth trajectory.
