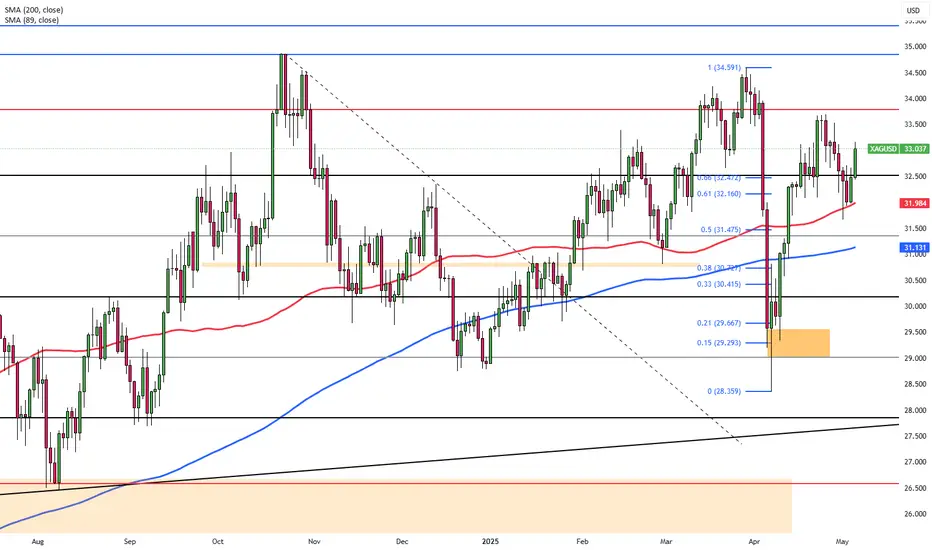
Silver (XAG/USD) Bullish Breakout Toward $34.40 Target Key Observations:
Support Zone (Around $32.00 - $32.50):
Price has respected this zone multiple times (green arrows indicate successful bullish reactions).
EMA 50 and 200 are aligned beneath current price, acting as dynamic support (bullish signal).
Resistance / Target 1 (~$33.40 area):
Price is approaching this area again, previously acting as a resistance.
Short-term traders might consider this a partial take-profit zone.
Target 2 (~$34.40 area):
If the resistance/Target 1 zone is broken and confirmed (as the black arrow suggests), the price could rally toward Target 2.
There's room for bullish continuation based on prior momentum and structure.
📈 Technical Outlook:
Trend: Bullish (higher lows, EMA crossover)
Bias: Bullish continuation if price breaks and retests the $33.40 zone.
Risk: Rejection at resistance could push price back toward the $32.00–$32.50 support.
Commodities

Long positions in the US market remain the main trend🗞News side:
1. The “demand shock” of the Trump administration’s tariffs on the global economy
2. The United States rejected Japan’s request for a comprehensive exemption from 10% reciprocal tariffs and country-specific tariffs in recent negotiations.
3. The conflict between Israel and the Houthis
📈Technical aspects:
The 4H golden moving average spreads upward, the MACD golden cross opens upward, and the 4H overall bullish trend is seen. Gold price encountered resistance at 3386 in the morning of the Asian session. This point can be used as a reference in suppressing the market outlook. If this resistance is effectively broken through, bulls are expected to continue to work towards the 3400 first-line mark above. The daily chart is positive, and the K-line combination is relatively strong. The US market is expected to break through 3386 and reach the space above 3400; the SMA10 moving average of 3370 continues to be bullish as the primary support, with strong resistance to 3400. Even if the price of gold in the US market rises and falls, the middle track of the Bollinger Bands still has good support. On the whole, we mainly focus on long positions in short-term trading. We can consider the 3370-3380 layout to go long, with the target looking towards 3400-3410 above.
If you agree with this view, or have a better idea, please leave a message in the comment area. I look forward to hearing different voices.
TVC:GOLD FOREXCOM:XAUUSD FXOPEN:XAUUSD FX:XAUUSD OANDA:XAUUSD

SILVER BEST PLACE TO SELL FROM|SHORT
SILVER SIGNAL
Trade Direction: short
Entry Level: 3,305.2
Target Level: 3,164.4
Stop Loss: 3,398.5
RISK PROFILE
Risk level: medium
Suggested risk: 1%
Timeframe: 12h
Disclosure: I am part of Trade Nation's Influencer program and receive a monthly fee for using their TradingView charts in my analysis.
✅LIKE AND COMMENT MY IDEAS✅

Gold Forecast: Haven Apetite Back in SightGold is currently testing the 0.618 Fibonacci retracement of the drop from $3,500 to $3,200, located at the $3,380 level.
A clear hold above 3390 could pave the way back toward $3,430 and the $3,500 resistance zone.
• A breakout above $3,500 may extend the rally toward $3,700 and the $4,000 target zone.
• On the downside, short-term support levels may be seen at $3,350, $3,300, and $3,260.
• A confirmed drop below $3,260 could trigger deeper downside risks, with potential moves back toward $3,200, $3,160, $3,080, and $3,000.
Written by Razan Hilal, CMT

Gold surges thanks to China buying goods, waiting for FED waveInternational gold prices jumped to 3,332 USD/ounce, up more than 72 USD compared to the bottom of last night's session. The main driving force came from the wave of gold buying in China, when concerns about the weakening economy caused people to massively turn to gold as a safe haven. The H4 chart shows a strong increase, EMA34 has crossed EMA89, establishing a clear short-term uptrend. If gold surpasses 3,340 USD, it is likely to head towards the old peak around 3,420–3,500 USD.
Crude oil prices are still fluctuating strongly around 57.2 USD/barrel, creating an unstable foundation for the commodity market. The FED will announce its policy in the early morning of May 8. Although it is expected to not change interest rates, any statement can move the market. This will be the next big catalyst for gold.

XAG/USD Stable Ahead of Fed DecisionSilver (XAG/USD) held steady on Tuesday, underpinned by safe-haven demand as U.S. tariff tensions and global growth concerns persisted. Although the U.S. dollar saw a slight recovery, silver maintained its ground with markets focused on the upcoming Federal Reserve policy decision. Expectations for unchanged rates and possible future easing could continue to lend support to silver in the near term.
The first resistance is seen at $33.80, with higher levels at $34.20 and $34.85 if momentum builds. Support begins at $32.00, followed by $31.40 and $30.20.
HWQS could be a 5x to 10x stockHWQS breakout level is 10.55, It is expected to cross 50 and 100 level in next 6 to 18 months.
Note: This is not a buy/sell trade call.
Trade at your own will and use stop loss.

XAUUSD M15 | Be arish Drop Based on the H4 chart, the price is approaching our sell entry level at 3374.12, a pullback resistance that aligns with the 61.8% Fibo retracement.
Our take profit is set at 3347.96, aligning with the 61.8% Fibo retracement.
The stop loss is set at 3392.59, above a swing high resistance.
High Risk Investment Warning
Trading Forex/CFDs on margin carries a high level of risk and may not be suitable for all investors. Leverage can work against you.
Stratos Markets Limited (tradu.com):
CFDs are complex instruments and come with a high risk of losing money rapidly due to leverage. 63% of retail investor accounts lose money when trading CFDs with this provider. You should consider whether you understand how CFDs work and whether you can afford to take the high risk of losing your money.
Stratos Europe Ltd (tradu.com):
CFDs are complex instruments and come with a high risk of losing money rapidly due to leverage. 63% of retail investor accounts lose money when trading CFDs with this provider. You should consider whether you understand how CFDs work and whether you can afford to take the high risk of losing your money.
Stratos Global LLC (tradu.com):
Losses can exceed deposits.
Please be advised that the information presented on TradingView is provided to Tradu (‘Company’, ‘we’) by a third-party provider (‘TFA Global Pte Ltd’). Please be reminded that you are solely responsible for the trading decisions on your account. There is a very high degree of risk involved in trading. Any information and/or content is intended entirely for research, educational and informational purposes only and does not constitute investment or consultation advice or investment strategy. The information is not tailored to the investment needs of any specific person and therefore does not involve a consideration of any of the investment objectives, financial situation or needs of any viewer that may receive it. Kindly also note that past performance is not a reliable indicator of future results. Actual results may differ materially from those anticipated in forward-looking or past performance statements. We assume no liability as to the accuracy or completeness of any of the information and/or content provided herein and the Company cannot be held responsible for any omission, mistake nor for any loss or damage including without limitation to any loss of profit which may arise from reliance on any information supplied by TFA Global Pte Ltd.
The speaker(s) is neither an employee, agent nor representative of Tradu and is therefore acting independently. The opinions given are their own, constitute general market commentary, and do not constitute the opinion or advice of Tradu or any form of personal or investment advice. Tradu neither endorses nor guarantees offerings of third-party speakers, nor is Tradu responsible for the content, veracity or opinions of third-party speakers, presenters or participants.

Brent under pressure: A rebound may be comingIn 2025, oil prices have come under significant pressure, falling more than 21% since the beginning of the year — from $75 to around $59 per barrel of #BRENT. This decline was driven by increased production from OPEC+ countries, weak global demand (particularly in Asia), heightened economic risks due to trade disputes, and rising output from non-OPEC producers such as the U.S. and Brazil. Together, these factors created an oversupply amid stagnant demand.
Currently, the oil market continues to be shaped by a range of influencing factors. While accurately predicting prices remains a challenge, several key drivers are likely to steer oil price movements in the near term. Here’s a look at the main bullish and bearish factors:
• Geopolitical tensions (Bullish driver): Ongoing or emerging conflicts in key oil-producing regions (such as the Middle East and Eastern Europe) raise concerns about potential supply disruptions. Even without actual disruptions, the perceived risk leads traders to factor in a “risk premium,” pushing prices higher. Any escalation could trigger sharp price spikes.
• OPEC+ policy (Bullish/neutral driver): The alliance’s production decisions remain a major influence on supply. If OPEC+ maintains or tightens its current output cuts to balance the market or target price levels, this will support price growth or at least stability. Conversely, quota breaches or output increases would weigh on prices.
• Global economic outlook (Bearish/bullish driver): The trajectory of global economic growth directly affects oil demand. Signs of GDP slowdowns in major economies (U.S., China, EU) tend to weaken demand and drag prices lower. On the other hand, if economic growth proves more resilient than expected, it would support oil demand and prices. Uncertainty over the growth path of many countries persists in 2025.
• Non-OPEC+ output growth (Bearish driver): Countries outside of the OPEC+ alliance — including the U.S. (shale), Brazil, Guyana, and Canada — continue expanding their production. Significant output increases from these nations could offset OPEC+ efforts and lead to market oversupply, applying downward pressure on prices.
• Energy transition and underinvestment (Medium-term bullish driver): ESG pressures, the global shift toward renewables, and uncertainty around long-term fossil fuel demand have led to underinvestment in new oil exploration and development. If existing capacity declines faster than new projects come online, a structural supply deficit could emerge, supporting higher prices even amid the energy transition.
FreshForex analysts believe that, given ongoing geopolitical risks, strict OPEC+ policies, and underinvestment in production, the oil market is nearing a potential upward reversal. A modest uptick in demand or increased tension could be enough to put oil back on a growth trajectory.

GOLD Regains Above 3'300, since US stocks "Relief Rally" is OverGold prices recently surged above $3,300 per ounce due to a confluence of geopolitical, economic, and monetary factors driving strong safe-haven demand:
Heightened geopolitical tensions, particularly the Israel-Hamas conflict and ongoing US-China trade disputes, have increased uncertainty, prompting investors to seek Gold as a secure store of value amid instability.
The US dollar's weakness, nearing a three-year low, has further boosted gold's appeal for holders of other currencies, making Gold relatively cheaper and more attractive globally.
What is most important also, U.S. stock rally has overed recently its tedious 10-Day winning strike (fortunately which finished not at all the history peaks). That's why investors may be turning back to tried-and-true assets like Gold.
Central banks, notably China’s, have been consistently buying gold to diversify reserves away from the US dollar, supporting prices significantly. China increased its Gold reserves for the 17th consecutive month, signaling sustained institutional demand.
Additionally, gold-backed exchange-traded funds (ETFs) have seen record inflows, reflecting growing investor interest beyond traditional buyers.
Market expectations of Federal Reserve interest rate cuts later in 2025 have also played a key role. Lower interest rates reduce the opportunity cost of holding non-yielding gold, enhancing its investment appeal amid inflation concerns and economic growth uncertainties.
This combination of geopolitical risk, a weaker dollar, central bank purchases, and anticipated monetary easing has propelled gold prices to historic highs, with forecasts suggesting further gains toward $3,500 per ounce.
--
Best #GODL wishes,
@PandorraResearch Team 😎

What adjustments will be made to oil prices?If traders don’t know how to trade, they can refer to the strategy of the Swing Trading Center. Earlier, it was announced to sell at 57.24. The lowest price reached around 56.3, and now the oil price has returned to 57.24. How to trade? If you are also confused, you can refer to the views of the Swing Trading Center.
At present, the supply of oil prices exceeds the demand, and some oil-producing countries will continue to increase the production of oil prices. The market has never recognized that oil will become a slow-selling product. Oil prices can be allowed to fall. But oil is not allowed to have no production capacity. I like this sentence.
Oil prices are expected to be mainly adjusted in the short term. The clear trading instructions have been announced in the Swing Trading Center. Stay tuned. Prevent missing good trading opportunities.

Israel-Houthi conflict could put gold back on the bull run🗞News side:
1. The Israeli president said that they are on the eve of a "large-scale attack on the Gaza Strip"
2. The Houthi armed forces stated that all Israeli airports are their targets
3. The situation of the Russian-Ukrainian war and the follow-up events of the India-Pakistan conflict
📈Technical aspects:
From a technical point of view, the current 1H moving average of gold is spreading upward, resulting in a small retracement. The short orders we hold are also closed in time at 3310 to lock in profits. After gold broke through the previous range, the upward channel opened. The 4H MACD diverged from the bottom, the golden cross and the green column enlarged, opening upward, and the overall 4H trend was bullish. Moreover, the support effect of the middle rail of the Bollinger Bands is obvious, and the gold price is accumulating strength below the upper rail of the Bollinger Bands, with strong upward momentum. Pay attention to 3310. After the support stabilizes, you can consider participating in long positions near 3310-3320, focusing on the 3290 line below; focus on 3375 above, and then consider participating in short sales near 3355-3365 after the pressure is under.
If you agree with this point of view, or you have a better idea, please leave a message in the comment area. I look forward to hearing different voices.
TVC:GOLD FOREXCOM:XAUUSD FXOPEN:XAUUSD FX:XAUUSD OANDA:XAUUSD

Crude oil, still bearishAs global supply increases and macro risks rise, the price downside range reappears. If tensions in the Middle East escalate further, it may cause market volatility. The original trend of rising first and then falling today, after the downhill new low, the rise continued, and there was pressure at 57.7. It is expected that there will be shocks and then declines. The original trend is still in a bearish trend, so we consider shorting as the main. Pay attention to the 57.7 resistance and 55.5 support.

After a period of fluctuation, it will continue to decline.WTI crude oil has recouped part of the decline from the sharp drop at the start of this week. It was quoted at $57.55 per barrel during intraday trading. OPEC+ has unexpectedly increased production again, and WTI crude oil has continued the bearish trend that has gradually taken shape since March. With the increase in global supply and the rise in macro risks, the downward price range has emerged once again. If the tensions in the Middle East escalate further, it may trigger market volatility. The eight core member states of the organization, led by Saudi Arabia, have agreed to increase daily production by 411,000 barrels in June, which is the same as the unexpected production increase in May. The cumulative production increase now exceeds 800,000 barrels per day, marking an important step towards canceling the target of the voluntary production cut of 2.2 million barrels per day that has been promised since 2022. Crude oil showed a trend of rising first and then falling today. After breaking through a new low, the upward movement continued. It faced resistance after reaching
you are currently struggling with losses, or are unsure which of the numerous trading strategies to follow, at this moment, you can choose to observe the operations within our channel.

SOYBEAN - wyckoff accumulation3 Monthly turnaround on wyckoff accumulation
also a monthly reversal
On week timeframe it also looks like a reversal. the price is pushing the upper boundary of the sideways.

How to plan when gold’s rise encounters resistance🗞News side:
1. Pay attention to the recent trade situation and news about the Fed's interest rate cuts
2. Be wary of DXY trends
3. The situation of the Russian-Ukrainian war and the follow-up events of the India-Pakistan conflict
4.Trump imposes 100% tariff on non-US films
📈Technical aspects:
Compared with today's market, the morning rise happened to be a sideways price, breaking through the previous high point. In a volatile rise, it doesn't matter. It is very likely that in the later trend, the price will return to the starting point or even lower, but it can continue to rise. This is a feature of the shock. At the same time, the current market is not extremely strong, and it is still in a volatile rise. Therefore, do not chase long, but retrace as much support as possible.
🎁SELL 3315-3325
🎁TP 3280-3270
🎁BUY 3270-3280
🎁TP 3300-3310
If you agree with this point of view, or you have a better idea, please leave a message in the comment area. I look forward to hearing different voices.
OANDA:XAUUSD FX:XAUUSD FXOPEN:XAUUSD FOREXCOM:XAUUSD TVC:GOLD

How to arrange when gold fluctuates upward🗞News side:
1. Pay attention to the recent trade situation and news about the Fed's interest rate cuts
2. Be wary of DXY trends
3. The situation of the Russian-Ukrainian war and the follow-up events of the India-Pakistan conflict
4.Trump imposes 100% tariff on non-US films
📈Technical aspects:
In the morning, we seized the opportunity to short and earn a wave of profits. Then gold fell back to 3255 and rebounded again, moving upward in a fluctuating manner. From the hourly chart, Friday's low was around 3220 and today's high was around 3270. In this trend, 3255 may be the short-term low for short-term trading. From the daily chart, gold has closed the cross star. The current gold price is more critical. If it breaks through 3285, it may continue to rise to the 3295-3300 line. If the gold price fails to effectively break through 3285, it may usher in a wave of retracement. It will be a good time for us to go long.
If you agree with this point of view, or you have a better idea, please leave a message in the comment area. I look forward to hearing different voices.
TVC:GOLD FOREXCOM:XAUUSD FXOPEN:XAUUSD FX:XAUUSD OANDA:XAUUSD

Bullfinder's Breakout Commodities - Natural GasWelcome to Bullfinder's Breakout Commodities - Commodities with breakout potential.
In this edition, we'll be looking at PEPPERSTONE:NATGAS ...
Our Team has identified that this code is at a point of particular interest & potential volatility.
After re-rating Natural Gas's momentum to Bullish on the 26th of Nov 2024, our Team has again set eyes on the commodity, noting the following important reference point...
If price can hold above $2.950 ... Significant Bullish potential may be unlocked.
If however price falls below $2.950 ... Significant Bearish risk may come into play.
We're inspired to bring you the latest developments across worldwide markets, helping you look in the right place, at the right time.
Thank you for reading! Stay tuned for further updates, and we look forward to being of service along your trading & investing journey...
Disclaimer: Please note all information contained within this post and all other Bullfinder-official Tradingview content is strictly for informational purposes only and is not intended to be investment advice. Please DYOR & Consult your licensed financial advisors before acting on any information contained within this post, or any other Bullfinder-official TV content.

Silver H4 I Bearish Reversal Based on the H4 chart, the price is rising toward our sell entry level at 32.46, a pullback resistance.
Our take profit is set at 31.50, a pullback support that aligns with the 50% Fibo retracement.
The stop loss is set at 33.15, an overlap resistance.
High Risk Investment Warning
Trading Forex/CFDs on margin carries a high level of risk and may not be suitable for all investors. Leverage can work against you.
Stratos Markets Limited (tradu.com):
CFDs are complex instruments and come with a high risk of losing money rapidly due to leverage. 63% of retail investor accounts lose money when trading CFDs with this provider. You should consider whether you understand how CFDs work and whether you can afford to take the high risk of losing your money.
Stratos Europe Ltd (tradu.com):
CFDs are complex instruments and come with a high risk of losing money rapidly due to leverage. 63% of retail investor accounts lose money when trading CFDs with this provider. You should consider whether you understand how CFDs work and whether you can afford to take the high risk of losing your money.
Stratos Global LLC (tradu.com):
Losses can exceed deposits.
Please be advised that the information presented on TradingView is provided to Tradu (‘Company’, ‘we’) by a third-party provider (‘TFA Global Pte Ltd’). Please be reminded that you are solely responsible for the trading decisions on your account. There is a very high degree of risk involved in trading. Any information and/or content is intended entirely for research, educational and informational purposes only and does not constitute investment or consultation advice or investment strategy. The information is not tailored to the investment needs of any specific person and therefore does not involve a consideration of any of the investment objectives, financial situation or needs of any viewer that may receive it. Kindly also note that past performance is not a reliable indicator of future results. Actual results may differ materially from those anticipated in forward-looking or past performance statements. We assume no liability as to the accuracy or completeness of any of the information and/or content provided herein and the Company cannot be held responsible for any omission, mistake nor for any loss or damage including without limitation to any loss of profit which may arise from reliance on any information supplied by TFA Global Pte Ltd.
The speaker(s) is neither an employee, agent nor representative of Tradu and is therefore acting independently. The opinions given are their own, constitute general market commentary, and do not constitute the opinion or advice of Tradu or any form of personal or investment advice. Tradu neither endorses nor guarantees offerings of third-party speakers, nor is Tradu responsible for the content, veracity or opinions of third-party speakers, presenters or participants.

XAUUSD H4 | Bearish Reversal Based on the H4 chart, the price is approaching our sell entry level at 3275.86, a pullback resistance that aligns with the 50% Fibo retracement.
Our take profit is set at 3222.63, an overlap support.
The stop loss is set at 3314.24, a swing high resistance.
High Risk Investment Warning
Trading Forex/CFDs on margin carries a high level of risk and may not be suitable for all investors. Leverage can work against you.
Stratos Markets Limited (tradu.com):
CFDs are complex instruments and come with a high risk of losing money rapidly due to leverage. 63% of retail investor accounts lose money when trading CFDs with this provider. You should consider whether you understand how CFDs work and whether you can afford to take the high risk of losing your money.
Stratos Europe Ltd (tradu.com):
CFDs are complex instruments and come with a high risk of losing money rapidly due to leverage. 63% of retail investor accounts lose money when trading CFDs with this provider. You should consider whether you understand how CFDs work and whether you can afford to take the high risk of losing your money.
Stratos Global LLC (tradu.com):
Losses can exceed deposits.
Please be advised that the information presented on TradingView is provided to Tradu (‘Company’, ‘we’) by a third-party provider (‘TFA Global Pte Ltd’). Please be reminded that you are solely responsible for the trading decisions on your account. There is a very high degree of risk involved in trading. Any information and/or content is intended entirely for research, educational and informational purposes only and does not constitute investment or consultation advice or investment strategy. The information is not tailored to the investment needs of any specific person and therefore does not involve a consideration of any of the investment objectives, financial situation or needs of any viewer that may receive it. Kindly also note that past performance is not a reliable indicator of future results. Actual results may differ materially from those anticipated in forward-looking or past performance statements. We assume no liability as to the accuracy or completeness of any of the information and/or content provided herein and the Company cannot be held responsible for any omission, mistake nor for any loss or damage including without limitation to any loss of profit which may arise from reliance on any information supplied by TFA Global Pte Ltd.
The speaker(s) is neither an employee, agent nor representative of Tradu and is therefore acting independently. The opinions given are their own, constitute general market commentary, and do not constitute the opinion or advice of Tradu or any form of personal or investment advice. Tradu neither endorses nor guarantees offerings of third-party speakers, nor is Tradu responsible for the content, veracity or opinions of third-party speakers, presenters or participants.

Today's gold short-term analysisOn Friday, stronger-than-expected U.S. non-farm data showed that tariff uncertainty has not yet hit the U.S. job market, prompting traders to reduce bets on an impending rate cut. However, although the non-farm data was relatively solid, it failed to reverse the overall weakness of U.S. economic data last week. In addition, there was some optimism about tariffs in the market. The dollar index eventually closed down 0.15% at 100.03 that day; the offshore renminbi rose above the 7.21 mark against the U.S. dollar, up nearly 700 basis points during the day.
U.S. Treasury yields rebounded for the second consecutive day, with the benchmark 10-year Treasury yield closing at 4.314%; the two-year Treasury yield, which is more sensitive to monetary policy, closed at 3.832%.
Gold's safe-haven appeal has weakened due to strong U.S. employment data and progress in international trade negotiations. Spot gold closed near the flat plate, barely holding the $3,240 mark
From the daily performance of gold, gold started to bottom out and rebound overnight, and finally closed above the middle track of the Bollinger Band. Then the market rebounded and continued to rise. Although the Asian session fell back and tested around 3227, it finally held the support level. The MACD technical indicator showed a dead cross downward. Although the selling was dominant, it was difficult to change the potential of the short-term market rebound.
From the perspective of gold in 4 hours, the market lows are constantly rising, and the highs are also refreshed. Buying is still the mainstream in the short term. The MACD technical indicator began to show a golden cross upward. The upper suppression level focuses on the vicinity of 3273-3278, and the short-term support focuses on the support near 3235-3228. It is still not recommended to sell in short-term trading. Last Friday was also an important date for the market to have a turning point. If gold starts to rise from the bottom, then this round of adjustment may also be temporarily over.
Overall, the short-term operation strategy for gold today is to buy on pullbacks and sell on rebounds. The short-term focus on the upper side is 3280-3290 resistance, and the short-term focus on the lower side is 3240-3235 support.
Buy in the range: 3240-3238, SL: 3228, TP: 3260-3270
Sell in the range: 3280-3282, SL: 3292, TP: 3250-3260
Key points:
First support: 3240, second support: 3230, third support: 3220
First resistance: 3280, second resistance: 3290, third resistance: 3300
More sharing, free viewing

Gold Setup: Range or Rip? Here's the PlaybookGold’s been on a tear lately — driven by safe haven demand as real yields soften and global uncertainty lingers.
But here’s where things get interesting...
We’re now watching what could be a textbook head and shoulders pattern start to take shape.
📊 Current Range:
Right now, price is stuck between 3380 and 3280 — and it’s acting like it knows it.
⚡ Possible Scenarios:
🔁 Scenario 1: Range Play
Short near 3380
Long near 3280
Let it ping-pong and catch the edges.
📈 Scenario 2: Breakout Long
Confirmation above 3380
Look for momentum follow-through into 3420+
📉 Scenario 3: Breakdown Short
Break below 3280
Eyes on the 3220s for a potential flush
🧠 The key? Drop to the lower time frames near these zones and wait for clean setups during active sessions — especially NY open or post-data volatility.
💬 How are you playing this? Breakout or bounce? Drop your take 👇
#gold #tradingview #futures #technicalanalysis #metals #xauusd #tradingstrategy #macro

Whats the direction for the Week? We should wait to see...Looking for price to go Bullish...But i need to allow Monday to play out first to give us a solid direction. They could go bullish early or they could pull back to give a lower entry first.
