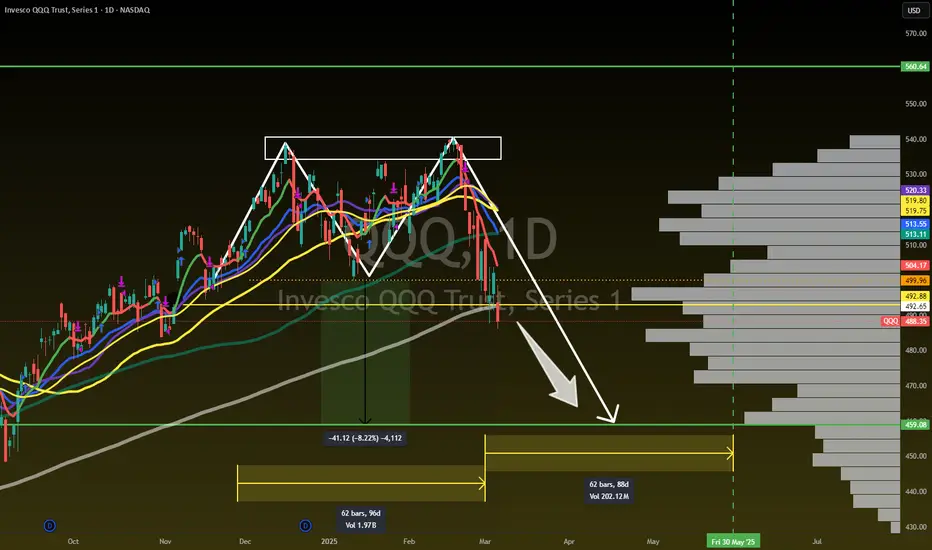
The Double Top is in on QQQNASDAQ:QQQ - DOUBLE TOP 🗻🗻
No Denying it NOW!
Measured Move is $459 by 30May
Not financial advice
Correction
What About The RSI? BitcoinDaily MA200 has been working as support; support confirmed, for Bitcoin on the daily timeframe. This is a good signal, a strong one and all is good.
I also looked at the trading volume and this is also good. Clearly rising for a while now. A bullish bias.
I was wondering about the RSI.
How is Bitcoin's daily RSI looking like?
Great news.
Bitcoin's daily RSI hit its lowest level in February 2025 since August 2023. That's a strong one.
The low in February on this oscillator ended up being higher than August 2024. This produces the hidden bullish divergence signal. Very interesting.
MA200 sits perfectly between 0.5 and 0.618 Fib. retracement level support. This level now sits at $83,000. Bitcoin will never trade again below 80K. The bottom is in.
Hold on, I have more. Let's revisit an update that I shared in a previous publications (5 days ago) related to the correction dynamics.
🅱️ Bitcoin's Correction Is Over
An advance from $74,000 to 110K is not the same as an advance from $20,000 to 74K.
The correction from 74 to 49K, -33%, took five months because of the prolonged consolidation between 20,000 and 74,000.
The correction from 110 to 78K totals a nice -28%. Support is found at 0.5 Fib. retracement in relation to the previous bullish phase. This is the exact same level that was hit in the previous correction from 74 to 49K in July/August 2024. The current correction does not need to extend any longer.
The rise from 49 to 110K amounts to 124%.
The rise from 20 to 74K amounts to 270%.
It is logical for the previous correction to be stronger than the current one because of the size of the bullish wave. Since this bullish wave was smaller, the correction also becomes small.
We are now in 2025 and everybody knows that Bitcoin is going up.
If the market couldn't push Bitcoin past 49K last year when doubt was the norm, remember the evil tendencies of the SEC, why would the market produce a stronger correction now when the SEC has been transformed to reasonable and conscious? Instead of a weapon this institution is now doing the job that it was supposed to do in the first place; guidance and support. The SEC is now offering strong support to the Cryptocurrency market and this is great.
Conditions are better now and fundamentals continue to improve.
There is reason to believe that the bottom is in, not only based on the correction size but also based on the fact that Altcoins are turning strongly green.
The correction is over. This is great news.
We are going up.
Once the market hits bottom... The new All-Time High will happen in late 2025.
Bitcoin can easily hit $180,000, $200,000 or more (can be $500,000 to $1,000,000). The Altcoins portion of the market will blow up. Not everything will grow, but most of the market will.
All those projects without a real base will lose momentum and the real Cryptocurrencies will shine the most.
There are lots of choices; choose wisely.
Thanks a lot for your continued support.
Thank you for reading.
Namaste.

$BTC Critical Support Retest at 50WMA - Must Read!50WMA is a CRITICAL SUPPORT to watch for ₿itcoin.
Historically, if CRYPTOCAP:BTC closes below it for more than one week, it signals the beginning of the BEAR MARKET.
We’ve only seen BTC close beneath the 50WMA once in its history during a Post-Halving year, and that was in 2021, but then rallied to a new ATH.
People often ask me what would invalidate my bull market thesis;
this is one of them.
I’ll be watching this support very closely, and if BTC closes below it for more than 2 weeks, i’m probably selling a good portion of my stack until we get more clarity in the market.
However, this could very well have been the bottom of this correction.
BTC is known to have a big Q1 drawdown in Post-Halving years.
2013 was a massive -82% correction over a week.
2017 gave us two.
January -34% over 7 days.
March -33% over 14 days.
January 2021 gave us -31% over 14 days.
The current correction we’ve seen with BTC has been the longest over 35 days with -28%.
$75k would be a -31% correction, which would line up perfectly with the previous cycle.
That’s the line in the sand for me.
If we did see the bottom with this 28% correction, that would line up with the diminishing return theory.

$CRM short setup part two. $280 target.Check out my recent post on $CRM. This name is down from it’s highs already 11% or so but 20% is correction territory so I can see this name hitting $280 area. $280-$285. Multi day put swing.
WSL

$104K and Counting: Can Bitcoin Sustain Its Momentum?COINBASE:BTCUSD - Daily
Current Price: 97,520
Executive Summary:
Is Bitcoin Set for a Correction After Hitting $104,000?
Bitcoin has hit significant milestones, with two of our predicted targets—$90,000 and $100,000—successfully achieved, delivering a remarkable gain of 46.44% and 3,307,221 pips. After climbing to $104,000, Bitcoin entered extreme overbought territory across daily, weekly, and monthly charts, signaling exhaustion. With the formation of an ascending channel and overbought signals, a potential correction could be on the horizon. Here’s what to expect next.
Analysis:
In our earlier analysis, we predicted key price targets of $90K, $100K, and $110K. Bitcoin successfully hit $90K and $100K, eventually climbing to $104K—a remarkable gain of 46.44% and 3,307,221 pips. However, this rally propelled Bitcoin into extreme overbought territory across multiple timeframes, signaling a potential need for correction.
On November 6, Bitcoin broke out of a falling wedge/handle pattern, driving the price to $104K. Since November 12, it has been ascending within a channel—a formation that often precedes a downward correction. Coupled with extreme overbought conditions on daily, weekly, and monthly charts, Bitcoin now shows clear signs of buyer exhaustion.
Potential Correction Level:
Fibonacci Retracement (50%): $85,327.80
Key Levels to Watch:
• Extreme Overbought: $112,500
• Overbought Resistance: $106,250
• Ultimate Resistance: $100,000
• Major Support: $75,000
Thank you for taking the time to read this analysis. Wishing you great success in your trading journey! Always prioritise proper risk management to achieve sustainable growth in the markets. Good luck with your trades!

O 1D Investment Aggressive Trend TradeAggressive Trend Trade
- short impulse
+ biggest volume TE / T1
+ support level
+ biggest volume 2Sp-
+ weak test
+ first bullish bar close entry
Calculated affordable stop limit
1 to 2 R/R take profit
Monthly Trend
"+ long impulse
+ 1/2 correction
+ SoS level
+ support level
+ weak approach"
1Y Trend
"+ long balance
+ volumed manipulation
- neutral zone"

Google - This Can Be A Major Opportunity!Google ( NASDAQ:GOOGL ) is rejecting the resistance:
Click chart above to see the detailed analysis👆🏻
Over the past couple of years, Google has actually always been rejecting the upper channel resistance trendline with the only exception being the 2021 breakout. Following this previous behaviour, another bearish rejection is probable although bulls remain overall in control.
Levels to watch: $200, $150
Keep your long term vision,
Philip (BasicTrading)

#EURUSD 1H Potential riseHello Traders
I see the EUR/USD bullish wave and the price has fallen in a corrective manner. I expect another bullish wave to start from here.

BITCOIN → Consolidation. Shake-out before growth to 110KBINANCE:BTCUSD is consolidating both locally and globally. The market lacks drivers, but at the same time, big players continue to keep the coin from falling further
Bitcoin is in consolidation or in a localized correction due to Trump putting cryptocurrencies on the back burner. No supportive executive orders have been issued, except that there is a little noise around the federal reserve, but only from the states and that is in question what assets will fill this fund, confiscated or still politicians will start buying BTC. As for the global economy regarding bitcoin, a lull has been forming lately. Except for SOL and DOGE, for which the SEC has already started accepting applications to launch ETFs.
Technically, I'm keeping an eye on local consolidation: 94800 - 98400. A breakout of resistance could give hope to the market and in that case bitcoin could strengthen to 102 - 107K
Resistance levels: 98.4, 100.2, 102.7
Support levels: 94.8, 91.3
But, based on the general technical situation, there is a huge pool of liquidity in the 91-90K zone and before further growth the price may test this zone and form a false breakdown before the market returns to active buying.
Regards R. Linda!

To people (Realtors) Is there a home price correction?My case in point is this chart -- that there will be a much bigger home price correction this time around.
I do not want to even try and explain this chart.

OM's Meteoric Rise: Time to Buy the Dip or Short the Top?OM has been on an astronomical journey, soaring from $0.0173 on 12 October 2023 to an all-time high of $6.485 on 7 February 2025 – a jaw-dropping +37,494% increase in just 484 days. Currently ranked 26 with a market cap of $5.5B, OM’s meteoric rise has everyone asking: Is OM topping out, or is there still more upside? Could a significant correction be on the horizon? Let’s dive into the technicals and explore our trade setups with high conviction, backed by a wealth of confluence.
Market Structure & Historical Context
Between mid-November 2024 and the end of January 2025, OM traded within a 70-day range, oscillating between $4.4 and $3.3. The Point of Control (POC) for this range is around $3.87, marking a critical level where price action has repeatedly converged. This trading range provides the backdrop for our analysis, highlighting both key support and potential resistance zones that may dictate OM's next move.
Key Support Zones & Confluence
A multitude of technical indicators converge around the $3.87 level, making it a crucial support area:
1.) Fibonacci Retracement Confluence:
Taking the Fibonacci retracement from the low at $3.173 (25 January 2025) to the recent high, the 0.786 retracement level lands at $3.8818—just a hair above our POC.
2.) Channel Median Line:
The median line drawn through the highs and lows of the 70-day trading range reinforces the significance of this area.
3.) Moving Averages:
The weekly 21 EMA/SMA currently sits between $3.63 and $3.31, and as they trend higher, we can expect them to approach $3.9 in the coming week, offering additional support.
4.) Trend Indicator (Beta):
On the 4-hour timeframe, my new upcoming Trend Indicator highlights bullish momentum edging around $3.75, further consolidating support.
5.) Fibonacci Extension:
The 1.271 Fibonacci extension from the previous low at $4.4 places a key level at $3.8329, adding yet another layer of confluence.
Collectively, these factors create a robust support zone, suggesting that any retracement towards this level might serve as an attractive entry point for long positions.
Resistance Levels & Trade Setups
Resistance Analysis
OM has repeatedly faced strong resistance near the $6 mark:
Rejection Patterns:
The chart reveals multiple rejections around $6, with a notable Swing Failure Pattern (SFP) at $6.295 that confirmed bearish pressure.
Short Trade Opportunity:
Previously, the rejection at $6.295 offered a low-risk short trade: risking about 3% for a potential gain of 17% to the Fibonacci retracement level of 0.618 (approximately $5.1965), which was nearly reached.
Potential Trade Setups
Short Trade Setup
With OM encountering strong resistance around $6 and historical rejections at key levels, a breakdown could spark further downward movement.
Entry & Stop Loss:
Entry: Initiate a short position if price fails to break decisively above $6.
Stop Loss: Set a 5% stop loss above the previous SFP.
Targets & Risk/Reward:
Targets: Consider targets at $4.7 (yielding approximately +22%) or $4.0 (around +34%).
Risk/Reward: This setup offers an impressive risk/reward ratio of 4:1 to 6:1.
Long Trade Setup
The multiple layers of support around $3.87 present an attractive opportunity for long entries should the price retrace, despite the overall bullish structure. Historically, OM has bounced off its 21 daily EMA/SMA, as marked by previous green box zones on the chart.
Entry Strategy & Laddering:
Entry: Look for long entries if price pulls back to the support zone.
Laddered Positions: Consider scaling in with positions between $4 and $3.75. This dollar-cost averaging (DCA) approach will help optimise your entry over the pullback.
Stop Loss & Target:
Stop Loss (SL): Set your stop loss below $3.58 to account for volatility while protecting against a breakdown.
Take Profit: Target the $4.5 level as your primary take profit.
Risk/Reward:
With laddered entries between $4 and $3.75, this setup provides an approximate risk/reward ratio of 2:1, though the exact ratio will depend on your specific DCA entry points.
Final Thoughts
Only execute shorts with clear confirmation from order flow analysis.
Conversely, a pullback towards the support zone presents an appealing long opportunity for those confident in OM’s enduring momentum.
As always, it’s essential to monitor price action closely and adjust your strategy as new data unfolds.
Okay. Wrapping up this analysis. Wishing you all profitable and successful trades! =)

FB (META), What is going on?Stocks fall one after another !
We Saw a considerable decline in FB (Meta) Stoc k after earning report after hours of last trading session. What is happening for FB (Meta) in terms of Elliott waves?
FB (META), has likely completed a primary degree ascending cycle started on 4th Sept 2012 at 17.55 USD . This cycle took 9 years to be completed therefore, we can imagine how boring will be the correction phase before completion !
If true , FB (META) has started a correction decline form ATH (384.33) down to Retracement levels with today's pre-market price around 0.382 level.
Although 0.382 retracement is also possible for wave 2s , I give very low possibility to bounce back from this level according to timing and corrective patterns.
Retracement down to 200 , 157 and even 96 USD corresponding to 0.5 , 0.618 Golden Ration and 0.786 Retracement levels is very possible, I tried to show the probability of each possible Retracement with thickness of arrows with the thickest to be the most probable ( As I suppose ) and vice versa.
After completion of this primary degree wave 2 , there will be a huge up going wave which is primary degree wave 3 . This wave 3 will push the price up to at least 700 USD and even higher ( Very good news for long term investors ) depending on at which retracement level this boring correction phase ends. It is too soon to talk about this target we can update our targets in next years !
Please note this is a very long term prediction so, there will be lots of ups and downs and fluctuations in our path. What is happening on FB (META) is more than likely similar to whats happened for ETSY, SHOPIFY, SQ and many others in the market.
As I showed on the chart, this is what I see as the most probable scenario which means there are more optimistic scenarios. Mots probable more optimistic scenario is that FB ( META) is just correcting the wave cycle labeled as wave (5). As far as the stock is trading above 170 USD, this scenario is valid.
Hope this analysis to be helpful and wish you all the best.

Markup phase begun ?It seems like a massive accumulation phase has been completed in paypal and potentially a markup phase has begun. If an impulsive move has begun, then its a good trade to go long on a correction.

XRP Short XRP historically fails after it has a rally. Each time on this monthly chart, XRP has pulled back drastically. With 3 months worth of growth, we can expect the prifit taking to occur to account for tax liabilities for the upcoming tax season as profit taking will take place to cover.
This pull back needs fuel to take it to the next level. Next major price level based on the 2017 impulse is $4.25, then $5.41, then $8.75, then $12.10, then $14.17

#BTCUSD #BITCOIN#BTCUSD - Update, we are still trying to complete a correction wave.
I still see BTCUSD retracing to $85-86,000 popping again

Gold Is Eyeing 2800 AreaGold remains in a strong intraday five-wave bullish impulse and the recent intraday three-wave a-b-c decline indicates for wave 4 correction that stopped perfectly at the former wave "iv" swing low and 38,2% Fibonacci retracement, which is a textbook pattern by Elliott wave theory. With the current bounce, be aware of a bullish resumption within wave 5 that can send the price towards 2800 area, especially if breaks above intraday channel resistance line.

EURUSD Is Trading At Strong Support While Finishing A CorrectionEURUSD came lower as expected, broke into the fifth wave we talked about last few weeks, and it finally moved into important support levels at 1.02 area. Notice that we are actually tracking the final leg within this downtrend from 2024 high, so ideally its wave C of a higher degree A-B-C correction, meaning that pair can stabilize still some time this month, ideally after the completion of an ending diagonal around important and golden 61,8% Fibonacci retracement. Even RSI is showing a divergence. A bounce in impulse back above 1.0435 will suggest that low is forming.

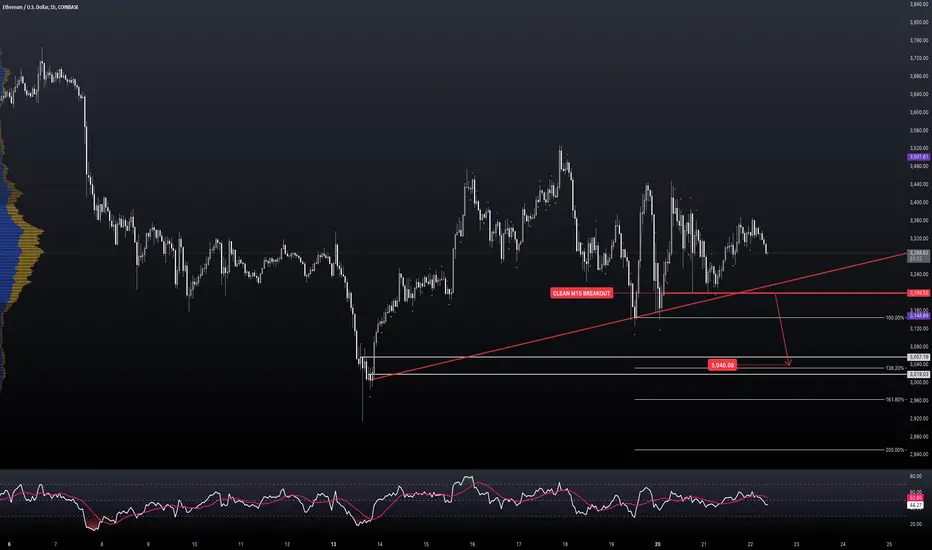
ETHEREUM // short ideaThe correction is still valid, and this is a risky bet, but if the price breaks below this M15 breakout significantly, the market my revisit the recent valley.
———
Orange lines represent impulse bases on major timeframes, signaling the direction and validity of the prevailing trend by acting as key levels where significant momentum originated.
Level colors:
Daily - blue
Weekly - purple
Monthly - magenta
H4 - aqua
Long trigger - green
Short trigger - red
———
Stay grounded, stay present. 🏄🏼♂️
<<please boost 🚀 if you enjoy💚
DAX // possible start of the correctionThe market has reached the daily target fibo 200 and broke the H4 structure by breaking below the H4 impulse base.
If H4 makes a new low before making a new high, the countertrend becomes valid.
———
Orange lines represent impulse bases on major timeframes, signaling the direction and validity of the prevailing trend by acting as key levels where significant momentum originated.
Level colors:
Daily - blue
Weekly - purple
Monthly - magenta
H4 - aqua
Long trigger - green
Short trigger - red
———
Stay grounded, stay present. 🏄🏼♂️
<<please boost 🚀 if you enjoy💚

Dogegov ($DOGEGOV): Another 100% + returnI spend time researching and finding the best entries and setups, so make sure to boost and follow for more.
---SEE MY PREVIOUS ANALYS ON PREVIOUS ENTRY---
Dogegov ( KUCOIN:DOGEGOVUSDT ): Awaiting Optimal Entry Amidst Recent Developments
Trade Setup:
- Entry Price: $0.12455 (Pending Activation)
- Stop-Loss: $0.08754
- Take-Profit Targets:
- TP1: $0.27494
- TP2: $1.01000
Current Price: $0.23538
Recent Developments:
- Department of Government Efficiency ( KUCOIN:DOGEGOVUSDT ): President-elect Donald Trump has announced the formation of the Department of Government Efficiency, abbreviated as DOGE, to be led by Elon Musk and Vivek Ramaswamy. This initiative aims to streamline government operations and reduce wasteful expenditures.
- Market Reaction: Following the announcement, Dogecoin's value has surged, reflecting increased investor interest and market optimism.
Technical Analysis:
- Support Levels: Immediate support is observed around $0.20000, with stronger support near the anticipated entry price of $0.12455.
- Resistance Levels: Key resistance is identified at $0.30000, aligning with TP1, and a significant psychological barrier at $1.00000, just below TP2.
- Moving Averages: The 50-day EMA is trending upwards, indicating sustained bullish momentum.
- Relative Strength Index (RSI): Currently at 70, suggesting overbought conditions; a potential pullback to the entry price is plausible.
Market Sentiment:
The convergence of cryptocurrency culture with political developments has heightened interest in $DOGEGOV. The symbolic association with the Department of Government Efficiency has attracted both crypto enthusiasts and mainstream investors, contributing to increased trading volumes and positive sentiment.
Risk Management:
The proposed stop-loss at $0.08754 limits downside risk to approximately 30% from the entry point. TP1 offers a potential gain of 121%, while TP2 presents an opportunity for a 711% return, indicating a favorable risk-to-reward ratio for this trade setup.
Conclusion:
The intersection of recent political announcements and the cryptocurrency market has created a unique opportunity with $KUCOIN:DOGEGOVUSDT. Awaiting a retracement to the entry price of $0.12455 could provide an advantageous position to capitalize on potential upward movements, supported by current market sentiment and technical indicators.
When the Market’s Call, We Stand Tall. Bull or Bear, We’ll Brave It All!
*Disclaimer: This analysis is for informational purposes only and does not constitute financial advice. Conduct thorough research before making any investment decisions.*

Bitcoin - New All time high incomingAs you can see, Bitcoin is about to close a weekly candle over the previous VSA resistance. $TRUMP token has also pushed bullish narrative onto public therefore I think that this correction is over.
Next stop is around 127k and after that we should reconsider whether there will be continuation or that's it.

Potential rise for goldThe impulsive wave is bullish and a correction pattern. We expect another bullish impulsive wave
