Bitcoin 80000 Very Soon The support of $56000 (coinciding with the 0.618 Fibonacci level) reached in April has proven to be solid and at this moment Bitcoin is aggressively attacking a dynamic resistance created by its historical high of $74000 which meets other peaks previously created around the price of $72000.
At this moment in the OrderBook there is considerable liquidity at the $72,000 level, approximately 3,000 Bitcoins. Subsequently it is possible to still notice a lot of liquidity in the immediately following levels, an indication of stop liquidity probably for Long orders.
There currently appears to be no liquidity near the all-time high of $74,000.
Personally, I remain bullish in the very short term and, as indicated by the Fibonacci extension plotted on the chart, Bitcoin's next target is $80,000
Cripto

MARA looking bullish Inverted H&S with momentum coming.
Marathon Digital Holdings (NASDAQ: MARA) is currently riding a wave of bullish sentiment, propelled by several key factors that intertwine the worlds of cryptocurrency mining and market technical analysis. As a prominent player in Bitcoin mining, Marathon Digital's prospects are closely linked to the movements and milestones of Bitcoin itself.
Bitcoin's Momentum: Bitcoin's price momentum is a critical driver for Marathon Digital's bullish outlook. As the value of Bitcoin increases, so does the potential revenue for miners like Marathon Digital. This relationship is because miners earn Bitcoin as a reward for validating transactions and securing the network. When Bitcoin's price rises, the value of these rewards increases, making mining operations more profitable. Recent analyses suggest that the demand for Bitcoin is growing, which could lead to higher prices and increased mining revenue.
Approaching Bitcoin Halving: A particularly significant event for Bitcoin—and by extension, Marathon Digital—is the upcoming Bitcoin halving, expected in 2024. Halving events, which occur approximately every four years, reduce the reward for mining new blocks by 50%. While this might seem counterintuitive as a bullish signal, halvings have historically led to price increases in the months following the event. This is partly because the reduced supply of new Bitcoins coming into circulation can lead to scarcity, pushing prices up if demand remains steady or increases. Marathon Digital is well-positioned to benefit from this, especially given its efforts to expand mining capacity and cut costs, thereby potentially maximizing profits during and after the halving.
Inverted Head and Shoulders Pattern: From a technical analysis perspective, an inverted head and shoulders pattern observed in Marathon Digital's stock chart adds another layer of bullish sentiment. This pattern is often interpreted as a reversal pattern that signals the end of a downtrend and the beginning of an uptrend. For investors and traders who follow technical analysis, such patterns can serve as a buy signal, leading to increased buying pressure and potentially higher stock prices.
Marathon Digital's strategic moves to double its mining capacity and reduce operational costs by 30%, in preparation for the 2024 halving, align with these bullish indicators. Together, Bitcoin's current momentum, the anticipation around the halving event, and positive technical analysis patterns like the inverted head and shoulders create a compelling case for optimism around Marathon Digital Holdings.
In conclusion, multiple factors contribute to a bullish outlook for Marathon Digital Holdings. The company's fortunes are closely tied to those of Bitcoin, and with positive momentum in the cryptocurrency space, an approaching halving event that could reduce supply while demand remains strong, and favorable patterns in technical analysis, there's a solid foundation for bullish sentiment among investors and analysts alike.
Targets: 48, then 64 and beyond

BTC - Weekly Perspective - 02/11 to 02/18As stated in previous analyses, the long-term chart showed an upward pivot, in which the 44.96K region was an important resistance point to be overcome in this chart time.
Anyway, this value was left behind, and the crypto needs to reach the 51.4K region and remain above 44.9K throughout this month to remain in a consolidated upward trend and seek the top region at 65.1K. See the image below
If this does not happen, we can characterize this breakout of strong resistance as just a beautiful buying "TRAP" and have the following situation. See the image below.
On the short-term chart we have a pattern that could help the crypto reach the level of 51.4k.
Do your analysis and good business.
Be aware, if you buy, use stop loss.
See other graphical analyzes belo

The weekly on btcusdWith the exceeding of 43.8k usd which is the maximum achieved last week, an attack on the most important resistances could take place or perhaps directly at the maximums achieved in January, this or next week. The hammer from two weeks ago, which requires confirmation, needs a close higher than this high taken into consideration today, because at that point the correction would be over and the trend would restart upwards. The opposite scenario, i.e. the invalidation of the one-candlestick pattern, would occur with a perforation of the hammer lows and would be a clear sign of weakness.

Monthly on btcusd.January ended with a Doji candle, a symbol of uncertainty and often when seen on the tops a prelude to reversals. But for a reversal of the trend, confirmation will be needed and we know that the underlying trend is bullish, so in this context we can use the doji candle to understand whether it will make a retracement or not, using the highs and lows of the candle. For the February or March candles, a closing below the minimum should be seen as a retracement signal because to reverse the underlying trend, in addition to confirmation, time is also needed and on this we have seen that the trend has been bullish for more than a year . A close above the doji's high, however, would be a very strong bullish signal, consolidating a trend that for now seems to catch its breath in the short term and that's all.


Bearish movementEnglish
Right now, we are having very bad news for the crypto market, special with the Binance issue with the US regulators and Binance`s CEO had to abandon his position, it looks like agood moment to get the open liquidity which was open after those big bullish movements. There`s a debt in the 78% fibo extension which I believe is going to be taken after some days or weeks around the price 32$ per Solana and after that, we are going to have an amazing bullish movement.
However, we need to be careful because in any moment we could hear any news about the Bitcoin ETF which is going to make the market very very bullish, so... Be careful with the next movements in the price and the news.
*THIS IT NOT INVESTMENT RECOMMENDATION OR SOMETHING LIKE THAT, THIS IS ONLY FOR ANALYSIS AND EDUCATION PURPOSE*
Español
En este momento, estamos con pèsimas noticias en el mercado cripto, en especial con ese tema de Binance contra los reguladores de EU,los cuales provocaron que el CEO de Binance renunciara el día de hoy, y parece un buen momento para tomr la liquidez abierta que quedo cuando comenzó ese pequeño bull run. Hay una deuda en el 78% de la extensión del Fibo cercano al precio de los 32$ por Solana, el cual considero debería ir a tomar en los próximos días o semanas, después de eso, espero movimientos súper fuertes al alza.
Sin embargo, necesitamos ser cautelosos porque en cualquier momento podríamos recibir noticias sobre el ETF de Bitcoin y eso podría generar subidas astronómicas en el mercado.
*ESTO NO ES RECOMENDACIÓN DE INVERSIÓN NI NADA QUE SE LE PAREZCA, ESTO ES SOLO PARA ANÁLISIS Y EDUCACIÓN*

Possible $SUSHI PO3 LongHi guys, this time i bring you an unconfirmed PO3 on CRYPTOCAP:SUSHI , where i still expect an Alt Rally Season, i need more money to get in ETH

UPDATE Analisis BTCUSDTFor the moment my previous analysis is correct, now I'm waiting for a retracement in the 30,000 area which should then lead the price to rise again


Analisis BTCUSDT for next month (June 2023)In my vision, BTCUSDT could be suffer a retracement in 24000.00 / 25000.00 zone before resume in Bull Market!

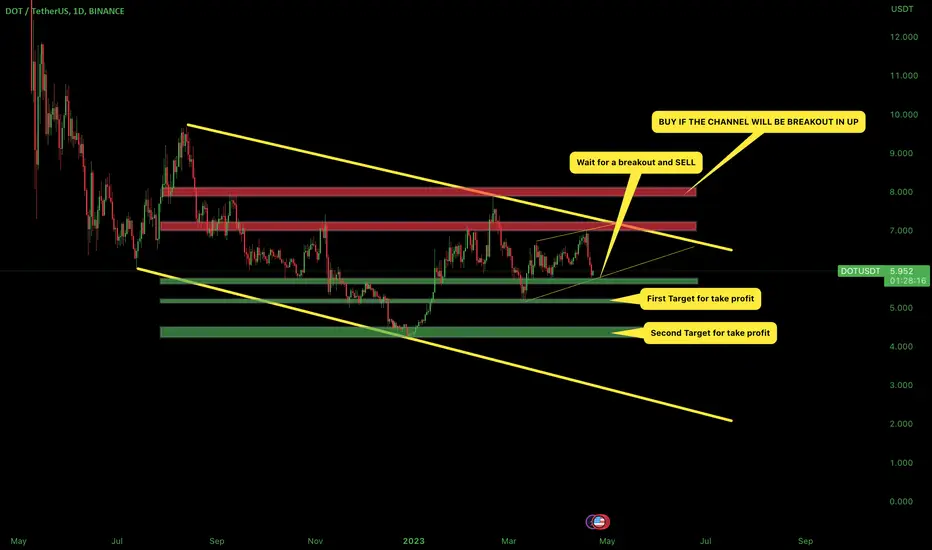
DOT TREND WITH BUY OR SELL ZONESLike is write in the chart, buy if the big trend is breakout or sell if the small channel is breakout in down
BNB - LONGJust created a trend zone with support and resistance zones , im not giving you signals with where and when to Buy or sell.
You have all prepared, so just make it simple and follow the trend or wait for a breakout.

next ATH of btcI think that the next ATH of btc will be approximately on the date indicated in the graph(October 6, 2025), around 118,900 usd

BNB-USD - Wait for broken patternWe have an upward trend, so at this moment I would expect a break in the trend and enter a SHORT.
RSI shows that BNB is overbought, which would make sense with a trend change soon.
Maybe an interest rate hike in MAY would bring some corrections to the crypto market.

OMGUSD long termsome interesting trendlines to try some long positions. I will wait for 0.3/0.2$ or if the price will broke the 2.5$ resistence

Bitcoin. LongSo, Bitcoin went into a serious upward movement. As for ow, I will only consider the growth.
On higher timeframes –there is a potential for price growth 35200-38500 hourly timeframe. From the current or just a bit below 27900-27700, 26900-26400 through the pattern, and the Dpoc filter – I will consider entering into purchases. I look carefully for volumes and extreme surges. Moreover, today we got important news from America, there is a high probability that liquidity will be poured into the market right during the new background. Targets for growth are 28700-29500 and we will probably reach 31700. We can stumble at each of the marks, but I am only for the growth so far.

#ETHUSDT Trading plan!Hello friends!
In this idea, I describe the reasons for considering trading in one direction or another based on the following criteria:
Resistance level - reversal;
There is energy accumulation before the level for a breakout;
Prolonged accumulation in a sideways channel;
Closing below the level (a good signal);
Parabolic energy accumulation before the level;
No reaction to a false breakout.
It's no secret that the markets reacted in the past week to the bankruptcy of a bank, and the Federal Reserve System
turned on the printing press once again. Against this backdrop, the markets began to grow, as they did during the COVID-19
pandemic. Don't forget that tomorrow there is news from the Federal Reserve regarding further interest rate changes, which
could affect market reactions.
Given the reasons outlined above, I expect the coin to grow in the near future. I plan to buy on a breakout above the level of $1,800.00.
Target #1: $2,020.00
Target #2: $2,161.00
Target #3: $2,446.00 in the best-case scenario.
Despite all the targets, I will close the deal at any time if I am not satisfied with the market.
Be careful, the market is currently very unstable, so enter only at strong levels and with stop-loss orders!!!
Wishing you all profitable trades!

Analysis BTCUSD : 📅 1/21/2023Analysis BTCUSD :
According to the formation of the side trend, we can expect the price to fall to the specified targets
.
.
Until the price penetrates above 32000, we cannot expect proper growth.
.
.
👤 Alireza hajighasem : @alirezahajighasem
.
.
📅 1/21/2023

Analysis BTCUSD : 📅 1/8/2023Analysis BTCUSD :
Considering the weakness seen in the decline, we expect an upward movement with respect to the stop.
.
.
price: 16945.00
sl: 15900.00
tp1: 18630.00
tp2: 20500.00
.
.
👤 Alireza hajighasem : @alirezahajighasem
.
.
📅 1/8/2023

Bitcoin TA from 2010 to 2022 - According to Elliott Wave theory.Bitcoin in Dec-2017 made its ATH 19k~ and for the first time Bitcoin has entered in the same zone.
If we look back from 2010 to now-2022, since it entered in a zone of previous ATH never before,
so if we apply Elliott Wave theory to Bitcoin, the current capitulation looks like ABC correction in a larger time frame.
(The time frame of this ABC correction is just my thoughts, may prolong or may shorten).
since there is no negligible rsi formed, so ignored the first bitcoin cycle.
Right now, we are at the end of (12345)-of-wave-A of total ABC correction
I made two probabilities, it's just my personal thoughts not financial advice.
1.based on Elliott Wave theory.
2.based on Momentum/Trend based (looking back past history and predict future). For time being am publishing 1, the 2nd one i will publish later.
a) 12345 of wave-A of total ABC correction- Bitcoin may end up the wave-A at roughly 13700 or 11500.
( i took based on the volume and the downward trend line)
b) abc of wave-B of total ABC correction - Bitcoin may end up the wave-B at max 50k.
(i took this number where bitcoin can go maximum up).
c) 12345 of wave-C of total ABC correction- Bitcoin may end up the wave-C may be from 4000 to 5000.
(i took this number based on maximum volume traded and generally according to Elliott Wave theory, after a 5 wave impulse is done, ABC correction usually end up in the area of wave 4 low.)

AAVE - WE HAVE TRADE HERE!Hello friends!
I come to bring a trade opportunity that I will do in AAVE.
See that AAVE formed an OCOi (shoulder head shoulder inverted), which presents us with a reversal signal.
With that in mind, I will now position myself on AAVE and take partial profits, with the final target being $70.
Note that the stop loss is at the end of the orange band and the blue band is our profit on the trade.
If BTC continues to flatten or rise, I believe in an upside move to AAVE in the near term.
Our main resistance is found in the GAZA BAND located above $70.
And you, will you follow this idea with me?
Leave a boost to support my work and follow me on trading view!
To the next!

Bitcoin TA from 2010 to 2022 - Based on previous Patterns/cyclesAs I said I will post an idea different from Elliott wave theory. Not a financial Advice, this is my personal opinion or idea.
This Bitcoin Technical Analysis is purely based on studying its own previous trends/cycles and predicting the future cycle.
This is not based on Elliotte wave Theory nor am comparing it with DXY or S&P or Dow, next time I will make an idea based on correlation with DXY/Dollar.
Before proceeding I will tell an interesting story " The Story of Zombie and chickens".
A lazy zombie maintains the chicken farm, since chickens grow and breed faster so the numbers are keep growing n growing.
Throughout the year zombie keeps eating chickens and he keeps growing bigger n bigger. Since the zombie is very lazy, he needs help and maintains a dog to look after all the chickens.
As per now for every 4 years or so zombie gets seasonal disease and to get recover himself, he eats chickens in a massive number, not all though.
Dog also keeps eating for his survival, but after all its dog, so when the dog gets older and unable to handle the chickens, zombie appoints a new young dog to take his place.
The conclusion of this story is "Zombie never dies and keeps growing n growing, chickens are born kill and the dog keeps replaced by a new dog".
Ok let's proceed with our Analysis. Different traders visualize the charts in different ways based on their own perception. Chart is the emotions of all traders, it's like map of treasures.
I see many people use trend lines, Fibonacci, moving averages, Ichimoko or other technical indicators and many other.
Even I use many of these, but for this am not using averages or Fibonacci or Ichimoko. Am using RSI and money flow index indicators and triangle pattern for this.
1.Explaining the Patterns or drawings which I created:
Chart patterns in longer time frames, price moves in waves or some kind of curves rather than straight lines/trendlines.
I made some concentric circles where the price is respecting more (basically support n resistances), that doesn't mean the price goes in a circular fashion and goes back to its origin - zero.
Always trend breaks (upside or downside) so may be at some point of time it may break out this circular channel and form a new trend of circles.
I created the triangle pattern in this way --> (A)previous ATH-> to ->(B)current ATH-> to ->(C)lowest bearish Point-> to -> Highest counter move).
For each Bull of Bitcoin (with in 2yrs or so), it is forming a kind of symmetrical triangle with ABCD waves inside it.
(Symmetrical Triangle pattern --> Breaking out of the pattern --> new Bull or new Triangle pattern again).
2.Observation and conclusion taken from the patterns:
After deeply observing the previous 3 symmetrical triangles of Bitcoin-Green, Blue and Purple. I was wandering how to make the current pattern.
The information I have is (previous ATH 20k (point A) + current ATH 70k (point B) + I took 15500(point C) as temporary Bottom.
The conclusion is Green + Blue + Purple triangles are symmetrical in shape. (Symmetrical triangles are mostly bullish and breakout upside not compulsory though).
But for the current cycle, bitcoin is making is Descending triangle. Descending triangle patterns are generally bullish as well as bearish depend on where they are created.
(At the Bottom OR At top of the cycle). As of now it is at the top (so this means there are chances it may breakdown from this Descending triangle).
What I observed is cycle after cycle the width of the triangles are increasing and the height is getting decreased, technically what does this mean?
what I concluded is the move of going sideways is increasing and the momentum or motive of going up is diminishing/normalizing.
(So, this means there are high chances Bitcoin may move less upside and may go sideways or down).
One more thing I observed is after massive move/action of correction of every cycle (Bitcoin Bottom) there is counter move/reaction (Point D of the Triangle).
Generally, the point "D" of every cycle is laying above the top edge of previous symmetrical triangle (the sky-blue horizontal arrow lines).
(So based on the above observation I took the "D" point at 50k as counter move/reaction for current cycle/Descending triangle,
also, it is coinciding with the concentric circles which I made).
3.Final Conclusion, studying the current Descending triangle (Red)/Probabilities:
After over all study, this is my Personal Opinion:
1.Current correction is so massive with in short period of time, considering previous counter rallies and currently bullish Divergences formed in RSI + MFI taking into account,
so high possibilities that there can be a counter rally up to 50k or more than that.
2.I don't think current low 15495 is Bottom for Bitcoin. May be temporary Bottom or it may go little lower than now creating 2 layers of bullish divergences in RSI (for temp Bottom).
(Technically current pattern is Descending triangle, so high possibilities that Bitcoin may make lower low (another low may be 13780) after the counter rally.
to my guess Bitcoin may put its lower low after the Halving).
4.Probabilities of next Bull/cycle:
case1: After Bitcoin making lower low (may be 13.7k), this is the situation DO/DIE for Bitcoin.
If Bitcoin manages to break out of this Descending triangle similar to previous moves, it can put a new ATH (for another decade Bitcoin may trade between 19k to 160k).
case2: Since current pattern is Descending triangle, if Bitcoin fails to breakout from this channel, there are high probabilities that it will break down.
If Bitcoin Breaks Down, most likely it will reset itself from over all cycle right from 2010. (This scenario can be same as my previous Elliott wave theory which I already shared.)
Am sorry my Technical Analysis looks little complex; I hope I explained well.
Thank you.
