ETH, Possibility of a deeper correction There’s two harmonics, a big and strong candle in last week of Aug and also a very important level at 335 that return below it may be a sign of false breakout of the last HH it this level.
Harmonics are ABCD and Shark but they are not that strong with standard form, but price action did a reaction to them. I have my own approach to harmonics and use them beside my own price action algorithm that I’ll show you screenshots of it below.
Weekly:
On the weekly chart I have d Dw5 signal on last candle that have 3 days left to close. Candle has a long lower shadow so if we get weekly close above 335 this signal would be a weak one and the possibility of 335 acting as a support for more bullish moves increases Albeit next weeks close still maybe bearish and below this level, so we need some continuation sign to be sure. If bears stay dominant the algo suggest a support line around 287 (the yellow line) and harmonics first bearish target is not far from it. So, 255-290 would be a support and possible reversal zone. Next support is around next harmonic target and VP peak; 170-200. Reaching there may need a special situation in the markets and also may lead to heavy and quick buy pressure as we had in second week of March.
Daily:
In daily chart thing are very interesting. First on the top I had a Dw5 signal. Then another one showed up with a D4 signal on the candle when price was retesting the first yellow zone where was the confirm zone for bears. Meanwhile a 0-5 harmonic formed that lead to recent week’s bearish moves. For 3 days we I have mixed signals (consecutive Dw5 and Up5). Market hesitates to break this level for now. As you can see support lines (two green lines) are in 240-260 zone and also VP’s peak is exactly there too.
CRPTOCURRENCY


$DOTUSDT - Possible bullish bat on PolkadotHello guys!
There is an ending diagonal pattern being formed on Polkadot and DOT is near resistance, there is a clear sign of buyers exhaustion, hence wait for a breakout of the dynamic support and short it.
The price trajectory on the chart is just an assumption, wait for the pattern confirmation to go long.

XRPUSD Ripple | SWING - 20 Sep. 2020Hello my friend | Welcome Back.
Please support this idea with LIKE if you find it useful.
***
We may notice that it breaks the resistance and heads on the same ascending trend line to touch it, then head towards the downside.
***
Here is the full analysis for this pair, let me know in the comment section below if you have any questions, the entry will be taken only if all rules of the strategies will be satisfied. I suggest you keep this pair on your watchlist and see if the rules of your strategy are satisfied.
Remember this analysis is not 100% accurate No single analysis is To make a decision follow your own thoughts.
***
The information given is not a Financial Advice.
BTCUSD Apple GBPUSD EURUSD XAUUSD AUDUSD

Bitcoin 2020Key Dates
2020
Mid/Late August to Early/Mid September for 14k
Mid/late September to Early December for 18k also first pullback of the new bull cycle.
2021
Sometime January back to 2 year trend line created
February 2019.
Mid April the restart of the bull run after correction

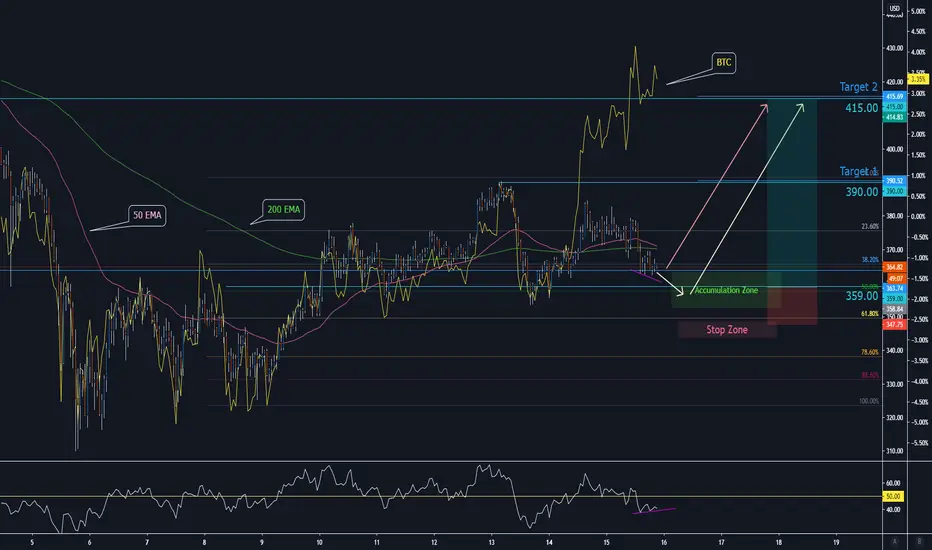
ETH/USD Divergence Spread Trade With BTC/USD!Hello Fellow Trader!
These types of trades have two scenarios.
1. Is BTC/USD over price and going to find the median with ETH
2. Is ETH/USD undervalued and going to appreciate with BTC
With the way the current structure is forming, the view is ETH is undervalued in this case and upside is higher probable.
Key Points:
- Caution - Price holding below the 200 EMA
- Caution - Price holding below the 50 EMA
- Would be great to see price reclaim 200 EMA, but the reward to risk ratio will be compromised.
- 50% Fibonacci support level at 359 support
- Divergence in the RSI at lower lows on price
Key Levels:
Support – 359, 350
Resistance – 50 EMA, 200 EMA, 390, 415
Entry Zone:
Optimal entry provides the greatest reward to risk ratio while supporting entry is a zone for reversal signals.
Optimal Entry – 359
Supporting Entry – 365
Candle Reversals for entry
- Bullish Hammer
- Bullish Engulfing
- Bullish Piercing
The Risk:
As traders, it is your job to mitigate the risk and only trade structures that provide high probability and great reward to risk ratios.
If you are not comfortable with defined exit levels, experiment with Moving Averages to help set solid exit rules to protect your capital.
IF: Price breaks below 350 level– this would suggest the structure is not in our favour and would be wise to reduce exposure or close the trade until a solid signal gives us reasons to re-enter.
Reward / Reward Targets:
Optimal Entry 359 – Target 1 390= 3x Reward to Risk
Optimal Entry 359 – Target 2 415= 5x Reward to Risk
Supporting Entry 365– Target 1 390= 1.3x Reward to Risk
Supporting Entry 365– Target 2 415= 2.7x Reward to Risk
XLMUSD | SWING - 13. Sep. 2020Hello my friend | Welcome Back.
Please support this idea with LIKE if you find it useful.
***
Obviously, it will break the channel to the downside and may reach the mentioned support.
***
Here is the full analysis for this pair, let me know in the comment section below if you have any questions, the entry will be taken only if all rules of the strategies will be satisfied. I suggest you keep this pair on your watchlist and see if the rules of your strategy are satisfied.
Remember this analysis is not 100% accurate No single analysis is To make a decision follow your own thoughts.
***
The information given is not a Financial Advice.
BTCUSD Apple GBPUSD EURUSD XAUUSD AUDUSD

BTCUSD Bitcoin | SWING - 13. Sep. 2020Hello my friend | Welcome Back.
Please support this idea with LIKE if you find it useful.
***
After Bitcoin broke the downtrend, it may head down to $9,939 to retest the broken area, heading to the upside.
***
Here is the full analysis for this pair, let me know in the comment section below if you have any questions, the entry will be taken only if all rules of the strategies will be satisfied. I suggest you keep this pair on your watchlist and see if the rules of your strategy are satisfied.
Remember this analysis is not 100% accurate No single analysis is To make a decision follow your own thoughts.
***
The information given is not a Financial Advice.
BTCUSD Apple GBPUSD EURUSD XAUUSD AUDUSD

EURUSD | SWING - 9. Sep. 2020Hello my friend | Welcome Back.
Please support this idea with LIKE if you find it useful.
***
The Euro is on a bearish trend line that is expected to be broken, heading towards the upside, and bouncing at the strong point of the rebound volume profile.
***
Here is the full analysis for this pair, let me know in the comment section below if you have any questions, the entry will be taken only if all rules of the strategies will be satisfied. I suggest you keep this pair on your watchlist and see if the rules of your strategy are satisfied.
Remember this analysis is not 100% accurate No single analysis is To make a decision follow your own thoughts.
***
The information given is not a Financial Advice.
BTCUSD Apple GBPUSD EURUSD XAUUSD

BTCUSD Bitcoin | SWING - 9. Sep. 2020Hello my friend | Welcome Back.
Please support this idea with LIKE if you find it useful.
***
Bitcoin may fall from the price of $ 9,537 or rise again from $ 9,537 because it is considered a very important price. It may consist of a support point or turn into resistance if broken.
***
Here is the full analysis for this pair, let me know in the comment section below if you have any questions, the entry will be taken only if all rules of the strategies will be satisfied. I suggest you keep this pair on your watchlist and see if the rules of your strategy are satisfied.
Remember this analysis is not 100% accurate No single analysis is To make a decision follow your own thoughts.
***
The information given is not a Financial Advice.
BTCUSD Apple GBPUSD EURUSD XAUUSD

XRPUSD still longHey everyone i posted my sell last week at 31900 and it sold off as projected. Purchase at 27 cents flat and i'm riding this profit currently. XRP has been hot!!! Look if you want my updated charts. I give them to my trade group. Like and comment. Let's make profit easy. Thanks mates

BTCUSD Bitcoin | SWING - 29. AUGU. 2020Hello Traders Welcome Back.
***
Here is the full analysis for this pair, let me know in the comment section below if you have any questions, the entry will be taken only if all rules of the strategies will be satisfied. I suggest you keep this pair on your watchlist and see if the rules of your strategy are satisfied.
***
Please consider to put a like to my idea for supporting me & subscribe for more ideas.


BTC/USD - BITCOIN - SWING - 20. AUGU. 2020Hello Traders Welcome Back.
***
Here is the full analysis for this pair, let me know in the comment section below if you have any questions, the entry will be taken only if all rules of the strategies will be satisfied. I suggest you keep this pair on your watchlist and see if the rules of your strategy are satisfied.
***
Please consider to put a like to my idea for supporting me & subscribe for more ideas.

POSSIBLE BEARISH REVERSAL ON XRP/USD!!...Ripple failed to break Key Price Level 0.3030 on Aug 14th - 15th. It also failed to break 1HR Support Turned Resistance earlier today. Im predicting Moderate to Big bearish movement following its Daily close in 4 1/2 hours. I placed a Risky & Safe Sellstop Entry on XRP/USD. Stoploss for both are between 30 - 45 pips. Im expecting test of Weekly Resistance turned support. (Marked In Orange). Exit points are marked as well. Of course there is still possibly that price retests recently broken support, but I see more bearish sentiments. This is my partial analysis, complete analysis starts on the 4HR Timeframe. What's your thoughts on XRP/USD??? COMMENT BELOW!

XRPUSD who else is bullish for a few months ?BIG LOTS AT 23 CENTS IF POSSIBLE . WILL ADD AT 27 SOFT BUY. BULLISH

BITCOIN: retest from current break out or further upsidePrice is now sideway from the recent surge in price.
Scenario 1: Reversal from confluence of ascending trendline & horizontal support
Scenario 2: Break of the recent high resistance area, await for retest confirmation before going long
Scenario 3: Price retraces to retest the previous resistance turned support (10500 area) and long after retest confirmation


ETH/BTC 7/9/2020Welcome to this analysis of ETH/BTC.
ETH/BTC has been in an uptrend since February after breaking out of a 6 months long double bottom reversal pattern. Since then it went sideways and consolidated for a bit more than 3 months, from the 8th of February till the 3rd of Jun. The consolidation looks like a symmetrical triangle pattern which is a continuation patter in this case. On the 3rd of Jun, the price broke out of the triangle, since then it has made a month-long rectangle range continuation pattern outside the triangle that got confirmed by a breakout and close above 0.02560 Sats. The overall structure looks like accumulation over time with a series of higher highs and higher lows and bullish continuation patterns.
The target of the Symmetrical triangle is around 0.03180 Sats. The first major level of resistance above the price is the red box an around 0.03 Sats zone. The Price can reach those targets as long as it does not break below the rectangle pattern.
This trade idea has 6 rewards to risk ratio.
Good luck trading :)

The Endless PumpPrice volume warping and contracting 4th Halving outflow pressure
True change takes place in the imagination.

ETHUSD SELLETHUSD H4 CHART
Hello Traders 👋If you find this analysis useful, please support me with your likes and comments.
If you have another analysis at this pair, please share in comments, I will be glad to discuss with you.

EOS LONGTERM BULLISH WAVE a very bullish wave for EOS
the first wave is leading diagonal which only appear at the beginning of an (impulse wave )
now we are looking for the third wave which is the biggest one
TARGET 1 : 4.5$
TARGET 2 : 6$
STOP LOSS IF U WANT : 1.29$
