CRVUSD

Long CRV HereCRV formed a double bottom pattern and seems started a new uptrend that can achieve profit targets. Consider that CRV/USDT goes above its 100 daily moving average which is another sign of growth.

CRVUSDT(Descending Channel Breakout)#CRVSDT (Day chart) Technical Analysis Update
Descending Channel Breakout
CRV/USDT currently trading at $0.70
Long Entry-level: $0.60 TO $0.70
STOP LOSS: below 0.55
Target 1: $0.925
Target 2: $1.20
Target 3: $1.55
Max leverage: 2X
ALWAYS KEEP STOP LOSS...
Follow our Tradingview Account for more Technical Analysis Update, | Like, Share and Comment your thoughts.


CRVUSDT (Falling wedge breakout)#CRVUSDT Technical Analysis Update
Falling Wedge Breakout
CRV/USDT currently trading at $0.73
Long Entry-level: $ 0.70 to 0.74
STOP LOSS: Below 0.550
Resistance level 1(Target 1): $0.86
Resistance level 2(Target 2): $0.95
Resistance level 3(Target 3) : $1.13
Max leverage: 3X
ALWAYS KEEP STOP LOSS...
Follow our Tradingview Account for more Technical Analysis Update, | Like, Share and Comment your thoughts.

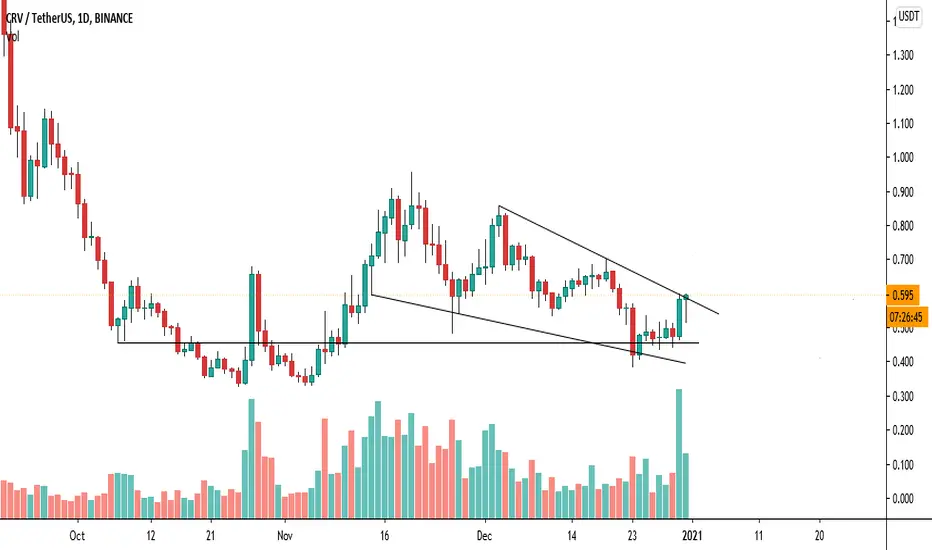
CRVUSD (Waiting for the trend line Breakout)#CRVUSDT Technical Analysis Update
Waiting for the Trendline Breakout
CRV/USDT currently trading at $0.565
LONG ENTRY: Above $0.605 (Only enter long if 4 h candle close above $0.605)
STOP LOSS: I will update once I see the Breakout
Resistance level 1 (Target 1): $0.700
Resistance level 2 (Target 2) : $0.855
Resistance level 3 (Target 3) : 0.960
Max leverage: 2X
ALWAYS KEEP STOP LOSS...
Follow our Tradingview Account for more Technical Analysis Update, | Like, Share and Comment your thoughts.


CRV Long OppHolding Daily Uptrend and hold levels, promising!
Still have major downtrend to break not far away though.

CRVUSDT - Symmetrical triangleCRVUSDT has been consolidating in a symmetrical triangle pattern.
Price is testing the pattern support.
We could see a bounce off the support ⬆️ or a breakdown below the pattern support ⬇️.

CRV the day will comethis has a big pump in its future, but might not be now. I would be very careful. Keep an eye on the triangle.


CRV Retracement began - UP we goOne of the most promising coin in the DEFI fell from 5.75$ to 0.32$ in les than 3 months.
By simply doing the Fib retracement, we should hit the basic 0.236 FIB at 1.50$. Thats nearly 100% that should be done easy by EOY.
Simply following Elliot Waves, we could see we are in WAVE 3 leading to 1.15$-1.20$
The golden fib is near 3.65$, 465% from here.
As violent the fall, as violent the retracement. Compared to YFI retracement (44k to 7.5k to 32k), it is indeed promising.
YFI show us the way in a sens of the alt season to come.


crv to 1.4crv forming a lot of patterns . confluence upon confluence. its moving to next level soon 1.4 area watchlist in. look out for big Vs.

CRV is doing a thing. CRVUSDWe move up. Another impulse confirmed, and we are fractaling our way up. Not financial advice, good luck!


CRV Possibility 100% to 400% JUMP - CURVE CRVBTC CRVUSDT CRVUSDCRV Possibility 100% to 400% JUMP - CURVE CRVBTC CRVUSDT CRVUSD

CRV/USDT
CRV/USDT
Quick Analysis
This coin dropped very hard from its top
And make double bottom
Also we can see recently in 4h frane chart ema 20 became above ema 200 (bullish)
Strong Support level around 0.54$
As long as CRV Hold above this level we can see next target at least 1$ soon
Now Look at daily chart
This not buy signal just reading chart
(Signals comes with targets and stop and buy areas)
Make a plan before buy or sell
Follow and subscribe for more
Good luck and happy trading 🌹

