BNX: AFTER THE FALL NEW UPTREND?BNX, a cryptocurrency, has recently experienced a fall in value. This fall has caused it to lose its important cross trend, and the historical trend of transactions has shown a minus in DCA (dollar cost averaging).
See our before view:
The big question is whether BNX can recover from this dip and continue on an upward trend. It is difficult to predict the future of any cryptocurrency, and it is possible that this dip may be a temporary fluctuation or it could be the beginning of a longer-term downward trend.
However, if BNX is able to recover and return to its previous levels, it has the potential to trend back above the 80 USD level and even reach the 100 USD level. It is important to closely monitor the performance of BNX in the coming days and weeks to see if there are any signs of a potential recovery.
If you are considering investing in BNX, it is crucial to thoroughly research the cryptocurrency and make an informed decision based on your own financial goals and risk tolerance. It is always advisable to consult with a financial advisor before making any investment decisions.
Yes, it's possible that BNX can recover from this trend, but at last we should see coming time signals of confirmations that show this also.
The low time of BNX still shows that there are chances for it, when the price stays above 60 USD there is an even high chance this can happen.
we never will know exactly the goal of this dip.
This can be a trend, but same time also a new chance for new whales to re-enter into markets. ( that's why crypto will stay unexpected market)
Trade safe and on your plan.
This is just our view about it.
Crypto-trading

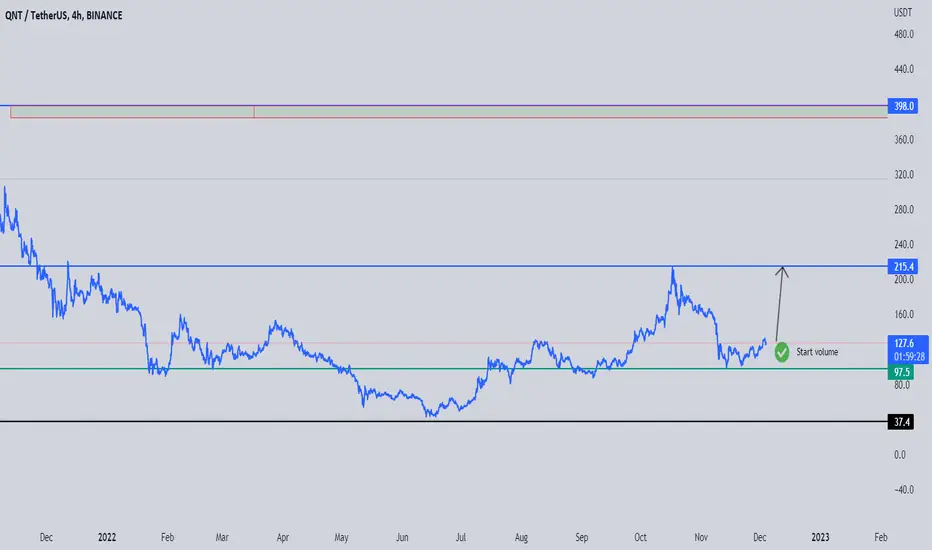
QNT : NEW VOLUME VIEW BREAKOUT POSSIBLITYQNT is the symbol for Quant Network, a company that provides blockchain technology solutions. It is a cryptocurrency for security and is traded on online exchanges.
As with any investment, it is important to thoroughly research and carefully consider the risks before investing in QNT or any other cryptocurrency. It is also important to manage risk by diversifying your investment portfolio and not putting all your money into one asset. It is impossible to predict with certainty the future performance of any investment just by expecting, so it is important to always approach trading with caution and to never invest more than you can afford to lose.
The scan was made today on this coin and it shows possible high volume can get confirmed.
We will follow it and see if it can go over 160 USD coming time.
QNT is one of the high coins that have + volume on-trend.
There is no guarantee that this expecting will happen, as we depend on studying and depending on high chances.
*the possibility is high.
This coin did hold before more levels, which makes it also interesting.
Still think price needs to push higher. Confluences:
1- D/W support level flip
2- Trendline support.
3- No free fall after NFP event.

I'm searching for buying reasons!! I believe we'll see a jump in OKB in next months! But right now! We are facing a resistance! After breaking this resistance I'll add more OKB in reverse to it or to a strong dynamic level.

MATIC Takes Off And Bitcoin Moves To A Daily Up TrendIt's nice to see some proper green in the market the last couple of days but don't get ahead of yourself, it is only 2 days so far and while it would be lovely to see bitcoin at 20,000 on Christmas day, we still have a long way to go.
I break down the top-10 in crypto in this video and the charts I am watching.
Please feel free to ask any questions in the comments section and hit that little rocket ship bottom right.
Thank you!

Timing when day trading can be everythingTiming when day trading can be everything
In Stock markets typically more volatility (or price activity) occurs at market opening and closings
When it comes to Forex (foreign exchange market), the world’s most traded market, unlike other financial markets, there is no centralized marketplace, currencies trade over the counter in whatever market is open at that time, where time becomes of more importance and key to get better trading opportunities. There are four major forex trading sessions, which are Sydney, Tokyo, London and New York sessions
Forex market is traded 24 hours a day, 5 days a week across by banks, institutions and individual traders worldwide, but that doesn’t mean it’s always active the entire day. It may be very difficult time trying to make money when the market doesn’t move at all. The busiest times with highest trading volume occurs during the overlap of the London and New York trading sessions, because U.S. dollar (USD) and the Euro (EUR) are the two most popular currencies traded. Typically most of the trading activity for a specific currency pair will occur when the trading sessions of the individual currencies overlap. For example, Australian Dollar (AUD) and Japanese Yen (JPY) will experience a higher trading volume when both Sydney and Tokyo sessions are open
There is one influence that impacts Forex matkets and should not be forgotten : the release of the significant news and reports . When a major announcement is made regarding economic data, currency can lose or gain value within a matter of seconds
Cryptocurrency market s on the other hand remain open 24/7, even during public holidays
Until 2021, the Asian impact was so significant in Cryptocurrency markets but recent reasearch reports shows that those patterns have changed and the correlation with the U.S. trading hours is becoming a clear evolving trend.
Unlike any other market Crypto doesn’t rest on weekends, there’s a drop-off in participation and yet algorithmic trading bots and market makers (or liquidity providers) can create a high volume of activity. Never trust the weekend’ is a good thing to remind yourself
One more factor that needs to be taken into accout is Blockchain transaction fees, which are responsive to network congestion and can change dramatically from one hour to the next
In general, Cryptocurrency markets are highly volatile, which means that the price of a coin can change dramatically over a short time period in either direction
The Bottom Line
The more traders trading, the higher the trading volume, and the more active the market. The more active the market, the higher the liquidity (availability of counterparties at any given time to exit or enter a trade), hence the tighter the spreads (the difference between ask and bid price) and the less slippage (the difference between the expected fill price and the actual fill price) - in a nutshell, yield to many good trading opportunities and better order execution (a process of filling the requested buy or sell order)
The best time to trade is when the market is the most active and therefore has the largest trading volume, trading all day long will not only deplete a trader's reserves quickly, but it can burn out even the most persistent trader. Knowing when the markets are more active will give traders peace of mind, that opportunities are not slipping away when they take their eyes off the markets or need to get a few hours of sleep
You are kindly invited to check the script that helps to identify market peak hours : Day Trading Booster .

XRP: slowly but surely!Good afternoon fellow traders!
A small review on the XRP coin!
Since the last review, the price has not changed much, but the idea remains the same.
I will consider short positions in the area of interest 0.41$-0.42$.
Reasons for this: test FVG W1 and FVG D1 + FVG 4H + FF M1 (many reasons for local growth in this area).
Now I don’t see a good point for local growth!
Not a recommendation, my personal opinion!
Have a nice day and profit!

BITCOIN, Massive Channel TO Show Final Outcome!Hello Community,
Welcome to my new analysis of Bitcoin from the daily timeframe perspective. Since the FTX crypto collapse, massive liquidation were triggered within the crypto market and Bitcoin all-together with other major cryptocurrencies showed up with a devastating plunge to the downside which is likely not have happened if the FTX exchange at this time the second biggest exchange within the crypto market collapsed. The interesting thing here is that Bitcoin actually follows a pattern with fractals in this pattern as Bitcoin showed a similar fractal-dump already in the U.S.-Dollar index within August as seen in my chart.
Taking these events into perspective now, as it is seen within my chart, Bitcoin is trading in a paramount Descending-Channel-Formation with the Accumulation-Channel in the lower boundaries and the Distribution-Channel in the upper boundaries. Now as Bitcoin is testing the lower Accumulation-Channel again this is a crucial situation as Bitcoin from here on shows a second Accumulation-And-Breakout-Fractal as it already formed within the bigger channel. Therefore, once Bitcoin manages to break out the Accumulation-Channel a rally is likely to continue till the Distribution-Channel is reached once again.
The final crucial determination of the concluding trend direction will come once Bitcoin is in the Distribution-Channel again because if Bitcoin manages to hold this area and built up bullishly on it this will be the setup for a final breakout above the upper boundary and converting into the scenario A seen in my chart. Otherwise, if Bitcoin should confirm the upper Distribution-Channel together with the upper boundary and the 100-EMA as resistance again the bearish fractal and second scenario B is likely to be triggered again and Bitcoin will continue till the Accumulation-Channel is tested again, it will be an interesting determining journey ahead.
In this manner, thank you everybody for watching, Let's move forward together.
"Each new day the market has a new shape. Just the patterns repeat."
The information provided is only educational and should not be used to take action in the markets.

CRYPTO TOTAL MARKET CAP - $7T by 2025Bitcoin is a classic liquidity measure.
Prices have changed.
But the fundamental need for crypto hasn’t. Nor has the core technology, which is only growing stronger .
Would like to see Inflation Topping out ,
Short rates to drop, Bond yields drop,
Stock Market Bottom Formation and commodities to lose strength before Pulling the Trigger .

Updated local highs. Breakout of the inclined levelThe asset has updated local highs. Came out on volumes from the sidebar. The price broke through the inclined level and fixed higher. I expect the movement to continue. Target - 0.0809$

NZDUSD on RBNZ rates and monetary policy announcement, US minuteINTRO
A rise of 75 basis points is the order of the day.
Retail sales on Thursday may bring volatility to the Kiwi
0.62 (61.8% fibonacci) is the new resistance to beat
FUNDAMENTAL OVERVIEW
The Chinese economy continues to be impacted by COVID, impacting stocks and markets. The currency pair was affected by a slowdown in its gains as the U.S. dollar index found refuge for investors globally. There are several announcements today Tuesday that could bring volatility to the NZDUSD currency pair. Rates are expected to rise as markets see no slowdown in hawkish U.S. economic policy.
European Central Bank Governing Council member Robert Holzmann said on Tuesday he had not yet decided to vote at the next rate-setting meeting in December, but would favor a 0.75 cent hike unless there was a significant improvement.
TECHNICAL OVERVIEW
Strong resistance has kiwi bulls frustrated. The confluence of EMA200 and the 0.62 level (61.8% Fibonacci) has investors considering a continuation of the call. The pair is up 12.5% from a low of 0.55 hit in October. A bearish channel on the daily bar chart has been broken, but the uptrend could change due to expected volatility from the rate decision and Thursday's meeting minutes. Confirmation of the 0.60 level as support could lead the pair to seek resistance at 0.64 (50% Fibonacci).

ETHEREUM - Approaching final stageHow far will the price drop? We are slowly reaching the bottom-finding phase, and this one is very close. I'm not saying that a turnaround is around the corner, but historically speaking, there's not much left to the bottom, percentage-wise it doesn't even matter if it's the biggest so far. Spike can be deep, but very quickly...when it happens. The consultation phase will follow. I think it will take 3-4 months before the price comes back to the green branch and gets an upward momentum.
The story "When there's blood on the street, it's time to buy" has confirmed its reputation countless times. I believe that time is coming.
This is my personal lay opinion and is not financial advice.

BITCOIN Bearish Bias! Sell!
Hello,Traders!
BITCOIN is trading in a narrowing wedge
And I am somewhat bearish biased
So IF we see a bearish breakout
Then a bearish continuation will follow
Sell!
Like, comment and subscribe to boost your trading!
See other ideas below too!

Trading opportunity for DYDXUSDTBased on technical factors there is a Sell position in :
📊 DYDXUSDT
🔴 Sell Now 2.048
🧯 Stop loss 2.385
🏹 Target 1 1.745
🏹 Target 2 1.435
🏹 Target 3 1.080
💸RISK : 1%
We hope it is profitable for you ❤️
Please support our activity with your likes👍 and comments📝

ETH break soon - Watch this triangle!~Bears out in full force
Every time frame is bearish - MONTHLY, Weekly, Daily etc etc
Everyone is saying that FTX has Fried the crypto scene.
CRYPTO IS DEAD
But will the bears get F'd up just because everyone is so bear?
Find out soon!
-make sure to have your stops in for protection ::::::D-
BTCBUSD potential long ideaLooking for a swipe of the liquidity marked with circles and a break of the red "trend line".
this will imo lure in more shorts on the confirmation of the trend line break holding up the short-term . A push back up and reclaim of the trend line and "Weekly-Bo_RL" will be long trigger,
OR
A clean break above that resistance line into the 1 hour range marked on chart is also a long trigger,.
Targets IF we get the long trigger are as follows:
17100
18200
19000
Below 15500 amd hold IO will start to look for shorts and map out another range...
Make plans. if this -- do this. If nothing happens so what!!! if it plays out we make money. We are not predicting we are just game planning. like snipers.

¿Bullish engulfing or bullish trap?Introduce
Hello crypto community! We come from a busy week in the crypto world, and the sun is still overshadowed by various dark clouds and negative news. Remember, we have one of the highest weekly volumes ever in BTC history, a huge red weekly candle without much room for recovery. Remember that cryptosystems, even if they are more subject to speculation and the flow of smart money, first respond to the mathematical algorithms and codes that make them unique. Math never lies. If technically things don't rise and fundamentals don't help, the ideal recovery is far from happening. One big move, be it bearish or bullish, always leads to more moves slowly losing strength. We are just before the first movement Low.
Fundamentals
DXY started to recover this week, with the recovery slowing in major currencies, US500, commodities and cryptocurrency markets. The U.S. dollar index hitting the 109.3 level could lead to further losses in stocks. The bullish rally that started after favorable IPC data slowed. Also, we have retail sales data this week, more precisely on Wednesday, which will bring volatility to the market.
Technical staff
We have yet to reach support at 15.6k, we have bounced around 15.8k, found no buyers over the weekend and pulled a lot of money from exchanges due to the fear generated by FTX and its effects. If this level, which will now act as support, is not broken, we may face a partial recovery in price until the last confirmed resistance level is around 18.2k. around. Now, if we close above this level, the next resistance is at 19.2k, an area that the bears will defend.
This is not investment advice, good trades and profits! !

InvestMate|ETH Time for the third wave (quick outlook)💵ETH Time for the third wave. (quick outlook)
💵My stance on the ETH/USDT pair still remains bullish.
💵For the crypto market rises, I refer you to my previous post on Bitcoin in which I wrote extensively about the rise of this pair (and the crypto market as a whole)
💵In my opinion, we have already passed the bottom and it is now time for the upside.
💵After the first wave that reached $2k levels
followed by a descent to levels of $1.1k
💵My opinion is that it is time to start a rally with a final target of $2600 in the next months.
🚀If you appreciate my work and effort put into this post I encourage you to leave a like and give a follow on my profile.🚀

BITCOIN Update! Sell!
Hello,Traders!
BITCOIN is making a bullish pullback
To retest the broken horizontal level
But we are still bearish because
Of the breakout so after the retest
I think we will see a move down
Sell!
Like, comment and subscribe to boost your trading!
See other ideas below too!

✅BITCOIN SWING SHORT🔥
✅BITCOIN made a bearish breakout
Of an important psychological key level
Which surprised many on the market
Judging by the way the coin traded
The last 24 hours, but the breakout
Is there nonetheless which is a
Bearish signals for us and
We will be expecting a further move down
SHORT🔥
✅Like and subscribe to never miss a new idea!✅

BTCUSDT | I am Buying BTC From 18K BINANCE:BTCUSDT
Buy BTC From 18K
Take Profit 20K
Buy and wait till to end of this week ...
maxRECORDS | Trading

¡A Big Liquidity Gap!Introduce
Hello trading community! As can be expected, the crypto market will suffer after the Binance sell-off. Not only that, but data on Alameda's balance sheet was also leaked, leading to a possible bankruptcy of the company.
Fundamentals
It is normal for a black swan with these characteristics to have an impact on all cryptocurrencies, including BTC, and the same way it happened with LUNA, with liquidations of positions and massive price drops. Additionally, the price of BTC found no buyers above 21080K, causing the price to break through this support and retreat to the 20K area. Today we have the US midterm elections and Thursday's expected CPI data. as two events that may bring volatility to the market. DXY is showing no bullish signs, and if it breaks below 110, it could fall to the support area between 108 and 109.
FTT/USDT technical analysis
On the daily chart, we can see a breakout of a descending triangle with a target between $10 and $12. There is no liquidity or related buying in this area. Also, the MACD has yet to complete its bearish development and the RSI 14 is at the 23 level.
Good deal and profit! !

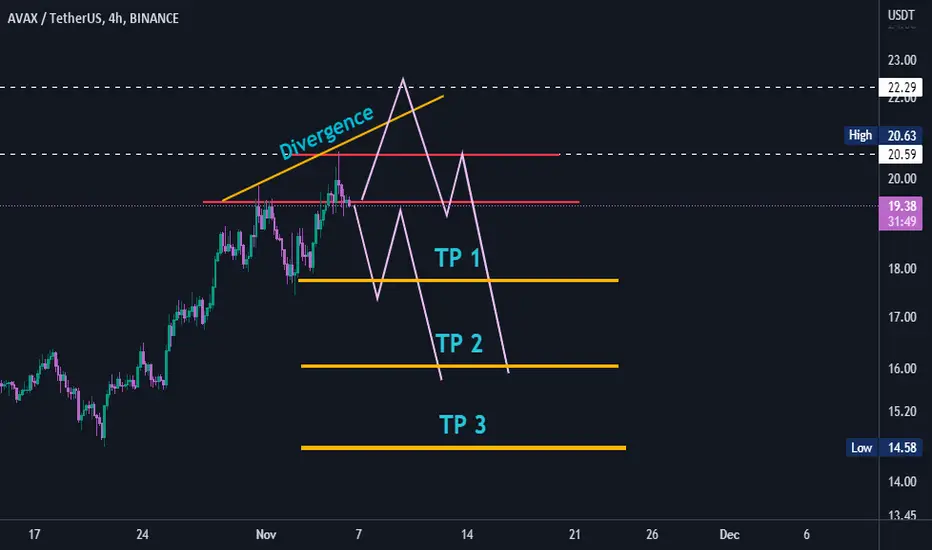
AVAX right now analysis || ArztopiaBINANCE:AVAXUSDT
First wait for top
next find an entry price
now best position for short.
please support me in socioal media
just search arztopia on media