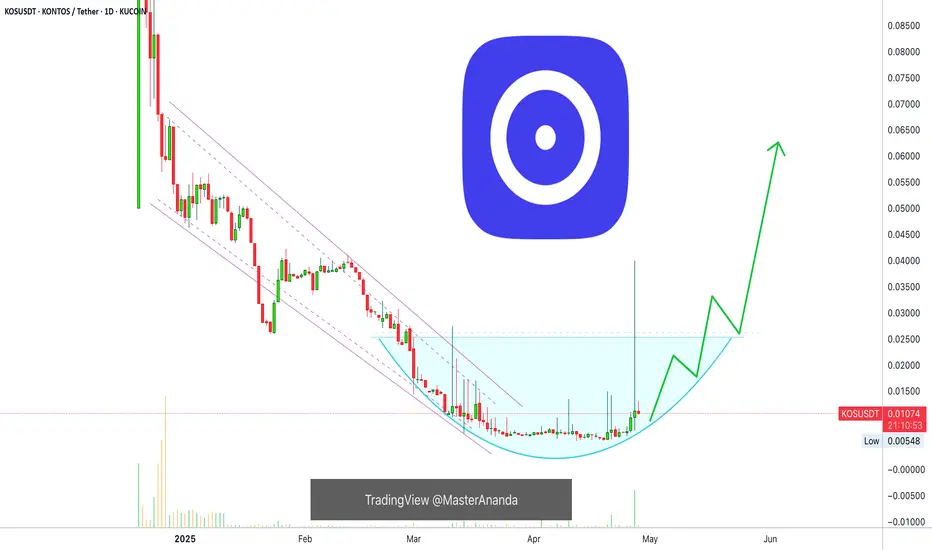
Hidden Bullish Signals: When The Impossible HappensThe project name is Kontos, yesterday it produced a candle of +430%. This is a bullish signal that affects the entire Cryptocurrency market, it is happening after this pair produced a new All-Time Low. This signal reveals how strongly the market will grow when it starts to move in full force.
All loses will be recovered. After the recovery we will experience long-term growth.
The Altcoins market is waking up. This is proof. And this is only the start.
Namaste.
Crypto
Tether Dominance, TA» There is a lower high on the chart. This is a long-term timeframe. The signals are very strong here.
» There is a strong rejection at SMA200, this level being confirmed as resistance.
» There is a very strong decline in volume.
» There are three consecutive weeks closing red.
These are all very powerful bearish signals.
» This week wicked lower compared to 24-March.
Tether Dominance just produced the lowest reading on a drop since November 2024. When USDT.D was moving down in November 2024, everything Crypto was moving up. The conditions are similar today.
Tether Dominance can be seen moving down as a continuation of a bearish trend. This is happening after a lower high is fully in and confirmed.
Short-term, there can be a small pullback followed by lower prices.
For example, several days can close green but by the time next week ends, the action turns full red. Just as it happened on the 7-April week. The action started strongly bullish but USDT.D ended with a bearish week and the start of a decline that will lead to a lower low.
We are likely going to see the lowest reading on this index since March 2022 or December 2021. It is a long process but the chart is pointing down. That is what the chart says.
Thank you for reading.
Namaste.

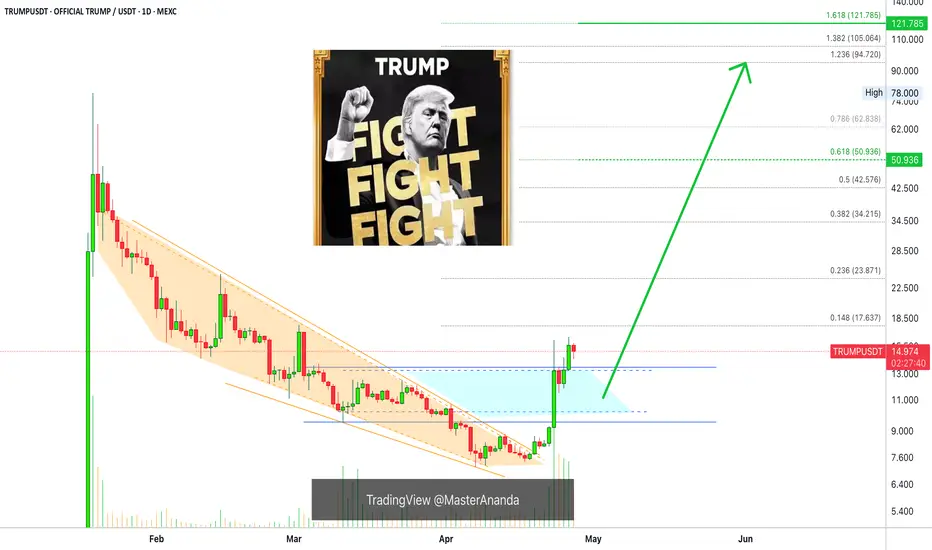
OFFICIAL TRUMP Update —Your Guide Through Light & DarkIt gets better and better. Yesterday TRUMPUSDT produced the highest session close since 3-March. Think about it... The bottom is fully in and confirmed and now almost two months of bearish action have been completed obliterated. The action is happening now the same as if it were early February 2025.
Another interesting fact is that almost two months of bearish action has been deleted but the chart is only a little over 3 months old. The bears are no more we are in the bullish zone.
This is important and a strong confirmation.
TRUMPUSDT started trading when the market was bearish and moving within a strong corrective phase. The correction for the last major 2024 bullish wave.
Corrections are tough I agree and the market bleeds but they end and once they end the action turns the other way and that's what you are seeing today.
There is no doubt here, nothing to fear, the rise won't stop it is only getting started. Make no mistakes.
How far up TRUMPUSDT will grow is only speculation but you can expect a new All-Time High for sure. And that's easy for a Cryptocurrency project and one with so much buyers, holders, attention and market support.
This is a simple update mentioning the highest close in months, the bottom is in and bullish continuation confirmed. Keep holding and you win. Keep buying, double-win. Only sell when the market reaches new All-Time High and is full green.
Right now is the time to buy and hold, when prices are low. Only when prices are high we take the profits and move on.
Trading is meant to make money. To make money, you have to let go of your position once the market grows.
Prepare now. Plan ahead of time.
You will do great. You have my support.
Thanks a lot for your continued support.
I will be your guidance through the light and through the dark.
Namaste.
Bitcoin Weekly, Bullish Continuation ConfirmedDid you know... Look what is happening right now on this chart, it is an amazing and incredible development you are going to love it and you are going to love me for showing it to you. It confirms everything I've been saying for the past few months.
The week closes today within three hours and this is the first time that Bitcoin closes green three consecutive weeks in the year 2025.
Three green (bullish-positive) sessions is a classic bullish signal called the three white soldiers in candlestick reading parlance. In normal terms, based on simple fact straight in your face TA, it is the first time this event happens in 2025 period. Why it didn't happen before and that's because the market was bearish. Why it is happening now it is because the market is no longer bearish and turned bullish.
Three green candles with Bitcoin moving higher but that's not all, the third candle which is the current candle is about to close full green and the biggest candle of 2025. When a strong big candle appears it only confirms what comes next.
Now, you can allow for retraces, whatever... The week has seven days. Next week the whales can trick you with a small retrace followed by huge growth. But the whales are not stupid, they cannot take the risk of selling tons and people buying everything when prices are low.
Think long-term.
Bitcoin is set to grow above $150,000 in the coming months. So, any buying below $100,000 is a super discount, below $95,000 it is just too good to pass up. So no, nobody is ready to sell we are ready for growth.
The signal is in. The fact that the market remains green while the Altcoins grow confirms that Bitcoin will produce a bullish continuation as the next major move, going up, for sure.
What will you do? Will you follow will you trust?
Will you go the other way and support the people that are saying that Bitcoin will crash when Bitcoin has been growing since November 2022?
Bitcoin is going up.
The correction is over.
The bottom is in.
It will be a massive rise lasting more than 6 months.
Are you ready for the strongest bullish action you've seen in your life?
I am.
Thanks a lot for your continued support.
Namaste.

Notcoin Important Update (Boost & Follow)The conditions with Notcoin continue exactly as I described yesterday, there is slow and steady growth. What this signals is exactly what is happening, a rise.
But the rise is not the small climb in prices. The reason why prices are growing so slowly is in order for the market not to make too much noise or call the attention of too many people, why? So the whales can secure as much NOT (Notcoin) at very low prices before there is a massive rush of buying.
Notice the perfect step patterns, it continues and it is amazing. Just how perfectly it goes green, green, green, green... It has never been seen before on the Notcoin chart and this is happening right after a major bottom and true All-Time Low. This means the start of the first ever bull market for Notcoin. The 2025 bull market and long-term bullish wave. It will be awesome.
The chart reveals what is coming but not only the chart, I am here translating this chart for you. I have for you short-term analysis, long-term analysis, mid-term analysis, full trade-numbers, Soul uplifting messages and more. Notcoin is going up.
The March 2025 resistance is now about to be challenged, conditions are good. Today Notcoin wicked lower and is now full green, trading at the top of the candle.
When the resistance is broken, orange on the chart, watch the arrow; a major advance will happen propelling Notcoin on the strongest bullish wave since its launch wave and guess what? It will keep on going and going and going for longer than you can imagine or take, it will be great. Huge profits will be made. People will celebrate and the market will grow so strong... Buy and hold.
Namaste.

AI predict BTC\USD price, Unbelievable, Check This Out?BTC / USD. COINBASE. Apr 27, 2025 5:07 pm. BTC / USD. Comprehensive BTC/USD Trading Analysis & Strategy (April 25–27, 2025)
(All timestamps in ISO 8601 UTC)
---
I. Core Trend & Key Price Dynamics
1. Macro Trend:
- Mild Bullish Bias (+0.72% net gain) with extreme intraday volatility.
- Critical rejection at 95,500 resistance (tested on `2025-04-25T14:45:00Z`) and firm support at 93,000.
2. Volatility Clusters:
- High Volatility Phase:
- `2025-04-25T14:00–15:30Z`: Price swung between 94,440–95,564 with volume spikes (>750).
- Low Volatility Phase:
- `2025-04-27T00:00–20:00Z: Range tightened to 94,000–95,000, volume declined.
3. Pivotal Events:
- Bullish Breakout Failure: Sharp rejection at 95,564.90 (`2025-04-25T14:45Z`) led to consolidation.
- Bearish Engulfing Candle: At `2025-04-25T14:15Z` (volume: 846.26), signaling short-term top.
---
II. Multi-Indicator Convergence
| Indicator | Bullish Signals | Bearish Warnings |
|----------------------|---------------------------------------------|-----------------------------------------------|
| RSI 14 | Recovery from 40.79 (oversold) to 68.69 | Divergence at 61.24 as price rose (20:00Z) |
| CMF 20 | Surge to +0.428 (buying pressure, 17:45Z) | Drop to +0.056 (profit-taking, 20:00Z) |
| Supertrend | Bullish flip at 93,825.89 (18:30Z) | Flattening near 94,010.86 (indecision) |
| EMA 9 | Price sustained above EMA 9 (~94,300) | Failure to hold risks breakdown |
| Bollinger Bands | Breakout above upper band (94,191, 18:00Z) | Overextended near 94,540 (mean reversion risk)|
| MACD | Bullish crossover (17:45Z), peak at 47.61 | Histogram decline to 34.98 (momentum fade) |
| Stochastic RSI | Overbought (Fast K=100, 18:30Z) | Bearish divergence (Fast K=83.56 at 20:00Z) |
---
III. Strategic Trade Setups
A. Bullish Scenario (Confirmation Needed)
1. Entry:
- Break & Close Above 95,500 with volume >800.
- Retest of EMA 9 (~94,300) with RSI >50 and CMF >0.
2. Targets:
- 96,000 (psychological level), 97,500 (Fibonacci extension).
3. Stop-Loss:
- Below Supertrend (93,825) or 93,000 support.
B. Bearish Reversal (Caution Signs)
1. Entry Triggers:
- Close Below 94,000 with CMF <0 and RSI <50.
- MACD Bearish Crossover + Stochastic K/D cross below 80.
2. Targets:
- 93,000 (support), 91,500 (volume gap from 25th).
3. Stop-Loss:
- Above Bollinger Upper Band (94,540) or 95,500.
C. Neutral/Consolidation Play
- Range Trade: Fade extremes near 94,000–95,500.
- Stop-Loss: 1% outside the range.
---
IV. Critical Risk Factors
1. Divergence Risks: Bearish RSI/MACD/Stochastic divergences suggest upside exhaustion.
2. Volume Confirmation Needed: Bullish momentum requires volume >750 to sustain breaks.
3. External Catalysts: Watch for macro news (Fed policy, ETF inflows) around key timestamps.
---
V. Real-Time Alert Levels
| Level | Type | Significance |
|------------------|-------------|--------------------------------------------------|
| 95,500 | Resistance | Previous swing high; breakout invalidates bearish structure. |
| 94,300 | Support | EMA 9 dynamic support; loss opens path to 93,825. |
| 93,000 | Strong Support | Macro swing low; breakdown triggers panic selling. |
---
Final Outlook
- Short-Term (24–48h): Neutral-bullish with caution at resistance.
- Medium-Term (3–5d): Direction hinges on closing above 95,500 or below 93,000.
Immediate Action: Tighten stop-losses, book partial profits near 95,500, and await volume-backed breakout/breakdown.
(Indicators and price action analyzed in UTC timestamps for precision.) Disclaimer: This is not financial advice. Crypto markets are highly volatile and speculative. Always do your own research and consult a qualified financial advisor before investing. You could lose your entire investment.

Ethereum Starts Moving Toward $7,000 With...Ethereum starts its next major advance towards a target of $7,000 and beyond with a full green candle this week.
This week is not only a full green candle signal it also cancels out the last two which produced a bottom and neutral signal, as well as recover more than three weeks of bearish action.
So now Ethereum is moving back to levels it traded back in late March, above $1,800. Going to this level means higher prices and this is only the start.
The 7-April week is such a strong clear reversal signal it is hard to explain. We have a Doji with a multi-year low, but this low ended with a green candle and confirmation comes this week as Ethereum turns full green. This is the last chance to get Ethereum below $2,000 and while prices are low.
When the next move happens, which is a close and confirmation above $1820, ETHUSDT will never trade at these prices and levels again, likely ever. It will grow and grow so much that nobody will be selling as much as they sold in the past. The start of a new long-term bullish cycle; the 2025 bull market.
I wanted to let you know that market conditions are green and you don't have to hold anymore. The market will start moving and produce a period of expansion that has not been seen in so long.
Even if you have experience with previous bull markets, it is hard to put in words. When it is happening it is so much different. It is not the same saying or knowing that Ethereum will grow as seeing it happen, and when it happens it goes more than what you think is possible or you are prepared for.
If for some reason you did not position yourself when the time was right, now, you will be thinking, "Why didn't I buy? The market was trading so low for long..."
You don't have to reach this point.
The charts are yours, the market is yours and you have experience.
You can take advantage of this situation and become a big winner in 2025 and beyond.
Many millionaires will be produced this year, will you be one of those?
I don't know but I am working hard.
Let's win together, we can do this with hard work, smart work and dedication.
Thanks a lot for your support.
Namaste.

Alert! Strong Indication For Bullish Week & Bullish ContinuationSince the recovery in early April, the action has been mostly sideways and things are changing and about to change.
Good afternoon my fellow Cryptocurrency trader, this will be a great update if you are set to make money fast in the coming days.
XRPUSDT has been sideways while challenging resistance and this is as bullish as it gets and a bullish continuation signal. Today, XRPUSDT trades at the highest price based on candle body since the 28-March drop. It seems a new rise is imminent; bullish next week.
A bullish continuation of course is the resumption of a bullish move that paused. The bullish move is the move from November. Short-term the continuation is the advance after the 7-April recovery. The next high will be an easy challenge of $2.70 followed by $3.00 and finally a new All-Time High.
This is a friendly reminder. Once the action starts going, there is no stoping XRP. If you are not in or you are sleep, this is not the time to do so, it is the time to go LONG. Wise leverage is recommend, calm traders are recommend to use spot. Both choices are good because we are going up. XRP is ready to grow.
The next target, short-term and mid-term is mapped on the chart. You can visit my profile @MasterAnanda and type XRPUSDT using the search filter to find long-term targtes, 2025 All-Time High projections and full PREMIUM trade-numbers for this pair.
Thanks a lot for your continued support.
Namaste.

OTHERS/BTCUSD: The Ultimate Indicator for Altcoin SeasonsHey TradingView community! I’ve been analyzing the OTHERS/BTCUSD metric, and it’s painting an exciting picture for altcoin traders. This chart might just be the key to timing the next big altcoin rally — let’s break it down!
What is OTHERS/BTCUSD?
This metric calculates the total altcoin market cap (excluding Bitcoin) divided by BTC/USD. It shows how altcoins perform relative to Bitcoin.
High Metric : Altcoins are outperforming Bitcoin — think altcoin season!
Low Metric : Bitcoin dominance takes over, and altcoins take a backseat.
Historical Patterns: Falling Wedges Stealing the Show
The OTHERS/BTC Weekly chart reveals three Falling Wedge patterns, a bullish setup that’s historically preceded massive altcoin bull runs:
1st Altseason (2017-2018) : A Falling Wedge formed in 2016 (prior pink zone). The breakout unleashed a legendary altcoin rally — remember Ethereum and Ripple going parabolic?!
2nd Altseason (2020-2022) : Another wedge in 2018-2019 (blue zone) led to the 2021 altcoin boom, with projects like Solana and DeFi tokens soaring as the metric hit 10M.
3rd Falling Wedge (2022-Now) : Since 2022, a new wedge is forming (green zone), resurfacing the setups that sparked the last two altseasons.
Current Setup: A Critical Support Zone
As of April 27, 2025, the metric is approaching a key support zone of 2M-1.5M (where the altcoin market cap equals 1.5M to 2M Bitcoins).
Historical Significance : This level has been a launchpad in the past — both in 2016 and 2019, it marked the bottom before altcoins reversed and surged.
What’s Next : If this wedge breaks out, the metric could climb to 7M, 9M, or even 11.5M by 2025-2027. That could mean 5-10x gains from bottom for altcoins, depending on the pair!
A sinusoidal wave at the bottom of the chart — it reflect market sentiment cycles, with troughs (like now) often preceding altcoin season greed phases.
Why This Metric Matters
OTHERS/BTCUSD captures the flow of capital in crypto:
Bitcoin often leads bull cycles, pulling in capital first (metric drops).
When BTC’s rally cools, investors chase higher returns in altcoins (metric rises).
The Falling Wedges highlight this cycle — consolidation during Bitcoin dominance, followed by breakouts when altcoins take the spotlight.
Trading Takeaway
Monitor the 2M-1.5M Zone : A breakout here could be your green light to stack altcoins.
Cross-Check Bitcoin Dominance : A drop in BTC.D (Bitcoin Dominance) would confirm capital flowing into altcoins.
Pick Strong Projects : Look for altcoins with solid fundamentals — layer-1s, DeFi, or AI tokens could lead the charge.
What’s your take, TradingView fam? Are you gearing up for the next altseason?
Drop your favorite altcoin picks or charts in the comments — I’d love to hear your thoughts!

Breaks Out of Red Resistance Zone 🚨 NASDAQ:RAY
Breaks Out of Red Resistance Zone 🚨
NASDAQ:RAY
has successfully broken out of the red resistance zone, which was part of a symmetrical pattern. This breakout could signal a strong bullish move.
📈 Technical Overview:
Pattern: Symmetrical
Breakout Level: Red resistance zone.
🎯 Potential Targets: To be determined upon further price action.

Testing Red Resistance Zone🚨 CSECY:PENGU Testing Red Resistance Zone 🚨
CSECY:PENGU is currently testing a significant red resistance zone. A breakout above this level could signal a bullish move, with the first target at the green line level.
📈 Technical Overview:
Resistance Zone: Red area currently being tested.
🎯 Breakout Target: Green line level upon confirmation.

Inverted Head and Shoulders Pattern🚨 SUI Forming Bullish Inverted Head and Shoulders Pattern 🚨
SUI appears to be forming a bullish inverted head and shoulders pattern. For confirmation of this bullish pattern, the price needs to break out above the neckline, which is marked in red.
📈 Technical Overview:
Pattern: Bullish Inverted Head and Shoulders
Neckline: Red resistance level
Confirmation: A breakout above the red neckline will confirm the bullish pattern.
🎯 Potential Move: Bullish continuation upon confirmation of the breakout.

GBPJPY NEXT WEEK BULLISH OR BEARISH ??GBPJPY is setting up for a major breakout on the weekly timeframe. After weeks of consolidation under a clear descending trendline, price action is now approaching a decisive point where a bullish breakout could trigger a strong rally. With the current price holding firm at 191.00 and clear resistance overhead, a successful breakout could open the doors for a powerful bullish wave targeting 205.000 and beyond.
Fundamentally, the yen remains weak due to continued Bank of Japan dovishness and ongoing yield curve control policies. Meanwhile, the British pound is finding strength as the Bank of England maintains a relatively hawkish stance with the possibility of delaying rate cuts compared to other major central banks. This fundamental divergence between GBP and JPY heavily favors bullish momentum for GBPJPY.
Technically, the pair has formed a solid base of support and is squeezing toward the apex of a descending triangle. If the breakout confirms with strong bullish volume, GBPJPY could enter a fresh bullish cycle, offering a great risk-reward setup for medium to long-term traders aiming for the 205.000 area.
Overall, GBPJPY remains one of the hottest pairs on watch right now with excellent bullish potential. Traders should watch for a clean breakout above the trendline with strong candlestick confirmation to ride the wave higher. Staying patient and disciplined around this breakout zone could deliver highly profitable results.

HEIUSDT Falling Wedge Pattern Targets 150%-160% Gains!HEIUSDT is currently forming a strong falling wedge pattern, a classic bullish reversal signal. The price has been consolidating within this wedge for some time, and we are now starting to see a breakout attempt with good supporting volume. This setup is gaining attention among investors who are looking for promising opportunities in the altcoin market.
Volume has notably increased, suggesting strong buying pressure is building up. Historically, falling wedges often lead to explosive upward moves once a breakout is confirmed. In this case, the projected gain is around 150% to 160%, which makes HEIUSDT a very interesting pair to watch in the coming days and weeks.
Many traders are keeping a close eye on HEIUSDT due to the solid technical pattern and growing market interest. If momentum continues and broader crypto sentiment remains positive, this breakout could lead to substantial price appreciation. Risk management is key, but the potential reward here looks highly attractive.
✅ Show your support by hitting the like button and
✅ Leaving a comment below! (What is You opinion about this Coin)
Your feedback and engagement keep me inspired to share more insightful market analysis with you!

TAO ANALYSIS📊 #TAOAnalysis
✅There is a formation of Descending Channel Pattern in daily time frame in #TAO .
Also there is a perfect breakout and retest. Now we can expect a bullish move. If the price sustains the major resistance zone then we will see more bullish move
👀Current Price: $349
🎯 Target Price : $460
⚡️What to do ?
👀Keep an eye on #TAO price action and volume. We can trade according to the chart and make some profits⚡️⚡️
#TAO #Cryptocurrency #Breakout #TechnicalAnalysis #DYOR

BTC - Golden Pocket Confluence + FVG Sweep = Long SetupA highly refined scenario blending Fibonacci confluence with liquidity principles, setting up a controlled bullish play.
---
1. Golden Pocket + FVG Confluence — Critical Demand Zone
The blue highlighted area represents a strong confluence:
- FVG (Fair Value Gap): Imbalance left by aggressive price movement, likely to attract price for rebalancing.
- Golden Pocket: The 0.618–0.65 Fibonacci retracement zone, statistically favored for deep retracements and high-probability reversals.
Expecting strong buying interest once price taps into this confluence.
---
2. 0.618-0.65 Fib Range — Key Reversal Territory
The Fibonacci zone offers the perfect environment for engineered liquidity sweeps and smart money accumulation.
- This range often acts as a trap for retail shorts while institutions accumulate.
- A clean entry opportunity arises as price dips into this critical golden zone before expansion.
---
3. FVG Resistance Above — Initial Reaction Zone
A notable FVG resistance area is marked around 94,400–94,500:
- Upon reaching this zone, price may face initial selling pressure or short-term consolidation.
- Observing how price interacts here can further confirm bullish strength and continuation.
---
4. Smart Money Liquidity Play
The setup suggests a classic liquidity engineering move:
- Induce shorts through a pullback into the Golden Pocket.
- Absorb liquidity inside the FVG.
- Trigger a sharp bullish reversal aligned with institutional footprints.
This layered setup is clean, logical, and methodical.
---
5. Projected Price Flow
Anticipated price action structure:
- Step 1: Dip into the Golden Pocket + FVG demand zone.
- Step 2: Reversal toward the FVG resistance.
- Step 3: Breakout continuation upon reclaiming resistance, leading to further bullish expansion.
Each leg is mapped to follow high-probability liquidity behavior.
---
6. Summary:
- Golden Pocket + FVG = Prime Reversal Confluence
- Efficient Liquidity Sweep Mechanics
- Structured Bullish Progression Based on Smart Money Concepts
This plan is framed to capitalize on precision entries and liquidity dynamics without chasing price.

ETH TO THE MOON TRADEETHUSDT Weekly Analysis | 3M & 12M Supply/Demand Zones
Currently, Ethereum (ETHUSDT) is trading around $1803, sitting close to major higher timeframe zones:
3-Month Supply/Demand Zone: ~$1691
12-Month Supply/Demand Zone: ~$1557
Price has reacted strongly near the 3M S/D zone after a multi-month decline. Holding above this zone could indicate a potential bottom formation.
Reminder:
This is not financial advice. Always do your own research and trade with proper risk management.

Manta Network Bottom Situation—Trading Tips & Tricks (575% Rise)We have a situation here where the market bottom has been confirmed.
Notice that MANTAUSDT is trading above its 11-March low but below its 3-Feb. low. The pairs that are trading above the 3-Feb. low are stronger from a TA perspective and from a trading perspective and likely a fundamental perspective as well, compared to those trading below.
They are stronger first because the recovery is strong and second because the crash was smaller. In both cases, the rise and the drop, the market showed more support and action on these. This is something to keep in mind when choosing your pairs.
Stronger pairs tend to produce better results.
When retraces and corrections happen, they tend to happen all across. So those stronger will continue to outperform and you better choose those when choosing you Altcoins, with some exceptions of course.
There are thousands of Altcoins and it is hard to choose.
For me, I chose on 7-April when the bottom hit, so all are green, but the world (and trading) doesn't end there. The truth is that bottom prices are great but available only for the short-term.
You can use moving averages as well to know which pairs are better than another and which ones are more likely to move next. The ones trading above the longer EMAs are the ones that are stronger.
Just a few tips and tricks to improve your chances of success.
Thank you for reading.
Namaste.

Compound 4X Lev. Full PREMIUM Trade-Numbers (PP: 2428%)This is a very, very easy set of targets that I am setting up here for Compound (COMPUSDT). And this trade setup with 4X leverage is low risk, very low risk. High potential for reward (more than 2,000%).
After June 2023, the dynamics changed from lower highs and lower lows, to higher highs and higher lows.
Late March produced the highest (buy)volume ever for this pair on this exchange. Someone in the background knows what is about to happen. Someone big. Now you know too thanks to this chart and trade-numbers.
The stop-loss is not meant for your liquidation nor for any trading, it is meant to indicate when the chart setup goes bad. Leveraged trading is for advanced traders.
If the stop-loss conditions are met, maybe monthly rather than weekly, the chart setup and market conditions are lost. Obviously, the stop-loss conditions can be activated and yet, growth still happens within weeks or months. Stop-losses should be ignored. Only advanced traders should use those.
This is a high probability trade setup. High risk vs a high potential for reward.
The numbers are meant for illustration only. Some people can use them to make predictions, others to decide where to buy as simply Cryptocurrency investors, while still others can use them to trade.
How you use these numbers is to you. I am not responsible for any loses, for how the market behaves nor any of your mistakes. Trading is a game for adults. A game, truly. This game can produce money as well as losses.
Trade at your own risk. I am wishing you success and great profits. You can do this. Just keep trying, work hard, study... Focus.
Full trade-numbers below:
_____
LONG COMPUSDT
Leverage: 4X
Entry levels:
1) $46
2) $43
3) $41
4) $36
Targets:
1) $50
2) $55
3) $60
4) $75
5) $88
6) $100
7) $122
8) $140
9) $165
10) $180
11) $205
12) $245
13) $274
14) $311
Stop-loss:
Close weekly below $35
Potential profits: 2428%
Capital allocation: 3%
_____
Don't mind my disclaimer on these trades. Some people can't face the fact of a losing trade. It is for those.
Responsible people like you and me know how the game works. We are happy to accept our winnings as well as any loss. We do not blame others for our mistakes. Life is full of challenges, we use these challenges as learning experiences. Trying circumstances are what made us into who we are today.
When you are going through something hard, it can be tough to face this reality with a smile in your face. When you look back to the past, in retrospect after all is great, you might even laugh and wear a badge of honor for the hard times you were able to overcome.
Think about it, a challenge that was once a nightmare, is now only a story that you can share and enjoy while you continue to grow.
Trading can help you improve your life, if you are honest with yourself and accept the fact that the market cannot be controlled. Yes, there is some manipulation, but nothing can control how nature works.
Nature works in cycles... After going down, everything grows.
Cryptocurrency is going up. Get used to it, because we are about to be showered with tons of profits, lots of money for all those who take the risk to buy and hold. Buy and hold now that prices are low.
Namaste.

Nillion: Huge Long-Term Potential For GrowthThis one caught my attention and the project seems to be a good one, the concept behind it.
The chart here is very young so I am using a short-term timeframe, 4H.
(I will do a more thorough analysis once more data is available.)
The classic Adam & Eve (A&E) bottom formation is present on the chart.
The action recovered above the 6-April low but it is still early for this pair, which can be good, a good opportunity for buyers. Buyers beyond.
There is still no high volume candles/session but growth has been happening for 10 days. This isn't much but lower prices are better than higher prices. Again, for buyers.
This can turn out into a good project. I see bullish potential for this pair in the weeks ahead, and months.
There is room for growth.
100% bullish above support —blue lines on the chart.
In general, NILUSDT (Nillion) continues bullish as long as it trades weekly and monthly above the All-Time Low. Easy buy and hold.
Decentralizing privacy related data? Sounds great!
Namaste.

BITCOIN Breakout Confirmed - Is $106K the Next Stop?COINBASE:BTCUSD is displaying strong bullish momentum after breaking decisively above the key $90,000 level. This breakout occurred after a well-defined double bottom formed around the major support zone near $74,000. The inability to create a new low and the sharp rejection from that zone confirmed strong buyer presence and marked a clear exhaustion of sellers.
The market is now following through with a solid bullish impulse, pushing past intermediate resistance and confirming the continuation of the ascending channel structure. With buyers stepping in aggressively and price respecting bullish market structure, Bitcoin now appears poised to reach the next significant resistance zone around $106,000, which also aligns with a big resistance level.
From a fundamental perspective, Bitcoin is gaining strength due to several key macroeconomic shifts. The recent escalation of trade tariffs by the Trump administration has heightened economic uncertainty, driving investors to seek alternative assets outside traditional markets. Historically, Bitcoin has thrived during such periods of instability, acting as a hedge against fiat volatility and centralized policy manipulation.
Adding to this backdrop, global central banks continue tightening monetary policy, increasing fears of a recession. As inflation remains sticky and growth slows, capital is flowing into assets with limited supply and no centralized control, reinforcing Bitcoin’s position as digital gold.
Meanwhile, institutional adoption continues to climb. Spot market activity is increasing, and institutional investment vehicles are seeing significant inflows. Improvements in regulatory clarity and market infrastructure are reducing barriers, allowing larger players to participate confidently. This deepening institutional interest is providing a strong foundation for sustained price movement toward $106,000.
The convergence of powerful technical patterns, especially the confirmed breakout and continuation within the ascending channel, along with strong macro and institutional support, points to a likely continuation of Bitcoin’s upside momentum.
Traders should closely monitor confirmation signals, such as bullish volume surges, strong candle closures above the $90,000 breakout level, and continuation patterns forming on lower timeframes to validate this scenario.
Feel free to share your thoughts or add further insights into this analysis!

BRIEFING Week #17 : AAPL's fate is the SP'sHere's your weekly update ! Brought to you each weekend with years of track-record history..
Don't forget to hit the like/follow button if you feel like this post deserves it ;)
That's the best way to support me and help pushing this content to other users.
Kindly,
Phil

Brett: Your Altcoin ChoiceA Solana memecoin, Brett produced a year long higher low with the classic ending diagonal pattern to signal an upcoming trend reversal.
The first low happened in April 2024. The second and higher low this month, this week, 7-April 2025.
The chart dynamics are very simple. Are you wondering, is the timing right? Right for a buy, maybe. Right to hold or, will a reversal happen soon?
The answer is positive to all those questions.
The time is right and is also ripe for a reversal to take place. This is the best possible time right now to buy and hold. The market must be bought when prices are low and red. This is the situation with the chart today. Prices are low and red but ready to turn. All the early signals are in.
BRETTUSDT is showing potential for a strong bullish wave in the coming months. Being new and also trading at bottom prices, growth can go off the chart. I will not be surprised when this pair goes beyond the 1,115% shown on the chart, this target is based on the mid-term.
The first target can reach 415%.
This is an easy chart. This is an easy trade.
I don't like memecoins, but it is not about what I like, it is about what the chart says.
The chart says that this pair is bullish with huge potential for growth. If you like it, feel free to enter with force. The Cryptocurrency market is turning bullish now and this and other pairs are sure to grow.
Thanks a lot for your continued support.
Your timing is great. A good Altcoin Choice.
Namaste.
