inj breaks long consolidation 30$ coming injective one the solid utilty token recently breaks long descending channel consolidation in result expecting strong recovery in coming weeks expecting move towards 30$ in coming weeks
Crypto

BTC Next Move - Bulltrap or Take-off?In todays overview, we will discuss the price action of BTC and what we could expect in the short-term.
What will we discuss?
- Bitcoin approaching key resistance
- Daily trendline break - But no higher high yet
- Stochastic RSI overbought on the daily timeframe
- Defining the daily range
- Downside targets within the range
- Final thoughts
-----------------------------------------------------------------------------------------------
Bitcoin Approaching Key Resistance
Bitcoin is now pressing up against a significant resistance zone in the $88,000 to $89,000 range. This area is dense with liquidity, and many stop-loss orders have likely accumulated just above the previous local wick. It's not uncommon in these scenarios for price action to briefly push higher, grabbing that liquidity and triggering those stops, before reversing direction. A short-term stop run followed by a move to the downside wouldn’t be surprising and would align with typical market behavior in these conditions.
-----------------------------------------------------------------------------------------------
Daily Trendline Break – But No Higher High Yet
On the daily chart, BTC has managed to break above a descending trendline that had previously capped price action. While that initial breakout was a promising sign for bulls, price has since been consolidating outside the trendline without yet printing a higher high. Until that happens, the overall market structure remains bearish on this timeframe. A confirmed higher high would be needed to shift the daily trend back to bullish.
-----------------------------------------------------------------------------------------------
Stochastic RSI Overbought on Daily Timeframe
The Stochastic RSI on the daily chart has been in overbought territory for more than a week, which is typically unsustainable for long periods. This kind of prolonged overbought reading often precedes a pullback. The key question is not if a correction will happen, but how deep it will go. Ideally for bulls, a minor pullback followed by a higher high would be constructive and could signal the beginning of a stronger upward move. But until then, caution is warranted.
-----------------------------------------------------------------------------------------------
Defining the Daily Range
Currently, Bitcoin is trading within a well-defined range between $75,000 and $88,000. This is the key zone that traders should be paying attention to. As long as price remains within this bracket, we are in a ranging market, not a trending one.
-----------------------------------------------------------------------------------------------
Downside Targets Within the Range
If price does get rejected at the resistance zone, downside targets to watch include support levels at $84,000, $80,000, and $75,000. These levels could provide bounce opportunities within the range. There’s no need to speculate on price moving significantly below $75,000 unless that level is cleanly broken. Similarly, upside targets beyond $89,000 shouldn’t be considered until we see a proper breakout and continuation.
-----------------------------------------------------------------------------------------------
Final Thoughts
We should treat the current market as range-bound until proven otherwise. That means respecting the range: moves into resistance zones near FWB:88K – GETTEX:89K are potential selling opportunities, while dips into support around $75K–$80K may be areas to look for buying setups. Until either support or resistance gives way, expect this chop to continue, and trade accordingly.
-----------------------------------------------------------------------------------------------
Thanks for your support.
- Make sure to follow me so you don't miss out on the next analysis!
- Drop a like and leave a comment!

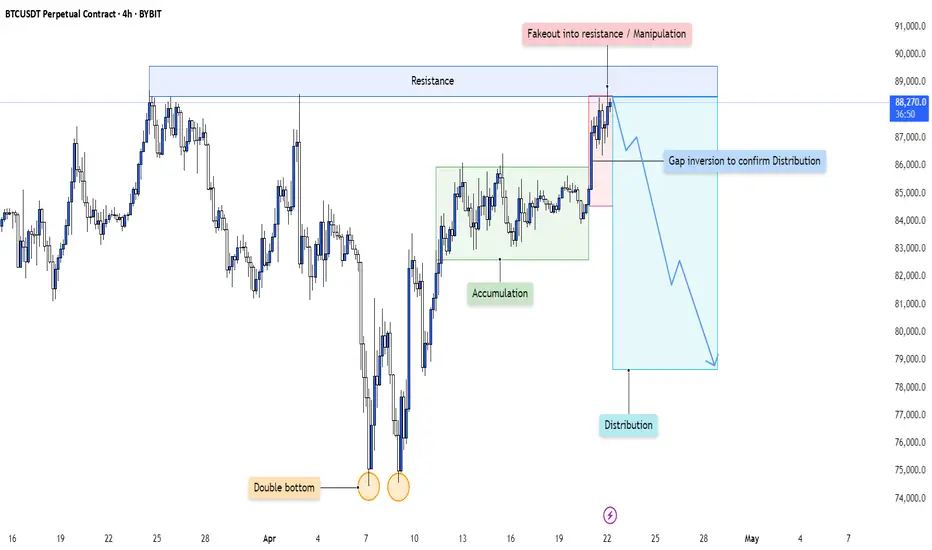
BTC - Distribution Confirmed After Accumulation Cycle CompletionThis 4H chart is a textbook illustration of how smart money cycles play out over time—starting with accumulation, leading into a sharp markup, and culminating in a deceptive distribution phase characterized by manipulation and false breakouts.
Let’s dissect each stage of this engineered move:
---
1. Accumulation Phase Following a Double Bottom
At the left of the chart, price forms a clear double bottom —a classic retail reversal signal.
- Smart money likely used this area to absorb sell-side liquidity, building long positions while retail traders expected further downside.
- This base formation set the foundation for the upcoming accumulation range , marked by sideways price action and multiple rejections from both highs and lows of the range.
The purpose of accumulation is simple: transfer supply from weak hands to strong hands. Every dip in this range allowed large players to fill bids without driving price too aggressively.
---
2. Sharp Markup and Resistance Interaction
Once positions were fully loaded, price launched into a strong impulsive move upward , confirming the transition from accumulation to markup.
- The move stalled at a clear horizontal resistance zone—marked as an area of prior supply and potential seller re-engagement.
- Price consolidated just below this resistance, building tension and liquidity in the form of breakout longs and stop orders from early shorts.
This led to the final stage of the cycle: distribution via manipulation.
---
3. Manipulation Above Resistance: The Fakeout
What followed was a classic fakeout above resistance .
- Price briefly broke above the key resistance area, attracting breakout buyers who assumed the trend would continue.
- In reality, this move served as a liquidity sweep and exit trap , allowing institutions to offload long positions accumulated earlier.
- The immediate rejection from this fakeout confirms a bull trap —a hallmark of distribution.
This is where smart money transitions from buyers to sellers while retail is left holding the bag.
---
4. Gap Inversion: Confirmation of Distribution
Post-fakeout, price creates a gap and immediately inverts back into the prior range , invalidating the breakout and forming a clear distribution schematic .
- The gap acts as a volume void or inefficiency , often revisited in reversal models.
- Once this area is rejected and price fails to reclaim the resistance zone, it becomes clear that distribution has been finalized.
- This breakdown marks the beginning of a markdown phase—typically faster and more violent than the markup.
The rejection confirms that price is now being delivered to the downside.
---
5. Narrative: From Accumulation to Redistribution and Collapse
This setup isn’t random—it’s narrative-driven:
- Double Bottom → Accumulation → Breakout → Manipulation → Distribution → Reversal
Each phase builds on the previous one, guided by smart money's intent to trap liquidity and maximize profit during transitions.
Now that distribution is confirmed, the expectation is continued downward delivery as price seeks out untapped liquidity and rebalances imbalances left behind during the markup.
---
Conclusion:
This 4H structure is a clear representation of the Wyckoff distribution model in action:
- Accumulation fuels markup.
- Breakout entices buyers.
- Manipulation traps them.
- Distribution unloads supply.
- Reversal completes the cycle.
The move down is not a random pullback—it is the deliberate continuation of a planned liquidity cycle . Expect further downside unless this structure is invalidated with a reclaim and break of the prior fakeout zone.
#HBAR Current Setup Showing Warning Signs | What's Next?Yello Paradisers! Is #HBAR teasing one last move up before everything collapses? Let’s break down what this suspicious structure on #Hedera is telling us:
💎#HBAR is currently trading at $0.183, sitting just beneath a heavy resistance zone around $0.190–$0.200. Price has been unfolding inside a clear Ending Diagonal structure—one of the most deceptive patterns in technical analysis. Wave 5 is still technically in play, but momentum indicators and volume behavior are telling a different story.
💎Volume has been steadily declining even as the price has been climbing, which is never a good sign this deep into a wedge pattern. On top of that, the RSI is pushing into overbought territory, showing that buyers are pushing the market higher, but with weakening strength behind them.
💎The resistance zone above current price is absolutely key. If #HBARUSD manages to break above the red zone and sustain momentum above $0.200, this would invalidate the current bearish setup and could open the door for an impulsive extension toward $0.220 and even higher. However, that scenario currently remains the less likely one unless we see a clear and strong breakout above the zone backed by volume.
💎Until then, bears are in control of the probabilities. The market structure favors a reversal from the Ending Diagonal, and if that plays out, the move could unfold quickly. First, we’ll be watching how price reacts at $0.142, which is the first major support and likely target if the wedge breaks down. A confirmed close below that level would likely lead to a continuation of the drop, with the next strong support zone near $0.125. This area has acted as a solid demand level previously and is also the region where the Volume Profile starts to spike again.
Play it safe, respect the structure, and let the market come to you!
MyCryptoParadise
iFeel the success🌴

ETHEREUM | 1H | IMPORTANT LEVELS AND MY TARGETHey there, my dear friends!
I’ve taken a deep dive into BINANCE:ETHUSDT just for you. If it breaks above the 1,693 level, the next target will be 1,800.0. On the flip side, a key support level sits around 1,473.0.
All I ask in return is your support through likes — it really means a lot!
Big thanks to everyone showing love and support with those likes!

NEAR Protocol Hits Bottom —Cash Or Crypto?This is a short-term chart but here the candles dynamics that I showed you recently with the long-term linear charts is also present. While the bearish move has momentum, the candles are big. When this momentum is lost, wanes, the candles become really small.
The candles becoming small can reveal a transition phase. From bearish to bullish, a sideways period. The bottom is in and NEAR Protocol is set to grow next long-term. A bull market.
After the low in March, we have a lower low and bottom.
The lower low can be known as a bottom because bullish volume starts to rise. There is also a recovery right after this low is hit. This is a small recovery but the volume and marketwide action tells us the bottom is in.
We are not looking for a new All-Time High, just focusing on the fact that the bottom is in, once the bottom is in we can expect growth long-term. So this is a friendly reminder to let you know that NEARUSDT is now showing great entry timing and prices.
In a few days, or weeks, it will move up strong and trade 200-300% above the current level, to never move back below. If you are reading this now, you have the chance to get NEARUSDT before some 10-30X total growth.
There isn't much complexity in trading when you choose to buy when prices are low. This is a true buy and hold scenario, this time it will be many times better compared to late 2024. It will be the ride of a lifetime.
Thanks a lot for your amazing support.
By the time this bull market is over, Cryptocurrency will be established as the default medium of exchange all around the world.
"Here is your Pizza, would you like to pay cash or crypto?
Crypto! Of course!"
Namaste.

EigenLayer Easy Targets, Broken Downtrend —500%Now we are looking at EigenLayer, a new project.
Notice the very strong downtrend that started in mid-December 2024. It is hard to believe that it has been already more than five months.
Notice this huge downtrend and how EIGENUSDT broke out without breaking bullish. This is ok if you are looking for good options to buy and trade.
This pair trades at a low price, early, and has huge potential for growth in weeks, months and days.
I will give you some targets, the bottom is in. But a full blown bullish confirmation happens when the action moves above 'main resistance'. The action is happening now within a strong buy-zone.
This zone is the last chance and opportunity to buy when prices are low. It will start growing next and this growth will go for months.
The first target can hit short-term while the second is set for the mid-term. Long-term, you can expect even more.
A perfect strategy for spot traders is simply to buy and hold. When prices are high, say 200%-300%, collect profits and move on to the next trade.
Repeat this process over and over, again and again, and watch your portfolio grow faster than the bull market.
Buy ten pairs and each time one matures, sell and find one trading near support and repeat the process. This is a simple strategy but it pays.
If you miss the selling point, wait.
Never buy when prices are high.
Never sell when prices are low.
Do it the other way around... Buy now, sell later when the masses start to buy at the top. When they are buying, you are selling.
Now that everybody is selling, you have to buy, buy everything up.
Namaste.

Dogs & Bitcoin —What Have They In Common? (1,500% Potential)This is truly it. Dogs has been rising steadily for the past seven days. There is a pattern that is classic but hasn't been showing in too many charts. The Adam & Eve bottom.
I am not one to make a decision based on a pattern but whenever reversal signals are present on a chart based on volume, candlestick reading and other indicators, there is always a pattern that accompany these signals. I don't go by the patterns but they are always there and work.
Recently we've been seeing many falling wedges and double-bottom and now this is the second A&E in a single day.
I don't go by the pattern but the bottom is confirmed and this pattern give further strength to the other signals that are present.
Volume is still low, at this point it can only mean one thing, it is still very early and there is plenty of room for maximum growth. 1,500% potential, see the chart.
» DOGSUSDT is trading at bottom prices with a bullish bias confirmed. The best time to buy is now, when prices are low. Soon, it won't be low anymore and the bottom will be forever gone.
Look at Bitcoin, it was trading below 80K just a few weeks ago and now the price is $93,000, never to go back below 80,000. A great opportunity is gone.
The market gave us plenty of time, plenty of opportunities to load up and buy, but once the discounts are over, it's over... But there are many Altcoins that are still trading low.
» That's the great thing about Crypto, if you miss one pair, there is always another one ready with huge potential for growth.
Namaste.

Will ETH do it again?Looks like we are in a decent spot to scale in for the next mark-up phase.
ETH has retraced a bit further/deeper than originally anticipated, however that just makes the entry all the better.

Time for a Bitcoin pull back?Finally bitcoin broke out of its consolidation/ down trend.
it looks like we could get lucky and have a nice little pullback to the green box.
If we are so lucky, buy with all you have. It may be the last time you see this price for a long time. When you see it next you probably wont want to touch Bitcoin with a 10 foot pole.

BITCOIN RESISTANCE AHEAD|SHORT|
✅BITCIN is going up now
But a strong resistance level is ahead at 94,900$
Thus I am expecting a pullback
And a move down towards the target at 91,000$
SHORT🔥
✅Like and subscribe to never miss a new idea!✅
Disclosure: I am part of Trade Nation's Influencer program and receive a monthly fee for using their TradingView charts in my analysis.

IOTA: Your Altcoin Choice (S3.5)IOTAUSDT was producing lower lows until November 2024, then it went bullish and the correction of this bullish wave ended as a strong higher low. This is the 7-April low three weeks ago. Now IOTAUSDT is full green on the third week. Growing non-stop since the bottom was hit.
So the charts are great. We can see the bear market, a consolidation period and then a recovery phase. Now comes the next stage of the cycle and this is a new bull market. See the action in 2021 for reference. Massive growth ahead.
Some targets can be seen on the chart. These are not potential ATH projections but rather conservative targets. Total growth in 2025 can be much more and it seems possible that the bull market will extend into 2026 because time is needed for massive growth.
The next cycle top can happen in November 2025 just as it can happen in February or March 2026, too early to know.
If we take November 2024 as the market bottom and count 1 year and 1 month for the totality of the bullish phase, this would put a new cycle top around December 2025, give or take a few days.
That's just the map. This can give you an idea of what to expect.
Plan and ahead and prepare.
I am wishing you great profits, ease in your personal growth journey and financial success.
May your life be blessed with abundance.
Thanks a lot for your continued support.
Namaste.

Siacoin: Your Altcoin Choice (S3.5)We haven't looked at Siacoin in the longest time ever and I have to say that conditions are great. The chart looks right and the timing is right for a new bullish wave.
Good afternoon my fellow Cryptocurrency trader, I hope you are having a wonderful day.
Bitcoin is bullish and the Altcoins are starting to recover, the bullish bias has been confirmed.
Siacoin is in a good spot right now if you are a buyer, a long-term higher low confirms this one as a strong pair. Many Altcoins produced a new all-time low in April 2025; here, for SCUSDT, this is not the case.
We have a long-term higher low compared to November 2022 and this is good, it signals that the incoming bullish wave will be more than good.
A classic correction, ABC, long-term. From a peak in February 2024 until present day. This is a very strong correction, next, there will be a bullish impulse composed of 5 up-waves. This is a classic pattern and market behavior, this is the end of the corrective phase.
The end of the correction signals the start of the 2025 bull market.
Not only a long-term higher low but higher highs are also present on the chart. February 2023 and February 2024, one year apart.
What if the next high, the new All-Time High happens in February 2026?
Or maybe November 2025.
Looking closer, SCUSDT is now on its third green week. There is also a volume breakout this week. Both signals confirm that the low is in.
» You can prepare for 10-15X, easy, but the market can produce 20 or even 30X. It is still too early to say, what we know for sure is the fact that growth will be happening for a long, long time.
Thank you for reading.
Your support is appreciated.
Namaste.

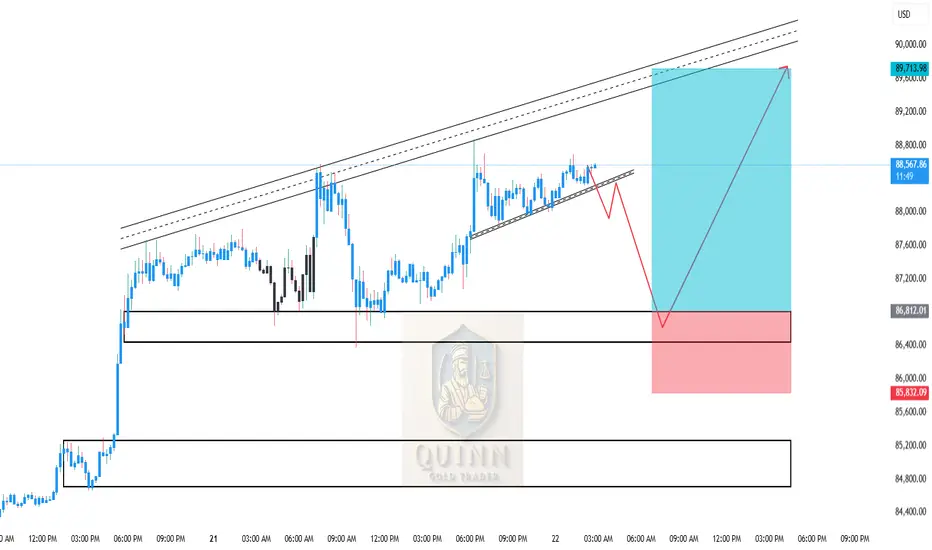
BTCUSD Intraday Move 22-04-2025📊 BTCUSD Analysis – April 22, 2025
Price action is currently forming a rising wedge, typically a bearish pattern, indicating that a short-term correction may occur before the next bullish impulse. The structure shows consolidation with weakening momentum, suggesting that a pullback to demand zones is likely.
We have two strong support zones identified:
Zone 1: 86,400 – 86,800 — minor support from recent consolidation.
Zone 2: 84,700 – 85,100 — major demand area aligned with previous breakout and price reaction.
A retracement into either of these zones offers high-probability buy opportunities for continuation toward the upper resistance trendline and prior high near 89,700.
📈 BTCUSD Buy Signal:
Buy Entry #1: 86,400 – 86,800
Buy Entry #2: 84,700 – 85,100
Take Profit: 89,700
Stop Loss:
For Entry 1: Below 86,200
For Entry 2: Below 84,500
Trade Idea: Wait for bullish price action (engulfing candle, pin bar, or volume spike) before entering.
SEI Trend Reversal? Breakout + Higher Low ConfirmedNYSE:SEI has broken above the key descending resistance line, signaling a shift in momentum after an extended downtrend. The price also rebounded strongly from the support zone marked in the chart, forming a clear higher low.
Currently, SEI is pushing through a critical zone where support previously flipped into resistance, now testing the 50 EM as the next challenge.
If the price can hold above this zone and close with strength, the next leg up could target $0.30–$0.50, as shown on the chart.
DYOR, NFA

SUI Trade Setup – Early Reversal PlaySUI has just swept underside liquidity around $1.80, reclaiming key support and showing signs of a potential trend reversal. If it holds this higher low and breaks above $2.40, that would likely confirm a bullish structure shift and open the door for a strong move up.
📍 Entry Zone:
Around $2.25
🎯 Take Profit Targets:
🥇 $2.73
🥈 $3.40
🥉 $4.00
🛑 Stop Loss:
Daily close below $2.00

S Token Breakout Play – Fibonacci Level in FocusThe chart for S is shaping up well, especially with price action testing and now breaking above the 50% Fibonacci retracement level at $0.52. This breakout zone often acts as a pivotal shift in sentiment from consolidation to continuation.
📍 Entry:
Around $0.52 breakout confirmation
🎯 Take Profit Targets:
🥇 $0.60
🥈 $0.70
🛑 Stop Loss:
$0.49 (just below the breakout level to protect against fakeouts)

Stafi Long-Term PREMIUM Full Trade-Numbers (PP: 2063%)Stafi is now trading at bottom prices after hitting a new All-Time Low and this is a great place to enter. This is the perfect chart setup for spot traders.
Here I will share the full trade-numbers for this pair, FISUSDT, and share some of the chart technicals with you that reveal the upcoming change of trend.
Let us start with how to predict a bottom based on the chart structure and the candles.
Notice the "bearish wave" on the left side of the chart. Notice the size of the wave, the length, strength and duration. A "bear market." Simply a long-term correction.
Now, notice the "bottom wave" on the right side of the chart (orange). Notice the size, the length and duration. It is very steep. It goes very fast and it is small thus short-lived.
» The first one is a market phase/cycle while the second one is a market reaction.
» The first one led to a sideways market while the second one will lead to a change of trend.
There are two sets of numbers. Here I am only using one for the trade below but I would still like to explain this method that I use in case you want to learn to do your own numbers by looking at charts.
The first set of numbers uses the All-Time High and the bear market bottom. In this case this would be the peak price 01-March 2021 and the low set 09-May 2022. The low is the zero and the peak the one using the Fibonacci extension tool. The 1.618 is the standard ATH projection. If you are feeling confident, the market is producing strong higher lows, the pair is good, there is strong volume, etc. You can also consider the 2.618 level which is not shown on this chart. Of course, if you move the chart up a little bit you can easily see it.
The second set uses the current market bottom, in this case the low 7-April 2025 and the previous high, 09-Dec 2024. This will give you a set of numbers that you can use to extract also some short-term targets. The first set would only have long-term targets.
When a trading pair produces new All-Time Lows we say that a new All-Time High is not likely but this isn't necessarily true, this is a technical assumption. The truth is that anything is possible and not even the insiders and exchanges who control the bots that control the price of a chart know how far up a pair can really go. When the euphoria phase of a bull market starts it is hard to maintain control.
A bullish wave can be neutralized with massive selling pressure. This is done all of the time. If any trading pair starts to grow organically for whatever reason on any exchange, the bots owned by the exchange immediately start selling and balance thing out, they just don't like things moving in ways that they do not control.
Anyway, let's continue; Full trade-numbers below:
_____
FISUSDT (PP: 2063%)
CURRENT PRICE: $0.1263
ENTRY:
1) $0.1420
2) $0.1150
3) $0.0999
TARGETS:
TP1: $0.1852
TP2: $0.2361
TP3: $0.3206
TP4: $0.3889
TP5: $0.4571
TP6: $0.5543
TP7: $0.6781
TP8: $0.8888
TP9: $1.0356
TP10: $1.2566
TP11: $1.4140
TP12: $1.6141
TP13: $2.1926
TP14: $2.7711
STOP: Close monthly below $0.0990
_____
No stop-loss. When trading spot you should be ready to wait for years. That's the mindset. If you are not ready to wait for years, well, you can do whatever you want of course but with this mindset you can never go wrong. There are many ways to approach a trading pair but sometimes we are ready to wait 3 months for a bullish wave and yet it takes 6 months for the wave to develop. Next time we are ready to wait 6 months to see prices go up but the wave starts in 12 months and so on. So always be ready to wait 4-5 times longer than what you initially think is the necessary time for the market to change course. Never place a stop-loss in an exchange because that is just bad for the market, the bots will sell just to active your stop.
Stop-loss orders should be avoided at all cost if you are a beginner or a spot trader. Simply buy and hold.
You can use a stop-loss trading short-term and in many different systems but I am talking about reality here, it is not the same.
Never close a trade out of a whim. Either you do it or yo don't. Either you plan or you don't trade.
If you plan you will be successful and you will achieve success. If you don't plan, you can make money but you will be gambling and this gambling will end up in negative results in the long-term. So, if you are not ready to plan/prepare then just wait, the market is not going away. When you are ready, enter with a plan and you will win for sure.
The plan is easy, what to do when the market moves in a certain way. If it rises, will I sell or hold? If it drops, will I sell or hold? If you decide the answer is to hold then, for how long? If you decide the answer is to sell, how much? Just prepare for all scenarios. You don't have to do anything really other than buy low (now) and sell high (later), but doing the mental exercise will save you from stupid mistakes when excitement (or anxiety) grows.
Just practice.
Success is yours.
Thanks a lot for your continued support.
If you enjoy the content, just follow.
Namaste.

Top Altcoins Choice —Your Pick (Session 3—2025)When Bitcoin grows, the Altcoins grow. It is easy to know when the Altcoins will be growing if Bitcoin is moving up with momentum, but what happens when Bitcoin isn't doing anything, just sideways?
When the Altcoins grow, Bitcoin grows. It is easy to know what will happen to Bitcoin by tracking the Altcoins market. Right now, many Altcoins are breaking bullish three digits green on the day. This is the first time since August and November 2024, before a major bullish impulse. This type of action reveals that the Altcoins market is set to grow.
» When the Altcoins grow, Bitcoin grows. The Altcoins are starting to grow now, which means that Bitcoin will do the same. This is now confirmed.
Top Altcoins Choice —Your Pick (Session 3)
The market is turning bullish and this is no longer my speculative opinion, this is now a confirmed fact. You can always go to any Cryptocurrency exchange and look at the list of trading pairs, sort the listing to show the top earners first and you have your proof. Whenever there are many pairs, true projects not scam coins, growing 2-3 digits green, that means that the market is bullish.
See for yourself and tell me what you see. Knowing this, let me do an analysis for you, which one is your favorite Altcoin pair? What is your TOP Choice? Which Altcoin will you pick?
Leave a comment with the trading pair you want me to look at. Make sure to add some questions; What would you like to know about the project in question and the chart? What is your trading strategy? Are you trading short-term or long-term? Are you a reporter, a writer, a reader or a trader?
Are you serious about Crypto or just passing by?
How long have you been in this market?
Have you been successful before?
Do you use mindfulness for trading?
Do you process stress through exercise, eating, fasting, drugs or meditation?
What method do you use to handle the stress that comes from engaging the market?
What are your goals?
Share some information together with your pair so that I can do a personalized analysis based on what you want.
I will respond your comment with a published analysis or an analysis on the comment reply. One condition though, the trading pair must be available on this TradingView platform with at least 6 months of data for the analysis to be viable.
Let's find some great Altcoins. The BTC pairs are in a great situation right now and great prices are still possible but not for long.
The time is now, which one will be Your Top Altcoin Choice?
See you in the comments section below.
Thanks a lot for your continued support.
Namaste.

Bitcoin call from March comes into fruition, Almost to the day!Not looking to toot horn but, did we state anything about buying CRYPTOCAP:BTC or CRYPTOCAP:ETH until recently? NO! (pls see our profile for more info on that)
We have been analyzing Bitcoin & Ethereum and posting suggestions. But until recently we did not state any buy recommendations.
In fact, om March 25th we stated that there would be a big move coming by mid April!
We then changed our stance on #Bitcoin. We noticed, far to frequent anomaly using
@tradingview charts, trendlines MOVE on their own, that the move COULD be until the 8th of May! HOWEVER, less than 2 weeks ago, we stated that A MOVE was coming before then. It has happened almost to the T!!!

LTO - Its Logo Says It All...Hello TradingView Family / Fellow Traders. This is Richard, also known as theSignalyst.
📚 After breaking above the $0.03 structure marked in blue, GETTEX:LTO has shifted its momentum from bearish to bullish.
It is currently in a correction phase, but as long as the $0.03 support holds, we’ll be eyeing trend-following long setups to catch the next impulsive wave upward.📈
🎯 Short-term target: $0.05
🎯 Mid-term target: $0.10
🎯 Long-term target: $0.50
📚 Always follow your trading plan regarding entry, risk management, and trade management.
Good luck!
All Strategies Are Good; If Managed Properly!
~Rich

Daily Price Action BITCOIN BTC Tuesday 4/22/2025In this video, we will be looking into the potential price action of BTCUSD.

BTCUSD Weekly Analysis Targeting; 94k - 96k, Followed By 109k
BTCUSD Weekly Analysis
Bitcoin is currently trading around $88,638, showing strong recovery momentum after bouncing off the key 61.8% Fibonacci retracement level at $74,412, often referred to as the “golden pocket.” This bounce suggests that buyers are stepping in aggressively at this support zone, which has historically acted as a major turning point in bullish market structures.
On the upside, BTC has now reclaimed the 38.2% retracement level at $87,375, turning it into a short-term support zone. Holding above this level gives Bitcoin a clear path toward the next key resistance at $94,430, followed by a stronger resistance cluster around $96,211, where both Fibonacci and historical horizontal resistance align.
Technically, the weekly chart also confirms a breakout above the descending trendline, adding confluence to the bullish reversal. This move aligns with the Inverse Head & Shoulders pattern seen on the daily chart — a classic bullish formation that typically leads to strong upward continuation.
If BTC continues to hold above $87,000, the next short-term target would be $94,000–$96,000, and if that level breaks with volume, Bitcoin could be gearing up for a retest of its previous highs around $109,000. On the downside, $81,145 (50% retracement) and $74,412 (61.8%) remain critical support levels, with any break below $74K shifting the outlook back to bearish.
The chart structure, key Fibonacci zones, and bullish reversal pattern all point toward continued upside, with BTC needing to maintain above GETTEX:87K to sustain the bullish trend.
