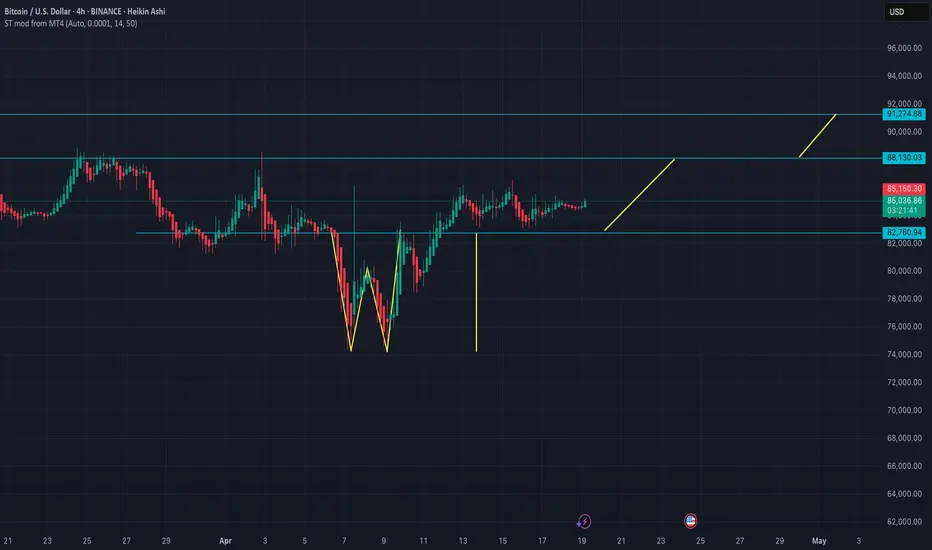
levels to watch The market has formed a W pattern and is currently trading above the neckline. The measured move from this pattern points to a target of 91,300.
What’s particularly interesting is that 91,300 also coincides with the neckline of a previous top, which could act as a significant resistance level — likely sparking a strong battle between buyers and sellers at that point.
If the market manages to reclaim and hold above 91,300, we could see a continuation toward the 108,000 and 125,000 levels.
I’m currently long on BTC from 78,000. My plan is to take partial profits around 88,130 and close the remainder at 91,300. From there, I’ll reassess based on the market’s reaction and look for the next directional cue.
Crypto
ApeCoin 666% —The Uptrend From Hell (How To Maximize Profits)It has been now five months and a half since this downtrend here on the ApeCoin chart got started. The candles fit perfectly within a descending channel.
The highest bearish volume session happened 24-February. This is followed by the highest volume day ever, then APEUSDT continues lower and producing lower lows with minimum trading volume.
The 7-April low ended closing green and with a reversal candle. It is easy to see that the downtrend has no strength. It is no surprise then to find out that I am calling for a reversal now, a change of trend.
» How does one can maximize profits from a chart set up like this one?
Buy as low as possible and sell as close as possible to the top. Right now we don't know where the top is but we can easily spot the bottom. The bottom the current price and trading zone. At whatever price ApeCoin is trading now will remain the bottom when action turns green. There can be shakeouts and swings and this wouldn't change anything for you and me. A spot trader should only buy and hold. If the market lowers, nobody cares, we wait. If the market moves higher; truly awesome, this is great.
» How to maximize profits?
Buy now and wait.
Namaste.

Bitcoin is currently trading around 85,269.35 USDT. Bitcoin is currently trading around 85,269.35 USDT.
Support Zone: A crucial support zone marked in green suggests strong buying interest between 80,000 and 81,000 USDT.
Resistance: The upper trend line indicates resistance; if Bitcoin can break it, it could target levels close to 88,000 USDT.
Bullish Case: A breakout above the upper trend line could lead to an upward rally towards 88,000 USDT or above.
Bearish Case: If the price breaks below the support zone, a downward move towards 75,000 USDT can be expected.
Monitor the trade closely to see how it reacts around these crucial levels. Adjust your strategy accordingly based on the price action. If you have further questions or need analysis on specific indicators, feel free to ask!
If you found this analysis helpful, hit the Like button and share your thoughts or questions in the comments below. Your feedback matters!
Thanks for your support!
DYOR. NFA

Pi Network is a stablecoin? “Cryptocurrency is becoming more popular. A legal framework for stablecoins is a good idea.”
Jerome H. Powell
The market, global economy is entering a greatest thunder storm, yet not end.. and it is still going. The financial market, organization, banks, ets.. are now getting fear, panicking on what is happening to the market crash, and new tariff pause.
Yet, there is a crypto..still not yet plumeting crashing and waitting the game changer. Crypto already grow rapidly fast years by years, and proven in the market crash, covid , the crypto still strong.
The price currently trying to breaking trough resistance and still in the bearish for the moment.

Bitcoin Dominance Quick UpdateThe high happened in February 2025. 7-April produced a lower high.
The session that produced the lower high is also a hammer. A hammer here can indicate an upcoming change of trend.
As long as BTC.D remains below 64% it has a very high probability of starting a descent.
If BTC Dominance moves and closes daily above 64%, this analysis and signals become invalid.
If the BTC.D hovers below 64%, the longer it stays below this level the weaker it becomes.
When this index goes down, everything Cryptocurrency grows, including Bitcoin.
It will be very interesting to see how it all develops. More and more signals are pointing toward an Altcoins market bullish wave developing now, not later. Do you agree?
Thank you for reading.
Namaste.

Bittensor Breaks Descending Channel, 10X Potential Vs BitcoinAnother downtrend is reaching its end. You are about to experience something that you have never experienced before. You are about to feel something you have never felt before. You are about to become rich; buying, trading, holding, investing in Crypto. That's the experience you are about to embark on.
Another downtrend comes to an end. Here Bittensor—TAOBTC—is breaking out of a descending channel. As this breakout occurs, a downtrend is left behind. The end of a downtrend signals the start of a new trend. An uptrend.
The bottom already happened 7-April, this we already know. The action now is bullish-already and confirmed. Crypto is going up.
Potential is great, I am showing 690% on the chart. This would be profits, you need to add the 100% you put in. So total growth from current price to the main target on the chart would be 790%. Profits potential 690%. There can be more.
Bittensor can grow more than 10X vs Bitcoin.
These are true bottom prices. The best entry probable, the best timing possible... This is your chance.
Thanks a lot for your continued support.
Namaste.

Hive Breaks Above Resistance, Easy 190% Jump In The MakingI don't have to describe the signals because it is already happening, the results will speak for themselves.
I have to describe the signals because we cannot post a chart without adding some text. So some times you will see me writing just to meet the requirements but I would just love to say, "It is going up."
Sometimes no words can give a stronger message than too many words, but the rules say that we have to write so, here we go:
» HIVEUSDT is trading within a long-term higher low. Long-term for me is 6 months or more for Cryptocurrency pairs, and here the main low happened in early November 2024, so this higher low can be called long-term. Of course, the second low happened recently, 7-April 2025, when the correction reached its end marketwide.
» A broken downtrend, based on an internal trendline and a move above resistance is also taking place. I can guess a strong RSI and move and close above some moving averages, in this case, EMA34 has been conquered.
» A nice and easy 190% bullish jump is in the making, this can happen within days or weeks, short-term. Within 30 days (one month). There will be more growth but this is for another day. This chart analysis is for those trading short-term.
Namaste.

Adventure Gold Breaks Downtrend —Easy 400%+ Within 3 MonthsThis is a very simple trade-idea. A perfect trendline is being broken, a downtrend, together with rising volume. The break of this descending trendline signals the start of a new bullish wave.
Keeping it short and simple, Adventure Gold (AGLDUSDT) is ready to grow. Profits potential goes to 437% in the mid-term. Easy and short-term a 149% profits target (249% total earnings) can be hit.
Strategy: Buy and hold. Set the sell orders on target right after buying and wait patiently. When the targets are hit, collect the profits and move on to the next trade. Just one set of actions and the market takes care of the rest.
Thank you for reading.
Namaste.

Price lower, RSI higher. Bullish divergenceAave has some minor bullish divergence a RSI is trending higher while price is lower. Also approaching the meme resistance line. Furthermore, I am bullish Bitcoin. This should theoretically lead to a break out for Aave. Bottoms in.

DOT About to Break Down? Don’t Fall for the TrapYello Paradisers! Could this "bullish" pump on DOTUSDT be leading traders straight into a bear trap?
💎DOTUSDT is currently forming an ascending channel, which is historically a bearish pattern. These setups often lure in breakout traders before reversing sharply, shaking out weak hands and triggering stop-losses.
💎The price is now approaching a critical resistance zone, where the Fibonacci golden pocket overlaps with the 200 EMA — a powerful confluence. If DOTUSDT grabs liquidity above the recent highs, it would significantly increase the probability of a bearish reversal from that region.
💎For safer, more conservative traders, the best strategy here is to wait for confirmation of a bearish pattern within this area. That would offer a stronger risk-to-reward ratio while allowing more control over trade execution. Patience pays, especially when the market tempts you with low-conviction breakouts.
💎However, if price breaks out and closes decisively above the invalidation level, then the entire bearish idea becomes invalid. At that point, it’s essential to step back and reassess the structure rather than forcing a trade.
Discipline is what separates professionals from gamblers. This setup demands patience, a level head, and an understanding of risk management.
MyCryptoParadise
iFeel the success🌴

Ethereum (ETH): Our Attentions Are At Bollinger Bands Now, as many of you remember, we are aiming to see the bullish CME (on upper zones) to be filled on ETH, but there is no proper volume from any side currently.
So with this kind of sideways movement, our attention is at Bollinger Bands upper and lower zones, which are going to be our micro target zones while we see a proper BOS from either buyers or sellers.
Also keeping eyes on the middle line of Bollinger Bands, as this can be our trend ladder to either lower zones or upper zones. So let's keep on monitoring until we get more clarity.
Swallow Academy

FILUSDT-Analysis-WeeeklyIn the Weekly timeframe FILUSDT reached a powerful reverse point
** No FUTURES **
Target = 7.5$

bico getting ready for 2x bullish wave after long time, seems like bico getting ready for another breakout, currently testing multiple resistance area, once falling wedge and horizontal area got cleared, it can give solid bullish rally towards 0.2$ waiting for breakout

Is #BNB About to Break Down or Not? Don't Get Caught Yello, Paradisers! Is #BNB teasing one last move up before the trapdoor opens? Let’s break down what this suspicious structure of #BinanceCoin is really telling us:
💎#BNBUSDT is currently trading around $589, which is right under 200 EMA resistance. The price has been developing inside a clear Leading Diagonal Formation. Here’s the twist: Wave 5 is still in progress, and there’s growing evidence that the move might fail before it even completes.
💎We’re seeing Bearish Divergence flashing on the MACD histogram, which historically signals fading momentum. This divergence could drag #BNBUSD down before Wave 5 finishes, causing an early breakdown of the entire structure. This would completely shift the market bias in favor of the bears.
💎Key resistance levels are stacked around $599, right under the 200 EMA. A confirmed breakout and hold above this zone would invalidate the bearish setup and open the door for a potential bullish extension above $620, but that scenario remains the less probable one for now.
💎Until then, all eyes are on support zones at $533 and the critical swing low at $471. If price closes below the diagonal’s lower boundary and drops beneath $533, it’s likely to trigger a heavy selloff toward the next major demand level at $471, which could form the next Swing Low.
Play it safe, respect the structure, and let the market come to you!
MyCryptoParadise
iFeel the success🌴

Celer Network Short-Term Full Trade-Numbers (PP: 126%)Celer Network is starting to move as it recovers from a descending trend. A break of this trend will lead to some growth and this growth can easily produce 100%+ profits in the short-term.
Here, I want to share the full trade-numbers for this chart setup.
_____
CELRUSDT (PP: 126%)
ENTRY: $0.007400 - $0.008455
CP: 0.008376
TP1: $0.009010
TP2: $0.010354
TP3: $0.011360
TP4: $0.012955
TP5: $0.014265
TP6: $0.016061
TP7: $0.017340
TP8: $0.018966
STOP: Close daily below $0.007300
_____
It is up to you how you use these numbers. These are for reference only.
You need to do your own planning and decision making.
Some trades can do good and move as projected while others can fail. Only the market knows and the market decides.
Here it is not hard to predict a bullish wave, the Altcoins hit bottom recently and are now starting to recover.
When trading spot, it is very simple, we simply wait. Buy and hold, the market takes care of the rest. Only sell when prices are up. Simple, simple, simple.
Thanks a lot for your continued support.
Namaste.

Render Is Ready, Bottom Confirmed (340% Easy Target)Render Token is super ready right now and the correction bottom is now confirmed. Notice this pattern on the chart. There are two lows and then a move back above support.
The current candle is the bullish signal. After trading lower, it is now at the upper end of the session, trading near the session high. This high is higher than the previous session open and the close of the one preceding it, the full green candle.
After the main low there were two strong green sessions. Followed by one red session and the current session moving lower, meaning bearish action. This bearish action is being negated and once this session closes green, we have a very strong bullish signal with the bottom confirmed. This will be the start of the next bull market phase.
There will be long-term growth. RENDERUSDT can grow much more than the 340% shown on the chart. It will definitely go much higher, this target is for the mid-term, within 3 months. It will start to grow now, in the coming days and weeks and everything will speed up. This target will hit but no big deal, there will be more.
Expect a correction between now and the final bull market bull-run. The correction can last three weeks just as it can last 2 full months or more. We will have a better idea when the bull market starts to develop. It is still very early but also very close. We have only a few weeks before the entire Cryptocurrency market turns green.
Namaste.

FET Correction Bottom Confirmed —Buy OpportunityThe next All-Time High for FETUSDT in late 2025 or early 2026 can reach between $5.42 or $8.56, giving us more than 1,600% profits potential from the current price. This is taking $8.56 as the next All-Time High. Let's get that part out of the way because I want to show you the end of the current correction. I am using the linear scale so it won't let me show you higher targets on the chart.
There was a resistance level in April 2022 as the bear market developed. This resistance was confirmed again in February 2023. It took 270 days, or 9 months, before this resistance level was conquered (broken). As soon as it broke, it was tested as support (Feb. 2024) and then a major rise. This major rise completed a long-term bullish cycle and after a bullish cycle a correction always develops.
How far down can the correction reach?
How low can prices go?
The correction started in March 2024 and is active until this present day. Obviously, the strongest resistance price range in the history of FETUSDT will need to be tested again but as support.
Now, FETUSDT bottomed last week and this bottom happened at the same level where the April 2022 and February 2023 resistance was found. As the action approached this level, volume started to go up. The next week, this week, we have a bullish candle and this is very likely the end of the correction; the bottom is in.
I just wanted to let you know that this level will hold because it was a strong resistance in the past. A resistance level once conquered turns into support.
As prices are now, it is the best possible time to enter; buy, go LONG.
This is a friendly reminder. I am wishing you tons of success and huge profits in this bull market that is just about to develop. It will be a bull market that will change the world. The world is already changing, but this bull market will close the deal. By the time it is over, Cryptocurrency will have taken over the world.
New money. The rich nouveau.
Namaste.

Dego Finance New 2025 All-Time High Confirmed (4,400% PP)The volume gives it away, truly. Dego-finance produced the highest volume ever in March 2025, even higher than in early 2021 before the major bull market rise. A rise that ended with more than 7,000% total gains.
Highest volume ever and long-term higher lows. It seems DEGOUSDT is getting ready for a new All-Time High in the coming months. This pair and chart seen pretty strong.
Let's skip the TA because this one is just too say. Since it is too easy and fully confirmed, let's map the potential ATH price.
» Two targets: $55 (~2,700% Profits Potential) and $89 (~4,400% PP). Pick one.
Namaste.

Kaspa looking for a bounce!$KASPA looks to have found a local bottom at .05!
I see clear support structure developing between the two price swings in 2023.
A retest of this area with increased volume would confirm this as an area of support!

Bitcoin & ... Top Altcoins Choice— Your Pick (Session 2—2025)Bitcoin continues to do great and today moved for the first time above $86,000 after the 7-April 2025 market correction bottom and low. This is the lowest price before the 2025 bull market bullish cycle, phase and wave.
The 2025/26 bull market will be an extended bull market. The next All-Time High is likely to happen around late 2025 or March 2026.
When Bitcoin is really strong, trades above $80,000, the Altcoins tend to follow. Most of the Altcoins already hit bottom and started to grow. With Bitcoin on a path toward 100K and beyond, this can result in a massive bullish wave across the entire market. It will be awesome.
Knowing that Bitcoin and the Altcoins market bullish bias is confirmed, I would like to know your Top Altcoin Pick.
» Top Altcoins Choice —Your Pick (Session 2)
Let's start a new session, which pair is your Top Altcoin Choice? With Bitcoin doing great, the Altcoins are bound to the same. Let's try and find together many hidden gems.
I will do a full chart analysis for your chosen Altcoin and publish in my profile. It can be any pair that is available for trading within the Cryptocurrency market. There is one condition though, the pair must be available here on TradingView for me to do an analysis and the chart must have at least 6 months of data.
Instructions:
1) Leave a comment with your desired pair. Example: ETHUSDT, BTCUSDT, SOLBTC, etc.
2) Make sure to add any questions you have about the pair in question in the comments so that I can answer in the analysis.
3) If you see any pair that you like from other users, make sure to boost their comments. The comment with the most boost will get published first.
Notes:
➢ I will take anywhere between 50 and 100 requests.
➢ I will pick and choose. The pairs with the best looking charts, high growth potential and strong signals, will be selected.
➢ Maximum one trading pair per person/user.
➢Those that didn't participate in the last session will have priority in this session.
Your support is highly appreciated.
I am looking forward to review your Altcoins.
Namaste.

Solana Bullish Based On Volume & Support, Or Crash?Solana is now bullish, I shall explain. Many signals are pointing to this fact, these are easy to see. Once I share them here, below, you will agree with me 100%. Correct?
Let's start with the easy part. Volume is rising and has been very strong lately. A significant rise in trading volume after a major drop and as prices grow is a signal that confirms any bullish development. The bullish development is the move and recovery above support.
Support is found as the 0.148 Fib. extension level, Solana trades above it. Support is the early August 2024 low. SOLUSDT trades above it. Support is EMA34, Solana closed daily above this level after resistance was met. Support found, bullish.
The RSI is bullish with a reading of 55. A bottom formation is present, v shaped pattern. Do you want more?
One signal is good but not enough. Two signals are good but we need more. Three signals can count toward reaching certain conclusions about what will happen next. When you have 5, 6, 7 strong signals all combined, it is hard to miss what the chart has to say. Too many signals now are pointing toward higher prices. Do you see any bearish signals?
You can say bearish only if you ignore the bullish signals.
Or you can say bearish if you don't have a chart.
If you are with me now —thanks for the support— you already know that Solana is set to grow.
Solana will soon trade above $400. Very easy, I know you agree with me because I showed you data to support my point of view. It is not done blindly. Everything I wrote can be confirmed by anyone, at any point in time. Now.
You can check each signal for yourself; what do you see?
I see a low 7-April followed by a quick recovery. I see the market now turning green.
Do you agree?
If you do, follow me.
Namaste.

Solana Climbs Amid Institutional Investments and ETF Backing Solana (SOL) has climbed to $134.35, marking a 0.89% gain over the last 24 hours and an impressive 20.39% increase over the past week. Its market capitalization now stands at $69.37 billion. Although 24-hour trading volume has declined by 14.73%, settling at $3.71 billion, bullish sentiment continues to build around the asset.
Institutional interest has intensified. Real estate fintech company Janover recently added over $10 million in SOL to its treasury. With more than 163,000 SOL now under management, Janover is following a similar strategy to MicroStrategy’s Bitcoin approach — buying, staking, and holding long-term. This move reinforces growing trust in Solana’s infrastructure and staking rewards.
Support for Solana also extends to regulated investment channels. Canadian institutions have backed Solana-based ETFs, adding another layer of credibility. These developments suggest that SOL is transitioning from a speculative asset to a longer-term investment holding.
Technical Analysis
On the chart, Solana recently broke structure (BOS) to the downside, indicating a growing bearish momentum. However, price found support and bounced off after recording a low of $95. Currently, the price is trading towards a high at $147. If it breaks above the the resistance, the price could extend toward $180, with potential continuation. Alternatively, if the breakout fails, a retest of the $110 zone may follow. The volume remains moderate, signaling cautious participation.
The recent bullish activity aligns with institutional accumulation and ETF exposure. Key levels to watch include $110 as support and $147 high as near-term resistance. A sustained move, break and close above $147 may confirm the next bullish leg for Solana.

BTCUSD: 4H Golden Cross to skyrocket it to $100kBitcoin has stabilized from the strong correction earlier in the month and that is reflected on its neutral 1D technical outlook (RSI = 53.619, MACD = 70.800, ADX = 32.691). This suggests that the market has priced a bottom and since it already broke over the LH trendline, the 4H Golden Cross that was just formed today may be the trigger to resume the long term bullish trend. The bottoming pattern is a very favorable Inverted Head and Shoulders, which technically targets the 2.0 Fibonacci extension. With the 1D RSI already on a HL bullish divergence, we are buying this breakout, aiming at the 2.0 Fib extension (TP = 100,000), which is very conveniently just under the 0.786 Fib from the ATH, typically a recovery's first target.
## If you like our free content follow our profile to get more daily ideas. ##
## Comments and likes are greatly appreciated. ##
