AC Milan Fan Token, Volume SignalHere we have the "volume signal" as well as other signals that I mentioned in the ATM analysis. That is, ACMUSDT is now trading green for four consecutive weeks after a new All-Time Low and the action just recovered above its 3-Feb. low.
Good afternoon my fellow football fan, how are you feeling in this wonderful day?
This is a great chart because prices are low and the best time to buy is when a trading pair (a Cryptocurrency project) is trading low near support.
As soon as the first major low came in February 2025, the session that followed produced the highest buy volume ever. Then again in late March there is really high volume and the last four weeks volume has been good (above-average) and green. Before February 2025, the volume bars are very small, very small... With the exception of August 2022 when the All-Time High was hit followed by the strongest and longest bearish cycle in the history of this coin.
A long-term downtrend or bear market is followed by a long-term uptrend or bull market.
This is a good pair right now.
Strategy: Just buy and hold, never use a stop-loss, never, unless you are a professional trader and have been trading Crypto for 6 years or more. If you have been around for less than six years, you don't need a stop-loss. You can make more money with the strategy of buy and hold. With time you will understand. If you set a stop-loss, the whales and bots will take your money away. You just need to inject money into the market every day, every week, every month or as much as you can afford; let it grow. With time, you will be happy with the results.
Set it and forget it, that is all it takes. You just wait patiently and over time you will see how your balance appreciates. This is a young market, imagine buying Google, Apple or Microsoft when these companies were new and young. You don't want to be selling nor setting stop-loss orders on these stocks, you just wanted to buy to later retire when the inevitable happens. Or you can sell when prices are up. Never sell when prices are down.
If you don't sell at the All-Time High, there is no point in selling at the All-Time Low. Better wait, it will recover.
Thanks a lot for your continued support.
Namaste.
Crypto

Ethereum - Sell at high, take long after Sl huntEthereum - Sell at high, take long after Sl hunt
Key zone for short $1869
Key zone for long $1697 or $1581

BTC: Balancing on the EdgeBitcoin held the $90.5K level and managed to flip prior resistance into support—an encouraging development, especially given how close price was hovering to the so-called danger zone. That flip marked a technical win for bulls, signaling potential strength in the short-term structure.
However, we’re not entirely out of the woods just yet.
While price is holding above support and showing some resilience, we’re still trading uncomfortably close to the edge of the recent consolidation zone. For now, $91.5K stands as the ideal level to hold.
The concern? If price starts slipping back below this newly established support, especially with conviction, that could be a signal of deeper retracement on the table. The bullish narrative would weaken significantly if we revisit and fail to defend those levels, potentially opening the door for a more sustained correction.
So, while the short-term structure remains cautiously optimistic, this isn’t the time for complacency. The market’s still in a precarious spot, and clarity will only come with either continued strength—or a confirmed break below support.
Eyes on $91.5K for now. Hold that, and the momentum favors the bulls. Lose it, and the deeper pullback scenario comes back into play.
Trade Safe, Trade Clarity.
BTC - Golden Pocket & Strong FVG Resistance for a Short SetupThe current 15-minute chart of BTCUSDT reveals a textbook bearish setup forming as price retraces into a well-defined supply zone. This analysis focuses on structural breakdowns, liquidity engineering, and key Fibonacci confluences that may lead to a short-term reversal within intraday price action.
Overview of Market Structure:
BTCUSDT has been in a clear intraday downtrend with consistent lower highs and lower lows being formed. The recent price action reflects a temporary consolidation phase following the creation of a new swing low. This minor pullback appears to be corrective in nature, moving upward toward a previously established zone of inefficiency.
At the center of this setup is a well-marked bearish fair value gap (FVG), highlighted with a blue shaded rectangle, where institutional selling is expected to have previously occurred. This FVG formed after a strong displacement candle, suggesting unmitigated sell-side imbalance left in the market.
Retracement Zone and Fibonacci Confluence:
As price retraces upward, it enters the equilibrium region of the recent bearish impulse, with notable confluences around the 0.618 and 0.65 Fibonacci retracement levels. These retracement levels are critical markers where smart money algorithms often execute continuation plays during trending phases.
Both the 0.618 and 0.65 levels fall within the center of the FVG zone, further strengthening the case for this being a valid supply area. These levels are plotted with horizontal lines on the chart and serve as ideal zones to monitor for signs of rejection or bearish order flow resumption.
The 0.786 retracement, marked just above the upper boundary of the FVG, acts as a final extremity level. This level often coincides with liquidity pools where stop hunts are engineered before the actual move begins. Its proximity to a recent swing high makes it an area of interest for potential liquidity grabs prior to a deeper move down.
Projected Price Path and Liquidity Targets:
The projected blue path illustrates an expected liquidity sweep into the FVG zone, followed by a sharp rejection. This aligns with the idea of engineered liquidity collection before continuation in the original trend direction. The move anticipates price reaching back into the area of prior support, targeting unmitigated demand near recent lows.
Of particular interest is the area around the 0.28 Fibonacci extension level, which acts as a probable magnet for price in the event of a successful rejection. The chart structure suggests that once the short-term retracement completes, there is room for a new impulse leg lower.
Internal Structure Observation:
The current lower timeframe structure shows rising momentum toward the FVG. However, this upward push lacks aggressive bullish volume and appears corrective rather than impulsive. This suggests that buyers are likely exhausting themselves as price nears the supply zone.
Additionally, the structure within this move is developing lower-timeframe liquidity pools (equal highs and tight consolidation), which could act as inducement for a sweep before the potential reversal occurs.
Conclusion:
This chart offers a well-structured short setup based on supply zone rejection, Fibonacci confluence, and a bearish market structure. The fair value gap zone between the 0.618 and 0.65 retracement levels is key, and price action within this area will be crucial in determining the next directional leg. If bearish confirmation such as an engulfing pattern or break of market structure occurs within or after tapping this zone, it would validate the bearish outlook for a short-term continuation to the downside.
This setup is ideal for intraday traders focused on precision-based entries rooted in institutional order flow principles.

Strange XRP SignalI say it is a strange signal but not in a bad way... Give me a few minutes of your time and just let me explain, ok?
The first peak happened in early December and then right away the candles are big. As the first low is hit in early December, the candles become big and prices move up.
Then there is a second peak mid-January and the candles become super big. "Big candles" as in high volatility, enormous price swings. With the market bearish, these swings continued until 7-April.
On the chart, there is a fair recovery and some growth and then comes this very strange signal, the candles become really small. 13-April through 21-April very small candles, low volatility; prices continue to grow.
Then again, 28-April, the last peak and volatility is almost zero. Seven days XRPUSDT moves lower but there is no new lows, the price remains strong. This is a bullish signal.
When the market was bearish, prices were moving down with force. Now the market is bullish confirmed because when resistance is hit, there is no bearish force, no bearish action no bearish momentum; just consolidation before additional growth.
A strange signal but in a good way.
Hold easy, XRP will resume growing in a matter of days.
Namaste.

BTCUSD: 1H Death Cross might be dangerous but expect $100k if inBitcoin remains bullish on its 1D technical outlook (RSI = 61.614, MACD = 2557.800, ADX = 37.923) despite the correction since Friday's high. This is because the underlying pattern is a Bullish Megaphone which just bottomed. On the other hand, the 1H timeframe just formed a Death Cross. If this is invalidated and the price remains inside the Bullish Megaphone (also see that the 1H RSI is on a Bullish Divergence), we can see $100k on the next leg up (1.5 Fib extension like the 2 HH before). If the Bullish Megaphone breaks, testing the 1D MA200 at least, is veyr likely.
## If you like our free content follow our profile to get more daily ideas. ##
## Comments and likes are greatly appreciated. ##

TRUMP: Advanced Trading Strategy For 6,666% Instant ProfitsThe higher low is in and support is being confirmed now as I write this; patience is key.
It is a waiting game. This whole trading experience, venture or adventure... It is all a waiting game.
The better you get at waiting the best you can do.
You see, when the market is bland, boring and sideways this can last for a long while. When the market starts crashing or rising everything can happen within a day.
In order to catch the rise, we have to be in and ready to wait.
In order to avoid the crash, we have to set our sell orders on target before the rise takes place. Something like buying in, setting the orders high up (never stop-loss) and then waiting for the market to take care of the rest.
I know it can be boring sometimes and at other times doubt can even creep up. This is not bad nor is there anything wrong with you if this happens, this is normal but you shouldn't worry if you are ready to hold.
The market can go up slowly for 3 months and you wouldn't mind the fact that it is growing if the price moves from $10 to $13 in three months. Then on the fourth month, there is an advance from $13 to $50 and wow!
But if the market drops slowly from $10 to $7 within 3 months we start to become anxious and scared, why? Then, on the fourth month there is an advance from $7 to $50 and wow!
You see? It is all psychological you know. When the market was rising slowly, there was no difference, no secured profits and yet you didn't mind having to wait. But when the market moves lower, you might want to secure a losing trade.
Both the up and the down produce $$$ changes on paper only, nothing changes when it comes to the amount of coins you bought and hold.
If the coins are going to be worth more down the road, six months from now, say, 500% more; this should be an easy hold.
Ignore the short-term, ignore the noise hold strong.
You can do it and you are doing it, for doing this you will be paid and when you get paid you will be happy with the results.
I should give you my strategy once more: Buy and hold.
Thanks a lot for your continued support.
Bitcoin and the Altcoins market is set to grow really, really strong in the coming months.
Just be prepared to wait, it will be worth every day, every minute every second once you get your reward.
Actually, I like to wait. I can study and exercise—prepare—while the market goes through its consolidation phase. I can plan.
Once the new high—All-Time High—is in and the bullish wave is over, I will be prepared to pocket huge profits because I planning and studying today.
Thank you for reading.
Namaste.

Bitcoin Short-Term Support Zone, Buy Zone & Extreme Danger ZoneBitcoin is now trading within its main long-term 100K-200K beyond entry and buy zone. These prices are listed green on the chart.
The support zone is above $91,000 and the extreme danger zone (which won't be tested—Bitcoin is safe and strong) is $89,250.
If Bitcoin trades below $95,000 this is a major opportunity to buy and even to open LONG (lev.) positions. Any trading above $90,000 is ultra-bullish.
If Bitcoin trades at $89,250 or higher market conditions remain extremely good but this is a rare opportunity. It is likely we will not be able to enjoy these prices again but if it happens, make sure to make the best of it.
Any trading below $95,000 is a super strong buy.
Any trading above $95,000 confirms the continuation of the bullish move.
Bitcoin is neutral while the Fed decision is in. When the Fed publishes its decision, there will be some volatility followed by growth.
» Late May 2025 the entire Cryptocurrency market will be ultra-bullish. Repeat, ultra-bullish this very same month.
» Whatever you do, buy and hold and accumulate like it is the end of the world. This is truly the last chance. You've been warned.
Thanks a lot for your continued support.
You deserve the best and you are Gold!
Namaste.

ADA/USDT: Is ADA Preparing for Its Next Rally?(READ THE CAPTION)By analyzing the #Cardano (ADA) chart on the 3-day timeframe, we can see that over the past few months, the price surged from $0.33 to $1.32, delivering a gain of over 300%. After reaching its highest level in 3 years, it faced selling pressure and corrected down to $0.50.
Currently, Cardano is trading around $0.70, and if the price can hold and close above the $0.65 level, we may expect further upside in the medium term.
The next potential targets are $0.75, $0.81, $0.93, and $1.05, respectively.
Please support me with your likes and comments to motivate me to share more analysis with you and share your opinion about the possible trend of this chart with me !
Best Regards , Arman Shaban

Kaito: Easy Short-Term Trade Setup (PP: 130%)This is an easy trade setup. It is a short-term trade-idea based on the daily KAITOUSDT chart.
The chart bullish signals consist of: (1) A broken downtrend, (2) a rounded bottom and low 7-April and (3) a higher low 4-May.
After this combination of signals, today we have a full green candle and bullish wave. The higher low coupled with this candle is the continuation of the bullish move that started after the April low. Seeing that the downtrend has been broken, we can expect higher prices in the weeks and months to come.
The target on the chart is an easy target, it can go much higher of course.
Thanks a lot for your continued support.
This is how an easy trade setup looks like. Easy to spot, easy to buy easy to hold.
Namaste.

Dogs—New Entry—Buy Now! Higher Low, Easy Profits (PP: 1513%)The retrace is in for Dogs and support is found exactly at the baseline of the initial bullish reversal and bottom pattern, the Adam & Eve.
Good evening my fellow Cryptocurrency trader, I hope you are having a wonderful day.
Have you been tracking Dogs?
Are you ready to trade?
Great opportunities are developing; the Altcoins market going bullish; new entry now!
Easy profits.
This chart setup is nice easy and clean.
The chart leaves no room for doubts as to what will happen next.
Look, can you see it? There is no volume on the retrace.
Bullish, bullish, bullish... A higher low is bullish after the initial breakout.
If this doesn't make any sense, let me put it in a different way.
This Altcoin project is producing certain patterns and price dynamics that points to the development of a very strong bullish wave. This bullish wave can produce easily, very easy, 334% profits. It can go higher and hit 923% within months and even higher, 1,513% potential is open in 2025.
Can I be honest? It can go higher than what is shown on the chart.
So be ready get ready stay ready and always prepared.
Cryptocurrency is going up.
Thank you for reading.
Namaste.

Ethereum rising as we expectedEthereum rising as we expected
new long in a case of Big OI rise
Sell better to take at key zone in a case of bullish absorption

Bittensor Turns Bullish Moving Averages (Soon Above $1,100)Here Bittensor (TAOUSDT) can be seen trading safely above EMA55/89, as well as two long-term moving averages (EMA233/377):
This is a bullish bias fully confirmed.
This confirmed bullish bias will put TAOUSDT above $1,100 within 3 months, most likely. But this isn't all, there is room for additional growth. See this chart:
Overall, trading volume is good and this pair has been pretty active lately.
After the last advance, the action is happening at resistance and stays there, no significant retrace is present on the chart. When a project is weak, a challenge of resistance immediately sends prices lower. When the market is bearish, a challenge of resistance leads to a crash.
Let me give you some examples. Notice the peak March 2024, the market was bearish and the drop that follows is fast and strong, also long-term. The same is true for October and December 2024. When the market is bearish, reaching resistance leads to a very strong bearish candle.
Currently, resistance was hit 25-April but the market went sideways rather than crashing, and, yesterday, a full green candle just to keep the action as close to resistance as possible. The more a resistance level is challenged, the weaker it becomes.
» Bittensor is good, TAO is good and ready to grow. It will grow long-term for months. Up and up, more and more; over and over, again and again.
Namaste.

API3: The Perfect Short-Term Trade Setup (174% & 289% Profits)Let me explain why this is the "perfect short-term trade setup."
You know all these Altcoins we've been tracking together they hit bottom last month, 7-April. Here API3USDT hit bottom 11-March 2025 and produced a very strong reaction. It is as if buyers were really ready to rock this one-up.
The initial bullish breakout went into retrace which is normal and this retrace ended in a higher low. So 9-April we have a higher low rather than a lower low and this support zone was found above the 3-Feb. low. Which is the session with the long lower shadow on the left.
So API3USDT went sideways after the April low—consolidation—and is now turning green. Any bullish action can result in a strong bullish jump. This is why this is the perfect chart setup. The strong reaction in March shows that interest is big for this pair. The higher low in April shows that support has been established and confirmed. Current price action opens the door for an advance any day.
The trick is to be patient. Even though it is a perfect chart setup for the short-term it can always take time before the market decides to move. Sometimes, people find a chart like this one and buy up. Prices start to grow naturally but the bots suppress the growth. Excitement dies down and people sell at a loss, but, suppression doesn't mean the end. If you wait patiently after the rush and buy FOMO crow gets out, the pair will still grow anyway. So we buy and hold and let the market take care of the rest. If you are ready to wait 1 week, prepare to wait for 1-2 months. It might sound like a lot but it is good money when you sell high after buying low. The alternative is pocketing a loss and that's a big no-no! It is better to wait and let it ride because the easiest way to win with Crypto is by knowing that the market is wild.
It can produce strong swings, it is volatile, it can shake, but, if you hold while you wait strong, profits can be great. No other market pays as much as the Cryptocurrency market, but you have to be able to detach and ignore the inevitable drops that happen. Yes prices drop, but they recover and then the recovery translates into growth. We are now facing the strongest growth phase in many years.
Thanks a lot for your support.
Namaste.

Notcoin—New Entry —Buy Now! Stop-Loss Trading ExplainedThe market always offers a second chance... Always.
Here Notcoin (NOTUSDT) encountered a rejection at "final resistance" and is now trading above support with a very nice higher low. This is a perfect place, a perfect zone to go LONG, accumulate buy and hold.
When the market is red or trading near support, or both, that's the time to buy.
Notice the retrace, after the steps pattern, the nice rise and then Notcoin found resistance. Five days challenging resistance and then a drop. This drop has been going for four days today. Total 9 days of not growing action which will lead to the resumption of the initial bullish wave.
In short, Notcoin will continue growing and is set to grow. The small drop is what we technical market analyst call short-term noise. Another thing we love to say is to ignore noise at all cost, and to never use a stop-loss because this can weaken your long-term earnings potential as well as result in selling when it is not right to do so. The strategy is to buy and hold because prices will climb so high so fast so soon, that you don't want to be caught selling lower than what you bought.
A stop-loss is simply a sell order but you place the order below your entry point. This makes no sense. When you buy, you can set up a sell order right away but it must be above your entry price. If you buy at 100, set a sell order at 200 or 300, for example. If you buy at 100 and set a sell order at 80 what do you think will happen? The bots will see this order and sell just because you are committed to sell something you bought at 100 for 80, a 20% loss. Instead, when you buy, always make sure to place your sell orders very high up... Very high. In this way, the bots will have to also buy in order to meet your sell requirement... And that's how your money grows.
Thank you for reading.
Namaste.

BTC/USDT 1H Chart: Channel Breakdown Alert!Hey Bitcoin traders! Let’s dive into this 1-hour BTC/USDT chart. Bitcoin has made a decisive move, and it’s not looking good for the bulls!
BTC was trading within a well-defined ascending channel, with key levels at $95,800 (upper resistance) and $88,000 (last higher high). The price recently tested the support around $95,800 but failed to rebound, and now it’s crashed below the channel’s support, currently sitting at $94,300. This breakdown signals potential bearish momentum!
The next critical support to watch is $92,000, and if that fails, we could see BTC slide toward the previous resistance at $84,400. On the flip side, a recovery above $93,000 might bring some relief, with resistance at $98,000 and a potential retest of $100,000.
Key Levels to Watch:
Resistance: $95,800, $98,000
Support: $92,000
Breakdown Target: $86,000
Recovery Target: $98,000+
The bears are in control — where do you think BTC is headed next? Let’s hear your thoughts below!

Doge H4 | Overlap support at 38.2% Fibonacci retracementDoge (DOGE/USD) is falling towards an overlap support and could potentially bounce off this level to climb higher.
Buy entry is at 0.1667 which is an overlap support that aligns close to the 38.2% Fibonacci retracement.
Stop loss is at 0.1460 which is a level that lies underneath an overlap support and the 61.8% Fibonacci retracement.
Take profit is at 0.2028 which is a swing-high resistance.
High Risk Investment Warning
Trading Forex/CFDs on margin carries a high level of risk and may not be suitable for all investors. Leverage can work against you.
Stratos Markets Limited (tradu.com):
CFDs are complex instruments and come with a high risk of losing money rapidly due to leverage. 63% of retail investor accounts lose money when trading CFDs with this provider. You should consider whether you understand how CFDs work and whether you can afford to take the high risk of losing your money.
Stratos Europe Ltd (tradu.com):
CFDs are complex instruments and come with a high risk of losing money rapidly due to leverage. 63% of retail investor accounts lose money when trading CFDs with this provider. You should consider whether you understand how CFDs work and whether you can afford to take the high risk of losing your money.
Stratos Global LLC (tradu.com):
Losses can exceed deposits.
Please be advised that the information presented on TradingView is provided to Tradu (‘Company’, ‘we’) by a third-party provider (‘TFA Global Pte Ltd’). Please be reminded that you are solely responsible for the trading decisions on your account. There is a very high degree of risk involved in trading. Any information and/or content is intended entirely for research, educational and informational purposes only and does not constitute investment or consultation advice or investment strategy. The information is not tailored to the investment needs of any specific person and therefore does not involve a consideration of any of the investment objectives, financial situation or needs of any viewer that may receive it. Kindly also note that past performance is not a reliable indicator of future results. Actual results may differ materially from those anticipated in forward-looking or past performance statements. We assume no liability as to the accuracy or completeness of any of the information and/or content provided herein and the Company cannot be held responsible for any omission, mistake nor for any loss or damage including without limitation to any loss of profit which may arise from reliance on any information supplied by TFA Global Pte Ltd.
The speaker(s) is neither an employee, agent nor representative of Tradu and is therefore acting independently. The opinions given are their own, constitute general market commentary, and do not constitute the opinion or advice of Tradu or any form of personal or investment advice. Tradu neither endorses nor guarantees offerings of third-party speakers, nor is Tradu responsible for the content, veracity or opinions of third-party speakers, presenters or participants.

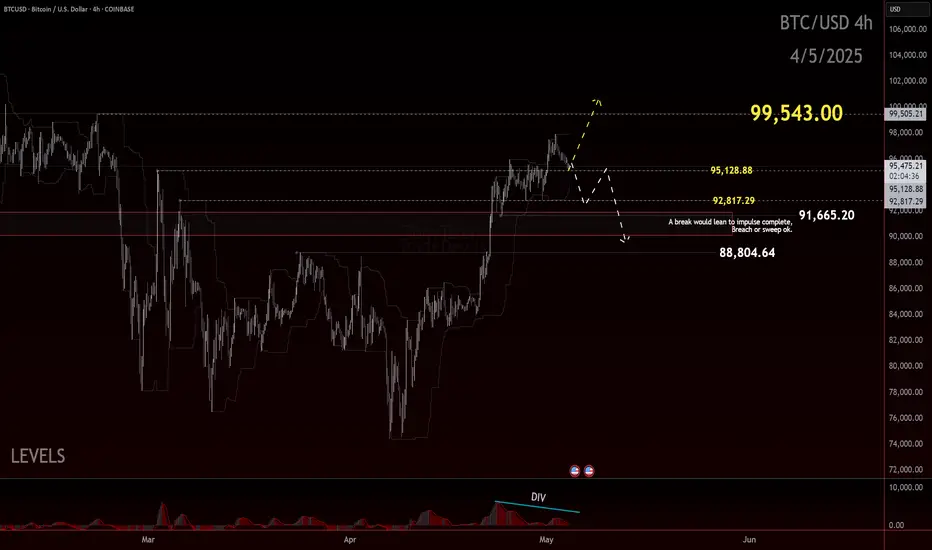
Bitcoin H4 | Potential bullish bounceBitcoin (BTC/USD) is falling towards a swing-low support and could potentially bounce off this level to climb higher.
Buy entry is at 91,933.60 which is a swing-low support that aligns close to the 23.6% Fibonacci retracement.
Stop loss is at 87,400.00 which is a level that lies underneath a pullback support.
Take profit is at 99,342.60 which is a swing-high resistance.
High Risk Investment Warning
Trading Forex/CFDs on margin carries a high level of risk and may not be suitable for all investors. Leverage can work against you.
Stratos Markets Limited (tradu.com):
CFDs are complex instruments and come with a high risk of losing money rapidly due to leverage. 63% of retail investor accounts lose money when trading CFDs with this provider. You should consider whether you understand how CFDs work and whether you can afford to take the high risk of losing your money.
Stratos Europe Ltd (tradu.com):
CFDs are complex instruments and come with a high risk of losing money rapidly due to leverage. 63% of retail investor accounts lose money when trading CFDs with this provider. You should consider whether you understand how CFDs work and whether you can afford to take the high risk of losing your money.
Stratos Global LLC (tradu.com):
Losses can exceed deposits.
Please be advised that the information presented on TradingView is provided to Tradu (‘Company’, ‘we’) by a third-party provider (‘TFA Global Pte Ltd’). Please be reminded that you are solely responsible for the trading decisions on your account. There is a very high degree of risk involved in trading. Any information and/or content is intended entirely for research, educational and informational purposes only and does not constitute investment or consultation advice or investment strategy. The information is not tailored to the investment needs of any specific person and therefore does not involve a consideration of any of the investment objectives, financial situation or needs of any viewer that may receive it. Kindly also note that past performance is not a reliable indicator of future results. Actual results may differ materially from those anticipated in forward-looking or past performance statements. We assume no liability as to the accuracy or completeness of any of the information and/or content provided herein and the Company cannot be held responsible for any omission, mistake nor for any loss or damage including without limitation to any loss of profit which may arise from reliance on any information supplied by TFA Global Pte Ltd.
The speaker(s) is neither an employee, agent nor representative of Tradu and is therefore acting independently. The opinions given are their own, constitute general market commentary, and do not constitute the opinion or advice of Tradu or any form of personal or investment advice. Tradu neither endorses nor guarantees offerings of third-party speakers, nor is Tradu responsible for the content, veracity or opinions of third-party speakers, presenters or participants.

Is the CGPT Retest a Setup-Are You Ready for It?Yello, Paradisers! Have you been watching CGPT closely? Because what we’re seeing now could be a textbook setup to liquidate early longs before a brutal downward move. This is the exact type of trap that punishes undisciplined traders and rewards those who wait.
💎After weeks of bullish momentum with clean higher highs and higher lows, #CGPTUSDT has now printed a clear change of character (CHoCH). The previous low was taken out, and now price has pulled back right into a high-probability resistance zone. This zone, between $0.115 and $0.118, aligns perfectly with a broken ascending trendline adding confluence that strengthens our bearish bias. Traders who aren't careful might interpret this retest as a sign of strength, but this could just be the market setting up its next liquidation wave.
💎Adding even more weight to this bearish thesis is the fact that #CGPT is currently trading below its 50 EMA on the 4H timeframe, showing clear weakness and confirming that the short-term momentum has already shifted in favor of sellers. This acts as dynamic resistance and makes it even harder for price to reclaim bullish control without a significant effort from buyers.
💎The structure is showing all signs of a classic trap. Price action is hesitant at resistance, and with momentum waning, a rejection from this level could spark a swift move down toward $0.09188, our first support zone. But that may not be the end of it. If selling accelerates, we are eyeing the $0.07133 area as a potential major demand zoneour strong support and where true smart money will likely accumulate. However, we must always remain tactical. If CGPTUSDT flips above $0.12526, this bearish scenario is invalidated and we would reassess for possible bullish continuation.
Discipline, patience, robust strategies, and trading tactics are the only ways you can make it long-term in this market.
MyCryptoParadise
iFeel the success🌴

Verasity: Your Altcoin Choice (S2)I will do a new Top Altcoins Choice session next week so if you missed the previous two sessions you can participate in the next one. You can choose any Cryptocurrency project you want and I will publish an analysis for you.
Today we are looking at Verasity (VRAUSDT) on the daily timeframe. It has a standard chart for a Tether (USDT) trading pair.
Volume started to grow in November 2024 and remained high.
Bullish volume is high in relation to bearish volume as VRAUSDT hit a major low. The correction bottom.
High volume was present 10-March and 7-April. Two decisive points and both ended green. A reversal comes next.
There is a downtrend and this downtrend has been compromised, it is no longer safe.
It has been broken and there is an initial bullish breakout, the retrace led to the test of the descending trendline, once resistance, as support. This is classic trend reversal behavior. The first reaction is always corrected into a higher low before additional growth.
This is the start of a major bullish phase. Verasity hit the lowest price since early 2021. There can be growth for months or even years. This is as good as it gets if you are a buyer, prices will not go lower. This is the best time to enter if you are considering a LONG (Bullish) trade.
Thank you for your support, I am wishing you the best.
Namaste.

BITCOIN Support Ahead! Buy!
Hello,Traders!
BITCOIN is trading in an
Uptrend but is making a
Local bearish correction
However, a horizontal
Support level is ahead
Around 92,191$ so after
The retest we will be expecting
A local bullish rebound
And a move up
Buy!
Comment and subscribe to help us grow!
Check out other forecasts below too!
Disclosure: I am part of Trade Nation's Influencer program and receive a monthly fee for using their TradingView charts in my analysis.

Bitcoin Confirms Breakout — Bullish Trend Gains StrengthStair-Stepping Uptrend:
Bitcoin has confirmed a breakout above the critical $88,000–$90,000 resistance zone, forming a classic pattern of higher lows and higher highs. This technical structure signals a decisive shift in market sentiment.
Momentum Builds:
The breakout marks a clear resurgence in bullish momentum after months of consolidation following January’s highs. It suggests that the market is regaining strength and preparing for a sustained move upward.
Key Support Level:
As long as Bitcoin holds above $92,000, the bullish structure remains valid. This level now acts as a critical threshold for traders to manage risk and assess continuation.
Outlook:
With the trend now clearly favoring the bulls, Bitcoin is well-positioned for further upside in the near term. Continued strength could open the door to retesting previous all-time highs and potentially reaching new ones.
#Bitcoin #BTC #Crypto #Breakout #TechnicalAnalysis #BullishTrend #CryptoMarket #SupportAndResistance #MarketUpdate #PriceAction

Why Ethereum Could 10x in the Next Few Years🚀
1. Ethereum ETF Approval
ETFs are approved in the U.S. (similar to the Bitcoin ETFs in early 2024), institutional money will flood in.
Grayscale, BlackRock, and others have already filed.
Ethereum’s price jumped significantly after similar events in the past.
2. Deflationary Supply (Post-EIP-1559)
Since EIP-1559, ETH has been burned with every transaction.
Combined with Proof-of-Stake (The Merge), ETH is now net deflationary during periods of high network activity.
3. Layer 2 Ecosystem Is Exploding
Rollups (Arbitrum, Optimism, Base, zkSync) are scaling Ethereum.
These L2s settle on Ethereum L1, driving fees and activity.
Vitalik’s "rollup-centric roadmap" is playing out — this benefits ETH long-term.
4. Real Yield from Staking
Ethereum now offers a real, sustainable yield from staking (~3–5%).
Institutions love yield. ETH becomes more like a productive asset, not just a speculative token.
5. Ethereum as the Base Layer of Web3
DeFi, NFTs, gaming, DAOs — Ethereum is still the dominant smart contract platform.
The most secure, battle-tested, and widely adopted chain.
Developers and enterprises continue to build on Ethereum over competitors.
6. Macro Tailwinds
As the U.S. moves toward looser monetary policy, risk assets (including crypto) historically benefit.
Crypto adoption is growing globally — from Latin America to Asia — and Ethereum is often the entry point.
