Toncoin: Resistance Turned Support —The Internet 2.0Here we have a classic dynamic within the Cryptocurrency market. A resistance level once conquered, becomes a support level when a pair enters a correction.
In December 2022 Toncoin peaked after finding resistance. This level turned out to be a strong resistance and remained valid for more than a year. There were several failed attempts to break this level in late 2023 and in February 2024. Finally, it was conquered in March 2024 with the start of a major bullish jump... Things change.
After a bullish wave invariably a correction develops. How far down will prices go?
A previous strong resistance can work as a strong support. This support zone has now been activated in 2025 and it holds. This is a very important zone and can be used to buy and accumulate.
Whenever TONUSDT trades on the orange zone on the chart, buyers should buy and can buy, this zone can never break. This price range worked as resistance for an entire year and three months, in reverse, it will stop a drop on its track and can be the launchpad for the next bull market phase.
This is it. Support has been found.
Notice the strong rise in buy volume in March 2025, right when this support zone is hit/activated. Notice the super high bearish volume afterward, yet Toncoin remains trading within a higher low.
This is it, that's the signal. The low is in.
The next move will be up and up we go.
I hope you find this article in good timing.
Good entry timing. Great prices.
The time is right and the time is ripe.
Crypto is about to explode. The biggest explosion in the history of finance.
The evolution of money.
The Internet 2.0.
Namaste.
Crypto

Starts Late, Ends Late: 2026 Bull Market?Market conditions are so different now. Everything is changing fast and radically, it has to do with the stars. The way the stars are aligned now has not happened in hundreds of years. The type changes we are seeing now have not happened in hundreds of years.
It is not only the financial markets but the whole world and the way we perceive reality is changing in so many ways. This is certain to have its effect on the Cryptocurrency market, the effect is already present and tangible, market conditions (reality) will never be the same.
The bull market is starting late. By this date in 2021, everything was up and up really strong. Some pairs had already peaked, literally, some altcoin trading pairs had already peaked by April 2021. The full cycle complete. Thousands of percentages of points of growth.
What about now? It is April 2025 and the bottom is in on many pairs. Only last week, 7-April, we had a marketwide bottom. The start of the 2025 bull market cycle and phase. A late start can translate into a late end.
Now, a full bullish cycle can be completed in 6 months. This is not necessary nor required. Also, the market is much bigger now, it wouldn't be feasible, there would be too much rush.
Think of the market as an entity that wants to survive, thrive, live and grow. Can it go through years of bearish action and only produce several months of growth? Balance is needed. The market needs a bullish cycle to keep the participants engaged or else everybody will quit forever if there is nothing to gain.
The fact that the Altcoins market hit bottom is the most bullish signal there is, but, looking at all these charts, hundreds of charts, something tells me that what is coming will be different to the past. Actually, it will be similar because the last bull market happened from March 2020 through late 2021. So we can have a bull market from April 2025 until some time in 2026. I just don't believe that everything will end too fast, within six months, because we are having a late start. It will be the other way around, the bull market will extend.
Instead of Cryptocurrency growing for 1 year, we might get continued growth for 2-3 years straight, maybe more for some pairs. Some pairs have been dropping for 4 years while others have been down for 6 years or more. When things change, these pairs will be experiencing sustained long-term growth.
Other pairs grew strong and never moved below support. These pair were supposed to drop according to classic past patterns and yet, they all remained strong and ready for more. This bull market will be out of the ordinary. Everything that is happening right now in finance and politics is not the same as always, it is a true generational change.
We are going through a phase of evolution and this is what will cause the bull market to extend. Late start, late end.
Namaste.

Why Gold bullish ?? Detailed AnalysisXAUUSD is currently showing strong bullish momentum after completing a clean retest of the breakout zone near 3200. Price action confirmed this level as new support, and we are now seeing price bounce back with conviction. This structure is a classic continuation setup, and as long as price holds above the retest zone, the next leg higher toward the 3265–3300 range looks highly probable.
Technically, the 8H chart displays a strong impulse move followed by a controlled pullback into a demand zone. Price formed a higher low and immediately pushed back into bullish structure, signaling continuation. If gold stays above the 3200–3180 level, I expect buyers to maintain control, and the market could drive further upside targeting the previous swing high and beyond. The rejection wicks and volume spike at the base of the retest add to the bullish conviction.
From a fundamental standpoint, gold continues to benefit from a combination of factors including global uncertainty, persistent inflation, and dovish sentiment from major central banks. With US inflation data keeping rate cut expectations alive and the dollar softening slightly, gold remains a preferred hedge. Additionally, increased demand from central banks and institutions continues to support gold's long-term uptrend.
This setup is one of the most closely watched on TradingView right now due to its clean structure and strong confluence. With macro and technical conditions aligned, this bounce off support could lead to another wave of bullish momentum. As a professional trader, I’m staying long-biased above 3180 and will look for momentum confirmation to scale into the next bullish wave.

Phala Network 2,400% Profits Potential Target & 2025 Bull MarketThe steepest decline ever for Phala Network just happened between late December '24 and April 2025. This was a really strong correction and broke two long-term support levels, August 2024 and August 2023, just to recover the next week.
This drop activated the market's All-Time Low. A price that was hit once only in October 2022. This same support level was activated only briefly with a higher low. The low back then happened at 0.0700 and the higher low this month at 0.0753. Buyers were ready almost at the lowest possible point. A long-term double bottom.
The last time this low price was hit the reaction was a super strong rise. PHAUSDT rose more than 600% the same week that it produced its All-Time Low. The high produced was only challenged again in December 2024, it broke by 10 cents. Back then the peak happened at 0.5000 (October 2022), in December 2024 the peak happened at 0.6000. This small difference makes a huge difference for the upcoming bull market bull-run, it is good news.
Another positive signal for this pair comes from the session close. Back in October 2022, the session that hit 0.5000 on a wick ended up closing at 0.2148. This time, the December 2024 peak at 0.6000 ended up with a close at 0.4919, a huge difference, more than 100%. This is a signal of strength and good news for the upcoming bull market.
The bulls were testing the waters and removing a very strong resistance point. This was a success. The market went through a full flush and is ready to grow again. Phala Network can hit a new All-Time High this year based on these simple signals, so be prepared.
An entry now and a long-term hold can produce a nice and easy 300% in the coming weeks or months. By late 2025, profits can amount to 1,350% or even 2,400%, all these targets can be seen mapped on the chart.
This is another good pair. The chart looks strong and the action went through a full reset. Bottom prices are present today. A huge discount. The best possible timing. This is your chance.
Thank you for reading.
Namaste.

Bitcoin: Normal Bullish vs Super Bullish +Altcoins Market UpdateBitcoin is bullish right now but not super-bullish. What needs to happen for Bitcoin to turn super-bullish is the question that I am getting through email from my most ardent followers. Why this question?
Some people don't like to take much risk. They are ok with some risk but not big risk. Buying early can produce great profits if things turn out ok, but it can also produce huge losses if the market makes a surprise rejection and turns the other way.
People like us like to catch the bottom but this comes with the risk of getting whipsaw. There can be several drops at the lows before a bearish wave ends. Without the proper risk management, position management, trying to catch the bottom can result in loses. Easy to see and understand.
Bitcoin is normal bullish above $80,000. Bitcoin is strongly bullish above $85,000.
This is still a great buy because Bitcoin is trading below $90,000. Anything below $100,000 is great for the long-term. Now, for Bitcoin to turn super-bullish we need a break and close above $88,700 on the daily timeframe. Give or take two days above this level to add strength. A stronger confirmation comes with the weekly close. If you want Bitcoin super-bullish, get it when the $88,000 resistance is gone.
To me, Bitcoin is already bullish confirmed. The correction is over and has been over for an entire week. This is only the start. Slow and steady growth. Bullish momentum will grow. Maximum speed will start in May 2025, late, and then up, up and up. It will be a long ride and it is likely to extend.
» Altcoins Market Update
The Altcoins market is great right now. Some pairs are finally starting to break bullish and moving above resistance. Support has been confirmed for weeks and in some cases for months. But there was been some sideways on the low but now bullish action is starting to show up. This is just the start. In a matter of days, some pairs will be growing between 30-80% in a single day. Once these move, they tend to retrace a little bit before additional growth. Do not try to catch those, it is a futile effort. Look now for the ones trading low with good signals and charts then buy and hold. You will do great.
Right now a diversification strategy can work wonders because there just too many pairs. The market will take a long time to grow. The market will take a while to unravel.
In the past, long gone past, 2016 and so on, the market would alternate between pairs every few months. As the market grew, the period between each bullish wave continued to extend, while in the past we would see strong action every few months, now it happens only once or twice per year. As the market grows, it takes longer and longer for money to move around and reach every sector. This bull market will be long.
It is likely that this bull market will extend because of so many pairs. There is not enough time to lift everything up in just 6 months. This is good news, it would be better to have a 2-3 years strong-long bull market rather than 6 months. The longer it last, the more time we have to adapt, learn and grow.
Since it is inevitable to make mistakes, the longer the bull market lasts, the more chances we will have to apply everything that we learn live every day. It will be great.
It is confirmed, everything will grow. By everything I mean the biggest portion of the market, choose wisely because a pair can start growing tomorrow while another one can start growing within 5-6 months. Both go up, but one do so in early 2025 while another one can grow in late 2025. Which one are you holding? Diversification right now is a strong move across the Altcoins. When Bitcoin grows 20%, some Altcoins will grow by 300%. Strong projects can grow between 80-150%.
There are many ways to approach the market. Do what works for you. I am wishing you success.
Thank you for reading.
Consider hitting boost and leaving a comment if you enjoy the content.
Namaste.

Based on the BTC/USDT 4-hour chart:Current Price Levels: Bitcoin is currently trading around 85,269.35 USDT.
Support and Resistance:
Support Zones: A crucial support zone marked in green suggests strong buying interest between 80,000 and 81,000 USDT.
Resistance: The upper trend line indicates resistance; if Bitcoin can break it, it could target levels close to 88,000 USDT.
Bullish Case: A breakout above the upper trend line could lead to an upward rally towards 88,000 USDT or above.
Bearish Case: If the price breaks below the support zone, a downward move toward 75,000 USDT can be expected.
Monitor the trade closely to see how it reacts around these crucial levels. Based on the price action, adjust your strategy accordingly. Feel free to ask if you have further questions or need analysis on specific indicators!
If you found this analysis helpful, hit the Like button and share your thoughts or questions in the comments below. Your feedback matters!
Thanks for your support!
DYOR. NFA

COTI 975% vs BTC TargetCan you believe COTI grew 23X against Bitcoin? It did, it happened between November 2019 and September 2021, while at the same time Bitcoin was growing...
Good afternoon my fellow Cryptocurrency trader, I hope you are having a wonderful day.
I have some targets ready for you and the Altcoins market is about to go Boom!
COTIBTC just activated the longest ever support. Actually, we have a new All-Time Low. The last ATL happened in November 2019 at 70 sats. The new low happened in February 2025 at 61 sats. The interesting and bullish part is the fact that COTIBTC is now trading back above its 2019 low. Current price at the time of writing is 75, with a local higher low and green candles. Bullish signals for sure.
How much this pair can grow is hard to tell because the last bull market happened so long ago. I can say easily though that this pair is ready to grow. It can take a few weeks for the bullish momentum to build up; once it starts going, it will go until the cycle top.
Two targets can be seen mapped on the chart.
Thanks a lot for your continued support.
Namaste.

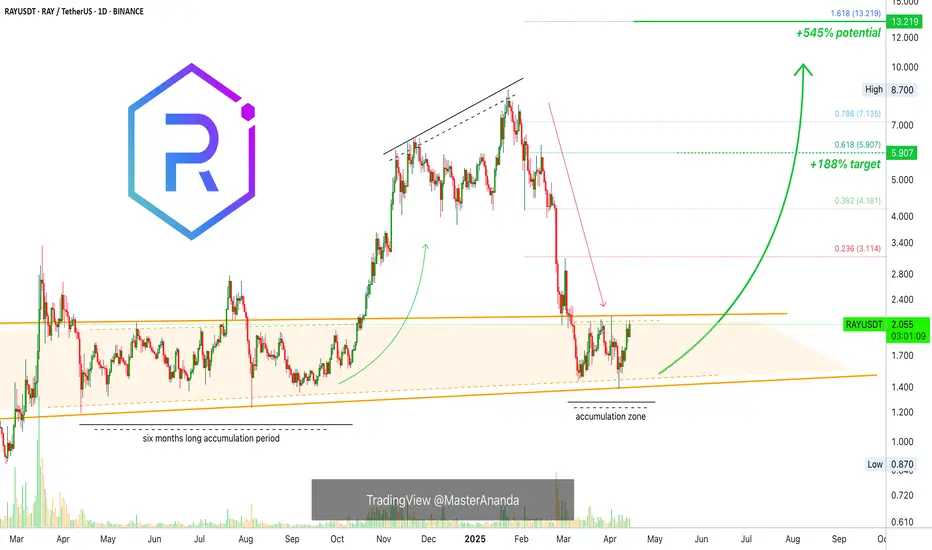
Raydium Medium Sized +545% Wave Mapped (Trading Strategy)This is one of those pairs that grew in astonishing ways since late 2023. Raydium managed to grow by 5,372% from October 2023 through January 2025. Simply amazing. I was very surprised when I found this pair as it moved beyond all expectations.
The last advance was preceded by a six months long consolidation phase. The whales used this period to accumulate. When one phase is long, the next one is short. This means that RAYUSDT can start to grow soon. This is based on the law of alternation.
Needless to say, the chart is full of higher lows and the action continues to be strong. I am tempted to open some LONGs.
This is a solid trade setup. It has low risk vs a high potential for reward.
This one can turnout into something good but please keep in mind that we have a little over two weeks before the market becomes full time bullish. Right now it is still early for the upcoming bullish wave. The reason I am all in now is because my group likes to enter early. Some other people prefer waiting and confirmation. We like early because it allows for maximum profits potential. The risk is higher but also the reward.
If you are uncertain or have doubts, you can always wait. The thing about Crypto is that when it moves it does so strongly, by the time we have confirmation the market is always several levels up. It can make a huge difference.
How you approach the market depends on your trading style, your risk tolerance, your capital, your goals. If you want to get in and get out, it is wise to wait until the action is hot. If you want relaxation, peace of mind and easy profits, it is better to buy and hold. If you have lots of time and energy to invest in this game, you can use all the different methods at the same time; a stack for long-term, a stack for passive hold, a stack for short-term and another portion of your capital for leveraged trades. It is also smart to leave some funds behind because good opportunities come out of nowhere. If we have funds available just because, we might end up with something that does better than our best choice.
It is a big game. It can be entertaining and profitable. There is lots to learn as well. You cannot hide here, if your ego is too strong, you will see the results in your funds. If you cheat yourself, if you lie to yourself, you will know it because your money will be gone. If you are honest with yourself and accept your mistakes, the market will give you as much as you can take.
Namaste.
ETHUSD: Prepare to buy if this trendline breaks.Ethereum remains bearish on its 1D technical outlook (RSI = 41.779, MACD = -115.050, ADX = 39.213) despite an encouraging start to the day as the 4 month Channel Down is intact. The 1D RSI is supported and is trading sideways and ETH itself is back to historic buy levels. We are willing to buy only after a break over the 1D MA50 validates the trend change technically. If that happens we will aim for the 2.0 Fibonacci extension (TP = 2,800). You can use as an extra validation condition a potential break of the 1D RSI above the R1 level.
## If you like our free content follow our profile to get more daily ideas. ##
## Comments and likes are greatly appreciated. ##

BITCOIN (BTCUSD): More Growth is Coming
Bitcoin is positioned very bullish after a confirmed breakout
of a minor daily horizontal resistance.
We see a positive reaction after its retest.
I think that the price may reach 87450 level soon.
❤️Please, support my work with like, thank you!❤️

UNI — Time to Accumulate? A Clean Long-Term SetupUNI is the native token of the Uniswap DEX — and it's finally back in our interest zone.
After a brutal 70% correction from previous highs, price has retraced into a key accumulation range between $3.60 – $6.76.
This isn’t just another alt — UNI is a fundamental token that arguably deserves a place in every long-term portfolio.
Spot entry around $5.50 looks reasonable, with higher timeframe targets at $10.35, $17.03, and $19.47.
No overtrading here — just a clean long-term thesis. Accumulate, sit back, and let the narrative unfold.
More thoughts in my profile @93balaclava
Personally I trade on a platform that offers low fees and strong execution. DM me if you're interested.

Pepe: Not Financial Advice—Opportunity, Learning & EntertainmentWe reached the point of no return. Mentioning the easy, secure and certain 245% on the Vechain chart got me thinking; this is the real deal, it can be life changing for those who take action and with the opportunity to take action. Are you listening to me? This is it!
This is all done for your entertainment, but this information can change your life in a positive way. This is all done for learning purposes only, the content, but you can make huge money if you decide to trade. Of course, money can also be lost but that is if you approach the market with a skewed mindset and unprepared.
I am not sharing financial advice, I am only telling you my opinion. I believe that timing is great. You should take this opportunity if you have the ability to do so. I understand, not all of us can buy and benefit from this situation and those that can't are excused. But what about you? Do whatever it takes and join the ride. It will be great. No leverage, no margin, no risk. With spot trading, the worst case scenario turns into a long-term wait. With reputable projects/pairs, there is no going wrong. The market is trading at bottom prices and will soon grow.
People that are advanced in their lives; stable relationship, control of their emotions, good habits; fresh air, healthy food, can take the time to study how margin works. Put leverage on your trades and boom! I don't need to say anymore.
PEPEUSDT. This channel's low happened in April 2024. Two main highs and two main lows.
The current pattern, the short-term higher low depicted on the chart, can launch the next bullish wave. I sense some weakness, there can be one final shake on this pair. If you are trading spot, this is irrelevant because the market will eventually grow. If you are using leverage, you should be prepared for all scenarios and know that some trades can be lost. That's it.
The numbers are huge on this one. I am seeing 480% and almost 800% on the 2.618. These are good. Whatever you do is up to you. Take responsibility for your actions, do not blame others for your mistakes. I am sharing charts but the market will continue to fluctuate. I can make a prediction and this prediction goes wrong, but it is you who decide which pair to buy and hold. I can make another prediction and this one does great, still, it is your choice if you bought the winning or losing pair.
If you cannot accept the responsibility for your own actions, do not trade. Stop reading now. This is not financial advice. I am sharing my opinion and reading charts for your personal growth, learning and entertainment.
Namaste.

Decentraland: Success In 2025 & BeyondRemember the linear chart. When the action goes flat and the candles become very small, sometimes almost invisible, it means that the current sideways period is reaching its end.
After a bear market there is a long-term consolidation phase and then the next bull market. The long-term consolidation phase for Decentraland is reaching its end and we are about to enter the 2025 bull market. Expect maximum growth.
Here is the linear chart, it shows a perspective with which we can easily appreciate the fact that MANAUSDT is trading at bottom prices. Truly bottom, very low. The best time to buy; when prices are low.
Then we can consider the logarithmic chart. Decentraland grew 45,300%+ between 2020 and 2021.
With this little exercise we cleared up two things: (1) bottom prices and (2) huge potential for growth. Cryptocurrency is the best financial market in the world.
So this pair is good and recently pierced the sideways channel which is a strong buy opportunity, but this never last long. The action is back above but it is still early, because the action is happening near support.
The rest is up to you. This is a friendly reminder. Great timing. No complexities, an easy trade. Buy and hold. Wait patiently and then comeback to collect your check.
There is no need to try and catch the market within a bullish wave. When one pair starts moving, there is always one that is yet to grow. Instead of chasing the ones that already broke out, look for the ones that are still to make their first move, buy them and hold. This strategy leads to success. If you chase a pair, it means you have no plan and the moment you buy it drops and this will push you to sell at a loss and find another pair.
Since it takes many months for a full bullish wave to develop, there is no need to buy something just because it is going up today. Since it can take years for prices to grow, just look for the ones that look best, with the highest probability of high gains, low risk.
Plan ahead and if you don't know what to do, just follow me.
If you don't know what to choose, read these charts that I share everyday. There is no need to rush. Once you read daily what I have to say, you will get used to the market and your choice will make itself present.
There are many of us and not everybody should buy the same. What works for you might not work for me and vice versa. That's why time is needed, invest in yourself. When you take the time to read and study, you will know exactly which pair to buy and hold. Take your time, opportunities are endless when it comes to Crypto.
Thanks a lot for your continued support.
Take your time but do not become complacent. Read everything, be prepared.
It is a small price to pay. Dedicate some time to the market and the market will bless you, with profits.
Namaste.

Price Action: Bitcoin BTC Monday 4/14/2025In this video, we are looking into Bitcoins Price Action on Daily Chart throughout the week as it approaches previous levels of resistance on its move towards 85k -88k mark.

Vechain, 20X, 30X Or 100X In 2025?Vechain stopped dropping in June 2023, that's the market bottom. Ever since it has been producing higher highs and higher lows. This is one of the strong pairs and the last correction already ended, last week.
The low prices in late 2024 launched a bullish wave and this bullish wave was corrected by more than 100%. This is a full flush. A full flush is always great news for bulls and buyers, because it allows for maximum growth.
The previous high is an easy and certain target which equal to about 245%. This is very easy and ultra-high probability because this level was already hit in the last wave. If VETUSDT can find buyers at a higher price, now that the correction went beyond 100% even more buyers will show up.
But 245% is only short-term and being super conservative, this pairs chart points to a new All-Time High. This is because of the chart structure, the fact that the bottom happened in 2023 and in this April 2025 we have a long-term higher low. The weaker pairs are producing new All-Time Lows now. The stronger pairs are producing higher lows. The higher low means that holders/traders/participants are not ready to part with their coins. They are simply not willing to sell and this is why the price remains strong in comparison to other pairs.
These same participants will work as the base for maximum growth in this newly developing bullish phase. The 2025 bull market, make no mistakes.
This is no usual bullish jump, no relief rally nor "initial bullish breakout" as I love to say. This is it, we are entering price dynamics similar to 2021 or better. A major bullish wave.
See here how the market performed in 2021:
Of course, it is not that the market will necessarily grow by 17,000%. I am just saying, 245% is easy, it will be a very strong bullish wave.
The top can be hit at 10X, 20X or 30X (Can be 100X for all we know)... Allow for strong variations. Regardless of the final outcome, you will be very happy with the results. It will be great.
Namaste.

SUI: Into the Trap — or Out of It?Looks like smart money just left breadcrumbs. We’ve got a clean structure break followed by a classic Fair Value Gap — price wicked into it and held. This kind of move often signals reaccumulation before expansion.
If this is a trap, it's beautifully laid. If it's a setup — it's surgical.
Expecting a bounce from the FVG zone back toward the recent highs around 2.36.
Entry: $2.21-2.23
Stop-loss: $2.19
Target: $2.36
Risk/Reward: 2.89
More thoughts in my profile @93balaclava
Personally I trade on a platform that offers low fees and strong execution. DM me if you're interested.

Triple Tap, Then Boom: ETH Breakout Brewing?We're looking at a classic ascending triangle setup on ETH. Price has tapped the resistance zone around $1676 three times already — the next attempt could lead to a breakout. Market structure is clean: higher lows with strong bullish momentum squeezing price toward the horizontal resistance.
This pattern usually ends with a strong impulse up, and considering the overall sentiment, this could be the beginning of a new local rally.
Entry: $1630-1650
SL: $1582
TP: $1820
Risk/Reward: 4.0
More thoughts in my profile @93balaclava
Personally I trade on a platform that offers low fees and strong execution. DM me if you're interested.

XLM/USD Main trend. Timeframe 1 week. Channel. Radiant Star of 2218) One of the most “silent” cryptocurrencies. Unlike its fellow clone, pumped up by the community on the ears of pseudo-esoterics (although 589 is not going anywhere, which is, that is, it is not price))))....
Note that past secondary trend reversals are shrinking after significant dips. We are now in the lower zone of the channel, but not at the lowest potential values. Never “catch” the lows and highs, but work most of your position near those values, and you will be happy and relaxed.
I advise you to combine pyramiding (up) + martingale (down), and you won't care where the price goes, because you'll be happy with either direction. It is also rational to protect your profits with stops, but not near intraday volatility.
It is also natural for your peace of mind to forget about two things if you have a mind:
1) Forget margin trading. Work only on spot.
2) Forget the 1 “world's most reliable exchange” (diversification of trading and storage).
Coinmarket: XLM
About the enlightenment: .
1) Instant (less than 3 sec) transactions,
2) Conditionally free transactions $0.000001 (0.00001 XLM micro payments),
3) No network congestion (30 sec refund in case of failed transaction (not to be confused with exchange),
4) Smart contacts and NFT (2022),
5) "Transaction rollback" (this is an advantage, not a disadvantage for real use, not speculation),
6) Support for multi-currency transactions.
7) Interest in XLM blockchain by states.
And much more...
Roughly speaking, all the best worked out solutions from thousands of temporary “faith cryptocurrencies” over the last 10+ years.
Incidentally, many states will be making “transitional” fiat currencies on this blockchain. For example, the long-suffering Ukraine. But then when there will be “total sadness”. Creating a problem—presenting a ready-made solution.
Here's what this important zone looks like on the 1-day timeframe. Key reversal or trend continuation zone.
Breakout of the local symmetrical triangle +10% to the mirror resistance level of 0.2022.

Can #AAVE Bulls Sustain the Current Momentum? Key Levels Yello, Paradisers! #AAVE looks bullish on the surface—but is this setup quietly setting up for a brutal dump? Here's the key level that will trigger the next big move:
💎#AAVEUSD is currently trading around $143.66, holding inside a clear ascending channel on the 4H timeframe. The price action of #AAVE has been respecting both the ascending support and resistance trendlines, forming higher lows and higher highs—but momentum is fading.
💎A bearish divergence on the momentum oscillator is signaling early weakness despite the price climbing higher. This divergence usually marks the beginning of a bull trap, where the price appears strong just before a sharp reversal.
💎The immediate resistance to watch is in the $156. This is where price was recently rejected, near the upper channel trendline. Above that, $156 remains the key Bearish Setup Invalidation level. A breakout and hold above this would invalidate any bearish structure and could lead to a push toward $170+.
💎However, if AAVE breaks below the ascending support, currently near $140, it opens the door for a sharp drop. The first target is the $126.10 support zone, followed by the $114.35 level, which aligns with a strong historical demand area.
Play it safe, respect the structure, and let the market come to you. Discipline, patience, and strategy are what separate long-term winners from short-term gamblers
MyCryptoParadise
iFeel the success🌴

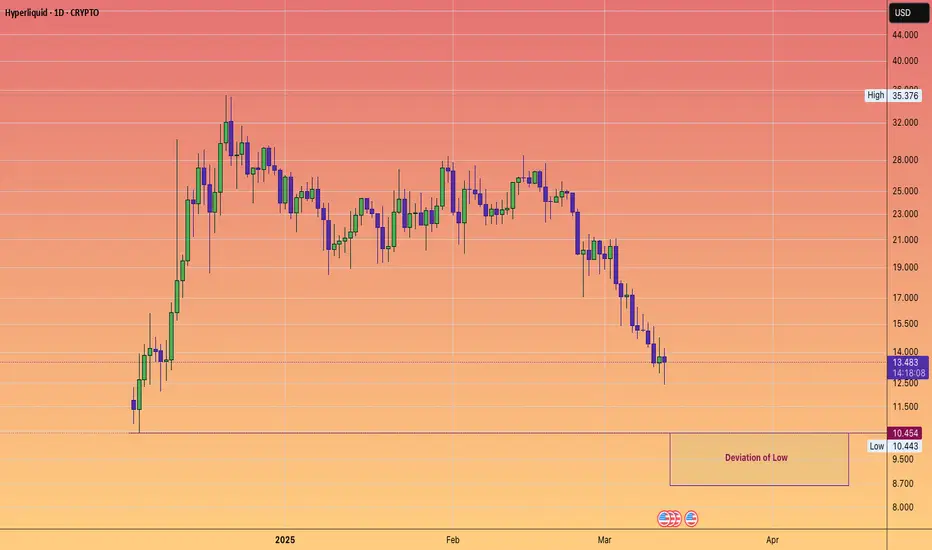
HYPERLIQUID LIQUIDATION SYSTEM EXPLOITED#HYPE is facing price declines following rumours of a malicious actor siphoning funds from the pool and taking advantage of the liquidation process.
While decentralised finance offers incredible opportunities, the actions of a single individual can lead to significant losses as investors pull their capital.
Let's hope Hyperliquid can enhance their security measures to prevent such incidents in the future.
BTC - Critical Juncture at channel and liquidity levelThe 1-hour chart reveals BTCUSDT navigating crucial price territory, with immediate focus on the 85,000.0 to 88,000.0 range. The market shows subtle but important movements, with current price action hovering near 84,260.1 after testing higher levels.
Key observations from the chart:
The volume profile indicates weakening momentum as price approaches the 88,000 resistance zone. Of particular note is the cluster of activity around 84,260.1 , which now serves as immediate support. The liquidity pockets at both 85,000 and 88,000 create clear reference points for potential breakouts or rejections.
Critical levels to monitor:
Upper resistance sits firmly at 88,000.0 , where previous reactions have occurred. Strong support emerges at 84,260.1 , with additional floors at 82,000.0 and the psychological 80,000.0 level. The 0.76% price change marker suggests some volatility brewing beneath the surface.
Trading considerations focus on two scenarios:
A hold above 84,260.1 could signal strength and potential retest of higher levels. However, failure to maintain this support may trigger moves toward 82,000.0 . The tight 0.04% to 0.02% bands indicate potential compression before the next directional move.
Market structure currently favors cautious optimism, but requires confirmation above 85,000.0 for stronger conviction. The diminishing volume at higher levels suggests some exhaustion, making proper position sizing essential.
Final Note: These price levels represent significant psychological barriers. Traders should watch for volume spikes and candle closes beyond these markers for confirmation. Always employ strict risk management in these potentially volatile conditions.
Disclaimer: Market conditions change rapidly. This analysis represents one interpretation of current price action and should not be considered financial advice.

BTC.D - Still in the ascending channelCRYPTOCAP:BTC.D remains firmly within its long-standing ascending channel. The recent “fake breakout” below the channel has been invalidated as dominance swiftly returned to the channel, showing a strong reaction and confirming the channel’s validity.
This suggests:
✅ Bullish Implication for BTC: Bitcoin is likely to continue gaining dominance in bullish moves, outpacing altcoins in performance.
✅ Bearish Impact on Altcoins: In downturns, altcoins are expected to experience sharper declines compared to Bitcoin.
Traders should monitor this channel as a key indicator for market behavior, especially for Bitcoin and altcoin strategies.

Breakout in Aergo (AERGOUSDC)...Chart is self explanatory. Levels of breakout, possible up-moves (where crypto may find resistances) and support (close below which, setup will be invalidated) are clearly defined.
Disclaimer: This is for demonstration and educational purpose only. This is not buying or selling recommendations. Please consult your financial advisor before taking any trade.
