Flow: Your Altcoin ChoiceBefore starting, I want to show you the linear chart for FLOWUSDT. I always use the log. chart to be able to see the high and lows and the candles more clearly.
When the candles become flat and almost invisible, it means the market is trading at bottom prices. This is FLOWUSDT long-term:
This applies to all pairs and Cryptocurrency projects. When the candles become almost invisible, it means that the current neutral market cycle has been exhausted. Next comes the bull market.
Now we can go to the full chart with all the data and drawings.
The logarithmic chart reveals all the info but it is hard to appreciate how low really a Crypto pair is trading in relation to past action. This is very important if you do your own technical analysis and numbers. This is important if you do your own search for good entry prices. Just go linear and see what the chart reveals.
FLOWUSDT is trading at a new All-Time Low. The ATL session has no bearish volume but instead is about to close green. Bears are gone. They had control of the market for so long, but this is over now.
A new ATL is good because it opens the doos for new players and also maximum growth. A bull market cannot come out of a new All-Time High. Out of an All-Time High, only a bear market can develop. Out of bottom prices, we can see sustained long-term growth. So there is always some positive that can be extracted out of the negative.
When prices are high, all is good because we are growing; there is money and there are profits. When prices are low, all is good because we can prepare for a growth phase. Regardless of how you look at it, everything is always nice, good, positive and great. Adopt the right mentality and you're bound to achieve success.
It is impossible to mistake the action on the chart. A bear market, a sideways market and then comes... A bull market.
» The bear market is marked as (1) on the chart.
» The sideways market is marked as (2).
» The bull market comes next, (3).
I am keeping it simple, because there is not much more for me to say; I am keeping it simple, because simple is best.
Namaste.
Crypto

Inversion Fair Value Gaps (IFVGs) - A Deep Dive Trading GuideIntroduction
Inversion Fair Value Gaps (IFVGs) are an advanced price action concept rooted in Smart Money theory. Unlike standard Fair Value Gaps (FVGs), IFVGs consider the idea of price revisiting inefficiencies from an inverse perspective. When price "respects" a previously violated gap from the opposite side, it creates a powerful confluence for entries or exits.
This guide will cover:
- What an IFVG is
- How it differs from traditional FVGs
- Market context for IFVG setups
- How to trade them effectively
- Real chart examples for clarity
---
What is an IFVG?
An Inversion Fair Value Gap (IFVG) occurs when price trades through a traditional Fair Value Gap and later returns to that area, but instead of continuing in the original direction, it uses the gap as a support or resistance from the other side.
Standard FVG vs. IFVG:
- FVG: Price creates a gap (imbalance), and we expect a return to the gap for mitigation.
- IFVG: Price violates the FVG, but instead of invalidation, it respects it from the other side.
Example Logic: A bullish FVG is formed -> price trades through it -> later, price revisits the FVG from below and uses it as resistance.
---
Structure and Market Context
Understanding structure is key when trading IFVGs. Price must break structure convincingly through a Fair Value Gap. The gap then acts as an inversion zone for future reactions.
Ideal Market Conditions for IFVGs:
1. Market is trending or has recently had a strong impulsive move.
2. A Fair Value Gap is created and violated with displacement .
3. Price retraces back to the FVG from the opposite side .
4. The gap holds as support/resistance, indicating smart money has respected the zone.
---
Types of IFVGs
1. Bullish IFVG: Price trades up through a bearish FVG and later uses it as support.
2. Bearish IFVG: Price trades down through a bullish FVG and later uses it as resistance.
Note: The best IFVGs are often aligned with Order Blocks, liquidity levels, or SMT divergences.
---
How to Trade IFVGs
1. Identify a clear Fair Value Gap in a trending market.
2. Wait for price to break through the FVG with momentum .
3. Mark the original FVG zone on your chart.
4. Monitor for price to revisit the zone from the other side.
5. Look for reaction + market structure shift on lower timeframes.
6. Enter trade with a clear stop loss just beyond the IFVG.
Entry Confluences:
- SMT divergence
- Order Block inside or near the IFVG
- Breaker Blocks
- Time of day (e.g., NY open)
---
Refined Entries & Risk Management
Once the IFVG is identified and price begins to react, refine entries using:
- Lower timeframe market structure shift
- Liquidity sweeps just before tapping the zone
- Candle closures showing rejection
Risk Management Tips:
- Set stop loss just beyond the IFVG opposite wick
- Use partials at 1:2 RR and scale out based on structure
- Don’t chase missed entries—wait for clean setups
---
Common Mistakes to Avoid
- Confusing IFVG with invalidated FVGs
- Trading them in low volume or choppy conditions
- Ignoring market context or structure shifts
- Blindly entering on first touch without confirmation
Tip: Let price prove the level—wait for reaction, not prediction.
---
Final Thoughts
IFVGs are an advanced but powerful tool when used with precision. They highlight how Smart Money uses inefficiencies in both directions, and when combined with other concepts, they can form sniper-like entries.
Practice finding IFVGs on historical charts. Combine them with SMT divergences, OBs, and market structure, and soon you’ll start seeing the market through Smart Money eyes.
Happy Trading!

Trading opportunity for BTCUSDTBased on technical factors there is a Sell position in :
📊 BTCUSDT
🔴 Sell Now
🪫Stop loss 91000.00
🔋Target 75000.00
📏 R/R 1,5
💸RISK : 1%
We hope it is profitable for you ❤️
Please support our activity with your likes👍 and comments📝

BTC – Restabilization after this massive drop?Market Context:
BTC has broken below a key support level, indicating potential for continued downside. Price is currently retracing after a sharp sell-off, but the overall structure remains bearish unless significant levels are reclaimed.
Technical Overview:
- The previous support zone has been broken, turning it into potential resistance.
- Price is now entering a lower Fair Value Gap (FVG), which could serve as a reaction zone.
- A larger FVG higher up, aligning with the 0.618–0.65 Fibonacci retracement zone, presents a more significant area to watch for a possible reversal.
Scenario:
Price may retrace into the lower FVG and continue pushing up toward the premium FVG zone. This area coincides with the 0.618–0.65 Fib levels, where a shift in momentum or bearish confirmation could trigger a move lower.
Key Points:
- A potential rejection could occur from the premium FVG zone.
- If an Inverse Fair Value Gap (IFVG) forms in that area, it would support a short setup.
- Alternatively, if price prints a lower low before reaching the upper FVG, that would also open up short opportunities.
- Patience is key—wait for structure to align or a momentum shift before considering entries.
Outlook:
The bias remains bearish unless the structure is reclaimed decisively. Current price action suggests the retracement is corrective, and the next impulse may resume the downtrend once premium levels are met.

ZEC ANALYSIS🔮 #ZEC Analysis
🌟🚀 #ZEC is trading in an Ascending Triangle Pattern and here we can see that #ZEC testing the ascending trendline. Also there is an instant major support zone. We can see a pullback from its major support zone.
🔖 Current Price: $32
⏳ Target Price: $40
⁉️ What to do?
- We have marked crucial levels in the chart . We can trade according to the chart and make some profits. 🚀
#ZEC #Cryptocurrency #Breakout #DYOR

DXY NEXT MOVE AND MARKET EFFECTThe US Dollar Index (DXY) is currently testing a major multi-year support zone around the 99.70–100.00 level. This level has held firm multiple times in the past, acting as a strong demand area during key macroeconomic cycles. Right now, price action is showing indecision with a clear do-or-die moment forming. If bulls defend this zone, we could witness a significant bullish reversal, potentially targeting the 103.00–105.00 range. However, a decisive break below this support could trigger a bearish wave toward the 96.00 handle or even lower.
Technically, this zone is not just psychological, but also a structural demand region, aligning with previous swing lows and price pivots. We’re seeing a potential for either a double bottom reversal or a breakdown structure forming, depending on how the market reacts in the coming sessions. Price is extremely oversold on higher timeframes, which could fuel a relief rally if momentum shifts. The reaction here will be key for broader market direction, especially as the dollar plays a pivotal role across forex majors.
Fundamentally, the DXY is under pressure as recent U.S. macro data reveals weakening momentum. March CPI printed hotter than expected, but other indicators like core PCE, NFP softness, and signs of slowing consumer demand are fueling expectations that the Fed may be nearing a policy pivot. At the same time, global risk sentiment is improving and yields have pulled back slightly, putting pressure on the greenback. However, rising geopolitical tensions and elevated oil prices continue to support USD as a safe-haven asset.
As a professional trader, this is a critical level to watch. I’m keeping an eye on price action confirmation for either a bullish engulfing setup or a clean break and retest of the 99.50 level. Both scenarios offer high-probability trades. Patience here is crucial — let the market reveal its hand, then align with the momentum. Dollar volatility is likely to remain elevated heading into next week, so managing risk with clarity is key.

Bitcoin BTCUSDT – 4H Technical Analysis
Bitcoin is currently approaching a key downtrend resistance line that has been respected several times since early February. The price action suggests a potential rejection from this level, which could lead to a move toward the lower boundary of the broader descending channel.
🔹 Bearish Scenario: If the resistance holds, we may see a continuation of the downtrend with possible targets near the $71K– FWB:73K region.
🔹 Bullish Invalidator: A confirmed breakout above the trendline would invalidate the bearish setup and could signal a shift in market structure.
⚠️ Watch price action closely around this level for potential rejection or breakout confirmation.

Trading opportunity for FETUSDTBased on technical factors there is a Sell position in :
📊 FETUSDT
🔴 Sell Now
🪫Stop loss 0.540
🔋Target 0.350
📏 R/R 2,3
💸RISK : 1%
We hope it is profitable for you ❤️
Please support our activity with your likes👍 and comments📝

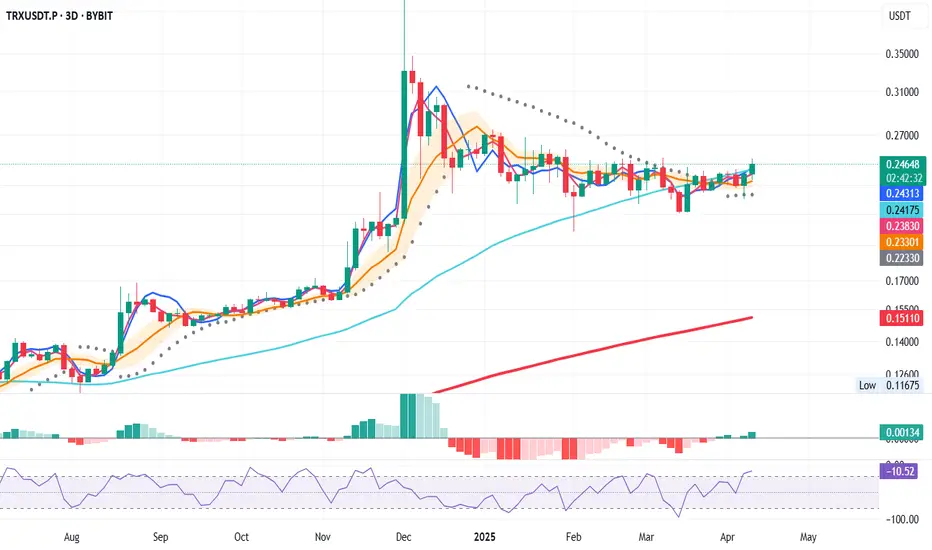
TRXUSDT – Bullish System Trigger (3D Chart)
📅 April 13, 2025
Today’s 3D bar close offers a strong bullish signal, aligning multiple system indicators in favor of a long entry.
Here’s what the system confirms:
✅ Price closed above the 50 MA – bullish structure
✅ MLR > SMA > BB Center – solid confluence
✅ Price > PSAR – trend shift confirmed
✅ Above the 200 MA – long-term trend support
Entry Strategy
- Open long at the 3D bar close
- Stop-loss below the latest PSAR dot for system integrity
📌 Note: This is a system-based entry — not a prediction.
Supra: Your Altcoin ChoiceThis Supra chart is barely four months old, so it doesn't meet our criteria of at least 6 months for a technical analysis, but the project looks good and the chart is easy to read. I had a good feeling as soon as I opened the chart so let's look into it anyway. It is my pleasure to do these analysis for you.
There is a perfect downtrend on this SUPRAUSDT chart and this is always quite revealing. Knowing that a downtrend is present we know that at some point the market must change course. This point in time is now.
The All-Time Low came on 3-April. Notice how as soon as April starts volume starts to rise. This is the signal. Low prices, a new ATL and then suddenly, action. Whales are buying.
This increase in trading volume reveals that a support level has been found and is being established. Looking at the rest of the market, we know that this support will hold and a reversal comes next. Also, trading volume continues to rise and the candles are now turning green. This is positive, this is bullish. There is good potential for growth.
That's it. It is a young chart so there isn't much more.
The downtrend will lead to sideways. Sideways lead to bullish growth.
Many targets can be seen mapped on the chart based on Fibonacci proportions. Growth potential goes beyond 3,000% or more for the 2025 ATH. Truly, impossible to tell. This pair/project might grow 5,000%, 10,000% or who knows. When new projects are launch preceding a bull market, anything goes.
Here I am mapping some short-term targets. You take care of the rest.
This project is likely to grow really strong in the coming months.
Thank you for reading.
Your support is appreciated.
All Altcoins Choice requests have been fulfilled.
Namaste.

Moonriver: Your Altcoin ChoiceHere Moonriver produced growth equaling 1,000% in a down year, 11X. Between late 2023 and early 2024. Surely, if this pair can produce this much growth as part of a bounce, a small move lasting two months within a bearish period, it can definitely grow more in a bull market. Any type of bull market.
Following this logic, a bull market year can produce a minimum of 2,000% or 3,000%, or maybe more, 5,000%, because the 1,000% was when the market was down and at its worst. And this all happened within 2 months.
So two months can produce 1,000% growth. Six months can surely produce so much more. This is logical thinking, makes sense and I believe you can agree.
Imagine the market going full blown bullish but producing the exact same amount of growth as in a neutral year, 1,000%. This would still be great but it doesn't make any sense.
Moonriver (MOVRUSDT) is trading at bottom prices with a long-term higher low (technical double-bottom), ready to grow. 2025 is the Cryptocurrency bull market year, we will see a minimum of 21X, but this pair can grow much more.
This another great Altcoin Choice.
Make sure to secure profits as your capital grows.
We are entering the 2025 bull market this or next month. The growth starts now, slowly, by next month everything will speed up. The wait is over. Rest easy, the pair you are holding is good with good potential for growth. Really strong. Your wise. You are smart.
Thanks a lot for your continued support.
Namaste.

BTC - breakout or bull trap in progress?Yesterday, Bitcoin broke out of the descending trendline it had been respecting for several days, forming a clear double bottom in the process — a classic reversal pattern suggesting bullish intent. Since then, price action has shifted into a consolidation phase, hovering just beneath a key liquidity zone filled with stop-loss orders from prior short positions.
This area aligns closely with the previous 4H lower high, above which lies a fair value gap (FVG) that hasn't yet been fully filled. A move into this region seems likely, especially with liquidity resting above the prior high. We could see BTC targeting a partial fill — around the 50% mark — of that 4H FVG before any significant reaction occurs.
On the way up, BTC also created another 4H FVG. It’s likely that price could revisit and partially fill this imbalance before continuing its move higher. This zone could serve as an ideal retracement area for bulls to re-enter, especially if the market seeks to rebalance before making a stronger push.
Looking ahead, the $85.5K level stands out as a highly probable target. It marks a key psychological and technical resistance zone and is a magnet for liquidity. With momentum building and the current structure leaning bullish in the short term, a sweep of that level in the coming days is entirely plausible.
However, it's important to zoom out. Despite this bullish momentum, the broader market structure remains bearish. Unless BTC breaks above and holds above this larger structure convincingly, rallies are more likely to be liquidity grabs rather than true trend reversals. Once $85.5K is tagged, there's a real possibility of a sharp rejection — potentially sending price back toward local lows or even printing new ones.

VeThor Thoken: Beyond Expectations, A 5,688% Bull MarketVeThor Token looks really good right now and this is a pair that has been growing since September 2023. A long-term triple bottom was established before the current bullish cycle.
The first low came in December 2022, then June 2023 and finally September 2023. 1,2,3. With support found and confirmed, VTHOUSDT started to rise and produced what is now shown on the chart as a broadening rising channel.
Total growth for this pair amounts to a nice 1,300% since the final low in September 2023. There was a correction recently and the bullish action is about to be resumed.
Trading volume is also revealing a strong bullish bias. The green bars are out of proportion with the rest of the bars. The big ones are really big. Showing that buyers are always ready to step up and with force.
Prices are great right now. Timing is awesome. We are looking at a great situation for those that are bullish because the low was set this very same week. This means early and entering early means maximum potential for growth.
The rise is ongoing. This is already a long-term bullish phase for this pair. The next target stands at 0.018384 for a nice 736% and 0.28714 for a huge 1,200%. It can go higher based on higher highs and higher lows, one final target can produce 2,140% total growth. Details on the chart.
From bottom to top, the final projected target, if reached, would yield an amazing 5,688%. That's just how Cryptocurrencies work, the growth tends to go beyond all expectations.
Thanks a lot for your continued support.
Namaste.


ETHSimple chart :
- Don’t fight the trend, just stick to your strategy.
- follow the signs.
- Never go all in and always DCA.
Only this way we will learn to master our emotions.
Happy Tr4Ding !

XRP, Bloodbath is ComingBINANCE:XRPUSDT / 1D
Hello Traders, welcome back to another market breakdown.
BINANCE:XRPUSDT is showing strong bearish momentum after BINANCE:BTCUSD and BINANCE:ETHUSD broken bellow resistance. However, the price is oversold for now. Hence, instead of jumping in at current levels, I recommend waiting for a pullback into the high of the range zone for a more strategic entry.
If the pullback holds and sell off confirms, the next leg higher could target:
First Resistance: Immediate levels formed during prior consolidation.
Stay disciplined, wait for the market to come to you, and trade with confidence!
Trade safely,
Trader Leo.

Bitcoin (BTCUSDT) – Technical and Fundamental Analysis 1DBTC has formed a falling wedge pattern on the daily chart, indicating a possible bullish breakout. A clean break above the 0.618 Fibonacci level at $86,485 may trigger an impulsive move to the upside. Price is bouncing from wave (4) and challenging the descending trendline. RSI is recovering, suggesting renewed buying momentum, and MACD shows signs of a bullish reversal.
Fundamental Factors
Bitcoin remains supported by strong institutional demand and optimism around crypto ETFs. Expectations of lower interest rates and macroeconomic uncertainty continue to drive interest in BTC as a hedge. Meanwhile, on-chain data reflects accumulation, with exchange outflows increasing in recent sessions.
Scenarios:
Main scenario – breakout above 0.618 targeting $96,595 and $109,474, with a potential extension toward $125,842.
Alternative scenario – pullback toward $79,384. If this level fails to hold, further correction to $72,283 and $63,497 is possible. The $79K level remains a key support for bulls.

Bitcoin 5X Lev. Full PREMIUM Trade-Numbers (PP: 710%)Bitcoin is presenting us with a very clear and strong bullish bias. The action is happening within a very tight falling wedge pattern. All market conditions are bullish, technical and fundamentals. Everything is pointing up starting several days ago. 7-April Bitcoin produced its 2025 market bottom low. From this date on, we will see growth until late 2025 or maybe until early 2026 or beyond.
This is a high probability trade setup. The market produced many shakeouts already and the majority of weak hands have been removed. All the people around now, all remaining participants, are solid players with diamond hands. These people, you, have a plan and know how to play the long-term game.
For people like us, the market is making this opportunity available.
Make the best of it. Aim high.
Full trade-numbers below:
_____
LONG BTCUSDT
Leverage: 5X
Entry levels:
1) $85,000
2) $82,000
3) $78,000
Targets:
1) $95,000
2) $104,250
3) $120,000
4) $131,400
5) $143,300
11) $165,000
12) $181,000
13) $203,000
Stop-loss:
Close monthly below $74,000
Potential profits: 710%
Capital allocation: 5%
_____
Strategy: Buy and hold. If prices drop, buy some more. The market will take care of the rest.
Just make sure to keep your position active, do not allow to be liquidated. That's the only important point. Bitcoin will soon grow.
Patience is key.
Use low risk.
Success is yours.
Namaste.

Cardano: Your Altcoin ChoiceOne of our friends asked for an update on Cardano, the 2025 All-Time High. I already did several charts with the ATH so I will recycle this one since the numbers stay the same.
We can still use the same numbers today we extracted after June 2023, that is because we use the bear market bottom to project a new ATH. Anyway, the chart is easy.
Cardano bottomed June 2023 and has been moving within an uptrend, higher highs and higher lows.
The last bullish jump happened in late 2024 peaking in early December. Then the correction comes. The correction bottomed early February 2025 and this week we are seeing the establishment of a higher low. This higher low is a great place to buy and go LONG. Because the correction is over so the next move is up. No more lower prices. No more sideways, no more corrections but up.
The correction lasted some 4 months and amounted to a drop of more than 60%. Some people without a clue are calling for lower but this is impossible. A correction is just that a correction, not a bear market. A bear market was 2022 and it requires lower and lower... Cardano has been going up since June 2023. We are entering the bull-run phase in late 2025. The contrary to a bear market we are actually seeing, we are in a bull market. The recent bearish action is a simple correction of the last bullish move.
Obviously bullish because we have a higher low compared to August 2024, the last bottom. This is super basic but sometimes is good to go back to basics before a major run.
The standard 2025 All-Time High target is $8.11. If the market does really good, it can go higher, much higher. If the market does poorly, growth will still be amazing. Doing poorly is not an option. Crypto is the new default method to exchange value. Soon, 1 billion people will be trading and using Crypto, growth will be something that cannot be explained.
Bet on Crypto and you will win in the short-, mid- to long-term.
Buy and hold Crypto and your financial future is secured, this is an easy bet.
Bet on the future, bet on the Internet.
Bet on technology. Bet on innovation.
The market needs your support.
Fiat currencies are going down after centuries of doing their work.
Nothing against fiat and decaying banks, they played their role.
We have nothing against landline and dial-up, but now we go wireless...
Nothing against the mail but we use e-mail.
Nothing against cash but we use virtual transactions and credit cards.
Thanks a lot for your support.
It is impossible to stop the evolution of the world.
Humanity will continue to improve.
A new form of money is not only necessity but a must.
We welcome Crypto.
We love to pay with our phones.
With Crypto, you can transfer money fast and easy, without censorship, without government control.
Abundance, peace, prosperity and freedom is the new norm.
Namaste.

HelenP. I After strong impulse up, BTC can start to declineHi folks today I'm prepared for you Bitcoin analytics. BTC has recently shown a strong recovery after reaching the support zone between 77000 and 76200 points. This area had already acted as a base twice in the past, and the price once again reacted from it with a sharp bullish impulse. The rise brought Bitcoin back into the resistance zone between 83500 and 84300 points - a level that has proven significant in the past. At the same time, BTC approached the descending trend line that forms the upper boundary of the wedge pattern visible on the chart. The reaction from this confluence zone was immediate. The price got rejected right at the intersection of the trend line and resistance zone, forming a clear rejection candle and showing weakness from buyers. This area is now holding Bitcoin down once again and proving itself as a strong supply zone. At the moment, BTC is trading below the trend line and under pressure from resistance. Given the recent price action, multiple rejections from the same zone, and position relative to the wedge, I expect Bitcoin to decline again toward 78000 points - my current goal. If you like my analytics you may support me with your like/comment ❤️

Aerodrome Finance: Your Altcoin ChoiceHere is a chart with perfect bottom price dynamics, Aerodrome Finance (AEROUSDT).
There is a falling wedge pattern and this pattern ends with a rounded bottom. The rounded bottom is a classic and strong reversal signal. See how back in 2024 this same pattern led to growth.
Here the rounded bottom is coupled with a new All-Time Low as well as rising volume. Both factors add further strength to this pattern as a reversal signal.
This is all I have to say to support a bullish wave.
The correction started in early December 2024. It went on for exactly four months. The duration of this correction is also quite revealing because corrections tend to last between 3-6 months. In a bull market, normally they last between 2-3 months. Since this one is preceding a bull market, it can last longer and that's what it did.
Now that all gains have been removed, a new All-Time Low. The market is ready and can grow really strong.
Whoever remains holding is really in it for the long-term. If you are not holding, this is a great buy. The price available now won't be around for too long. Just watch, once it starts growing and we look back, it will be easy to realize that the bottom buy opportunity lasted only a few days. That's it, a few days of great entry prices and then a long-term bullish wave.
The time to buy is now.
Thanks a lot for this Altcoin Choice.
Your support is highly appreciated.
Namaste.

Zeus: Your Altcoin ChoiceThe chart is good, because we have a long-term rising bottom. The All-Time Low was set in August 2024. Another good point for this pair is the fact that the long-term higher low happened in March 2025, last month. The low in April ended up as a higher low. Another point in favor.
For the 2025 All-Time High potential I have the same problem as with Sui, the chart is too young, I cannot make any accurate projection based on TA.
The following numbers can be good but can also underestimate this pair because we simply don't know how it performs in a bull market. $1.85 would be the main first level to look for. Vs current price, this would open 535% profits potential. The next level is $3, which translates into 927% potential for profits, if the entry is done at current levels.
A 400% bullish jump in the last wave means that this pair can easily grow 1,000-2,000% in this bull market, easily; the truth is that it can be much more. It is very early in the game. It is a new project, so it can end up growing like new projects tend to grow. Look at The Sandbox trade idea for some examples or the recent publication about Cardano. Anything is possible. Prepare for something great.
Thanks a lot for your continued support.
Namaste.

Sui: Your Altcoin ChoiceThe action is happening right above 0.786 Fib. retracement level support. Above it, the actual level wasn't hit and this is a signal of strength.
I looked at this chart when the action was happening above 0.618 and mentioned that it could drop further before the start of the next bullish wave. See what happened, as soon as the next support gets challenged, volume goes up. This is significant volume in comparison with the daily average. The highest volume since November 2024.
This volume signal can be easily translated as support found. Support found means that the down-move is no more. The down-move being over invariably leads to change. Change means the market won't be dropping no more. If it was going down, soon, SUIUSDT should start to grow. That's my conclusion based on the data coming from the chart.
Even if prices move a bit lower, the bullish bias still remains. There is an ending diagonal on the chart. This pattern tends to show up before a change of trend. The correction is over. It is only a matter of time before the next bullish wave.
Thanks a lot for your amazing and continued support. It is truly appreciated.
It is not possible to project an accurate ATH for this pair because the chart is too young. Relevant numbers for 2025 are $9.42 and $15.24.
Namaste.
