ETHUSDT BUYEthereum buy signal on M15 Timeframe, Bullish triangle resistance was succesfully broken. Now bullish target is 1689 level. Risk reward 1/3
Crypto

BRIEFING Week #15 : Arbitrages on the lookoutHere's your weekly update ! Brought to you each weekend with years of track-record history..
Don't forget to hit the like/follow button if you feel like this post deserves it ;)
That's the best way to support me and help pushing this content to other users.
Kindly,
Phil

Solana Update: To Buy Or Not To Buy? Hold Or Sell?Here is an update on Solana.
The chart has the same numbers as before but the support line has been moved to match the 5-August 2024 low. The action is happening right above this level.
While Solana trades above its August 2024 low, the action is considered bullish. Below this level and we are certainly bearish. Being bearish in this way does not change the long-term outlook, bias and perspective, we are set to grow long-term based on a broader trend and bigger cycle. This is a closer look.
The low in April is a shy lower low compared to March. This is always important. Notice the steep decline. This is a bearish impulse, prices tend to move down fast and strong. When bearish momentum starts to die down, we see patterns like the one we have on the chart above. Some shaky action and then a lower or higher low. The market (SOLUSDT) is preparing to change course.
The correction is present since November 2024. For Solana, the higher high in January 2025 is part of a complex correction, an extended flat. 3-3-5 wave in Elliott terms.
This is irrelevant. The point is that once the correction is over prices tend to grow.
Consider this, between June and September 2024 we have more than three months of consolidation. The market garnered enough strength to produce a bullish wave. It took a while but it happened. Then there is a correction and this bullish wave was erased by more than 100%.
If buyers showed up at a price of $100, $120, $130 and even $150 in the past, they can definitely show up again. Now that the bullish move has been erased, we are back to square one, the starting point, the base; from this point forward Solana can grow again.
Solana looks weak right now on the very, very short-term. But do not let this deceive you, we are going up next. Focus on the long-term.
Accumulation can be done each time prices hit support.
What happens if I buy and prices move lower?
Wait patiently. If you have capital available, buy more.
And if it drops again? Keep waiting, continue buying.
You will be happy with the results once the market turns.
Thank you for reading.
Patience is absolutely key.
If you didn't sell at $290, $280 or $250, why would you sell when prices trade at $100? It makes no sense.
Buy when prices are low and hold.
Only sell when prices are moving higher.
Namaste.

Bitcoin Weekly Update: Support Found (With Updated 2025 Targets)I want to highlight both, EMA55 and the 0.5 Fib. retracement level for the August 2024 - January 2025 bullish wave. These two levels have been tested and so far hold as support.
Good Thursday my fellow Cryptocurrency trader, how are you feeling today?
Things are good and everything is good. Bitcoin is back above 80K.
Bitcoin first pierced below 80K in early February, a long lower shadow on a candle with a high close. The close happened at 94.
Then again Bitcoin moved below 80K in the 10-March session but closed at 82K.
Last week Bitcoin closed below 80K. I mentioned that this is indeed a major development but market conditions do not change, we continue bullish. Last week, the first time ever below 80K, this week back above 80K. The week is not yet over so this signal is not confirmed.
The 0.5 Fib. retracement support level stands at $78,000. Any trading below 80,000 is a super strong buy opportunity. The market gave us a second chance and we took it with confidence and force.
EMA55 sits at $76,195 and was challenged for the first time since September 2024. It was challenged this same week and it holds. Bitcoin right now is safe and strong on the weekly timeframe.
Bitcoin is safe.
Lower is the least likely scenario.
Impossible for Bitcoin to hit 40K. Please ignore these people because they don't have a clue about Crypto and how the market works or behaves. Anybody calling for 40K must be ignored because this is either an attempt at some bad joke or indeed, complete insanity.
From the ~$74,000 March 2024 market high, after 5 months of distribution Bitcoin crashed and bottom at 49K. After reaching $110,000, only 3 months of distribution, a crash cannot lead to 40K. We still have all previous ATH as support and of course, we are going up. Let's not waste anymore time on something that doesn't make any sense at all but I still wanted to mention this to avoid and remove any confusion. Some people are just evil.
Let's consider the worst case, bearish scenario. If Bitcoin were to continue lower, it would find support in the blue zone on the chart. That is between 0.786 and 0.618 Fib. retracement. This is also the same range in which Bitcoin consolidated for months in 2024. So, in the worst case scenario, Bitcoin has strong support between $62,000 and $71,000; the truth is Bitcoin is going up.
Why we need not worry about this scenario?
Look at the volume on the chart.
A lower low and the lowest price in years and trading volume is really low. Both sessions producing the lowest prices, 10-March and 7-April closed green. This means that buyers were ready and waiting. If bears start selling, the bulls are happy to buy everything quick.
Since the downside is not our concern, we can focus on the future, higher prices which is what will happen next and long-term. Bitcoin is going up for a long while, until late 2025 minimum. It can extend and go into early 2026, we will know soon.
Now that we have a new low we can project more accurate and new targets. These can be seen on the chart and below:
1) $96,377 (Very easy)
2) $131,777 (Easy)
3) $145,300 - $167,177 (Strong)
4) $202,577 (Potential ATH)
5) $237,977 (Strong bull market)
With a strong market, which is standard for Crypto, Bitcoin can easily hit $167,000. Just a little more and we have $202,577. For this level market conditions should be really good. If things are great, Bitcoin can move and grow beyond 200K. Here we have 238,000 based on the most recent and accurate numbers.
Everything is pointing up.
We have long-term higher highs and higher lows.
The recent correction is very small compared to the past, but still reached beyond 30%. A 30% correction in a bull market is a strong correction, do not expect lower prices, we are going up next.
Bitcoin cannot go down 50% nor 60%, too much interest, too many people ready to buy, way too many people are aware. Bitcoin is solid and ready now, soon to trade beyond 100K.
The proof is in the chart.
Not only Bitcoin but also the stock market will grow.
The correction is over!
This is good.
Thanks a lot for your continued support.
Technical analysis made simple.
Consider hitting follow if you enjoy the content.
Leave a comment to show your support.
Namaste.

BITCOIN Just like 2017 - The $300k prediction is happening!Bitcoin / BTCUSD continues to replicate the 2014-2017 Cycle, giving us a clear perspective of the bullish trend amidst the high volatility since the start of the year.
The different phases since the bottom are identical between the two Cycles and right now we are on Phase 4, supported firmly by the 1week MA50.
Hard to believe but if history continues to repeat itself, BTC may skyrocket as high as $300k by the end of this Cycle.
Follow us, like the idea and leave a comment below!!


AVAXUSD cooking massive Triangle bullish tradeAvalanche / AVAXUSD is trading inside a massive Triangle pattern for the entirety of its history.
The price just hit its bottom this week and is rebounding with force.
The first target is 45.000, right at the top of the pattern.
If however the 2021 Bull Cycle is confirmed then the price can break massively above the Triangle and exceed $300, but this is arguably an ambitious target.
Follow us, like the idea and leave a comment below!!

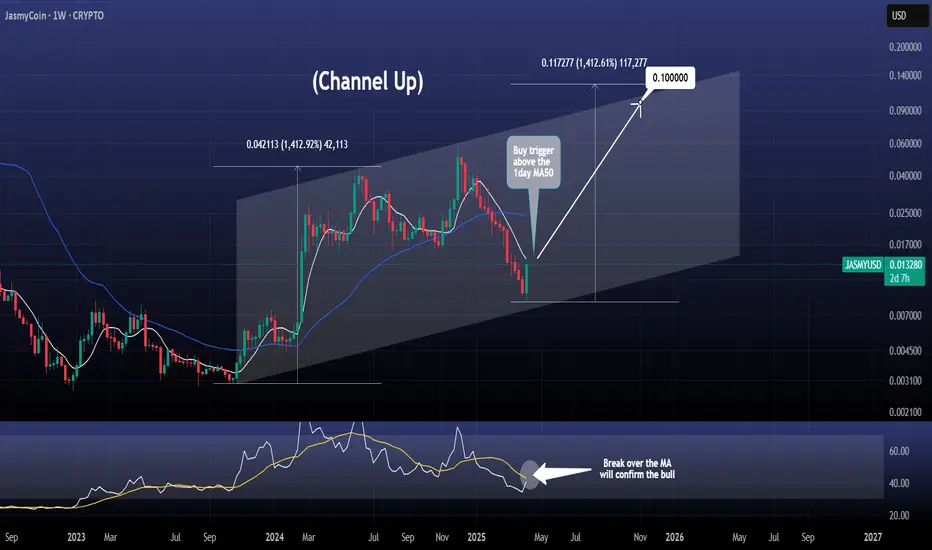
JASMY aiming at $0.10 after this break out!JasmyCoin / JASMYUSD is posting a massive green 1week candle, the strongest one since the December 2nd 2024 that formed the high of this Cycle so far.
This is also the bottom of the Channel Up and a crossing over the 1day MA50 (white line) will be the buy trigger.
Additional indicator to look for is the 1week RSI, giving a buy confirmation over its MA.
Target 0.1000 (+1400%).
Follow us, like the idea and leave a comment below!!
RNDR/USDT – Double Bottom Formation Signals Reversal PotentialRender (RNDR) is currently forming a Double Bottom pattern, signaling a potential bullish reversal from recent lows. The pattern is validated if the price breaks above the Resistance Neckline at 4.200, confirming strength from buyers.
📌 Key Technical Levels:
Key Support: 3.235 – a critical level where price previously found buying interest.
Order Block (OB) Zone: 3.400 - 3.484 – potential demand area for renewed bullish momentum.
Strong Resistance Zone: 5.800 - 6.200 – historical selling pressure likely to be met if price continues upward.
A decisive break above the neckline could trigger a rally toward the Strong Resistance Zone, aligning with prior structural reactions. However, failure to sustain momentum might see retests of Key Support and the OB zone for liquidity gathering. Traders should monitor volume confirmation and price reaction at these critical levels.

Prepare for LIFTOFF $ADAThe Global Net Liquidity index is breaking out of its multiyear downtrend channel on the back of a weak TVC:DXY dollar. Altcoins like CRYPTO:ADAUSD and other risk assets historically wildly outperform during Global Net Liquidity uptrends and dollar debasement cycles. As the business cycle heats up with ISM Manufacturing PMI ECONOMICS:USBCOI rising above 50, expect altcoins to gain relative strength to CRYPTO:BTCUSD and a Bitcoin Dominance
CRYPTOCAP:BTC.D collapse into the 35-45% range.
This is your last chance.

ALTS may be starting an explosive rally.This chart shows the Crypto Total Market Cap (excluding top 10) dominance trading inside a Megaphone pattern that just bottomed. The bearish wave is identical to the first that made a double bottom LL on August 5th and kickstarted an altcoin surge that peaked on December 7th 2024. The first target of this setup is 9.20%.
## If you like our free content follow our profile to get more daily ideas. ##
## Comments and likes are greatly appreciated. ##

SEI: Your Altcoin ChoiceThe last session produced the highest volume since November 2024 and activated the baseline of a rounded bottom pattern that launched the first SEIUSDT bullish wave.
SEI's first bullish wave produced more than 1,101% growth. The peak happened in March 2024. After this peak, bearish all the way. The next major low happened on the 7-April 2025 trading session, 3D. More than a year of bearish action. I say this is enough.
A long-term higher low is present vs October 2023. The chart is clear and easy. Market conditions are about to change. The high volume on the more than a year strong higher low indicates that buyers were present. Support is activated but still early. Confirmation comes when multiple sessions close green without the last low, 0.1303, getting challenged again.
I don't think we should wait for confirmation. The wise move would be to do like the whales and start an accumulation phase. Instead of waiting for a certain market condition to be met, once support is hit we start to buy as much as we can. Prices will always fluctuate and fake signals are the norm. The market can move down and pierce support just to produce a fake bearish signal and then grow. It is very hard if not impossible to predict the short, short-term. When focusing on the bigger picture, we know the market is set to grow next. Knowing this, we buy, accumulate, as much as we can in anticipation of this bullish wave.
It is early but a long-term correction is over. What follows, is growth.
Thank you for reading.
Namaste.

The Graph: Your Altcoin ChoiceCan The Graph really grow by 6,000% in 2025?
I don't know, seems like a lot but I also have some more conservative targets.
$2.04 can yield a huge 2,493% from current levels. This is GRTUSDT moving up and not hitting a new All-Time High in 2025. There is a long long-term higher low and higher lows tend to lead to higher highs, which means that an All-Time High is indeed possible.
Another conservative target sits at $1.18 for 1,400% from current levels. There are also several lower, short-term targets mapped on the chart.
The Graph peaked super early in 2021, in February. The rest of the market peaked in April, May and many pairs in November 2021. So this is almost erratic behavior. This is good for the long-term and for the 2025 bull market. When projects move in unique ways, it tends to be a positive.
The project has been solid and strong. The chart is also good with good price action, a nice design and reasonable growth. The action is happening now near the same levels as the September 2023 low support. From here, prices can grow.
It can take a few days, maximum several weeks for the start of the next bullish wave. May for certain but never beyond. In fact, the bottom might be in now and we are gearing up for up for months.
I will not give you more as this is enough... A full bull market can develop within 6 months. Sometimes it can take 12 months or 16 months, but at other times, a pair can produce all the action in less than 6 months. This might be one of those.
Be prepared.
Thank you for reading.
Feel free to leave a comment with your questions.
If you enjoy the content just follow.
Namaste.

RNDR Long Swing Setup – Double Bottom at Key SupportRNDR has formed a textbook double bottom at the $3.00 high-timeframe support, hinting at a potential trend reversal. The strong bounce off that level shows bullish intent, and we’re now eyeing the $3.50–$4.00 zone for a potential throwback entry, turning old resistance into new support.
📌 Trade Setup:
Entry Zone: $3.50 – $4.00
Take Profit Targets:
🥇 $5.25
🥈 $6.60
Stop Loss: Daily close below $2.70

Theta Token: Your Altcoin ChoiceTheta Token has undergone a major correction, one that started in March 2024. Conditions are good for this chart based on the structure of this correction, it is reaching its end, but also a long-term higher low, really long.
THETAUSDT bottomed first in September 2023. The higher low comes in now, in April 2025. That's a year and seven months.
Easy target is a higher high compared to years of action, yielding a nice 590% potential for profits. But this would be mid-term but for the full bull market there should be more.
Super easy and short-term would be the 0.618 Fibonacci extension level around $2.31 for 216%. Both these targets are clearly mapped on the chart.
The correction higher low is now sitting within a long-term support, the buy zone. This is the space marked green on the chart. Each time THETAUSDT activates this level, a period of growth follows.
As seen in the past, once our long-term support and buy zone is activated growth doesn't necessarily start right away. Nothing happens within a single day. The pair/project can start growing producing higher highs and higher lows, but there can be a build up process that takes months. Think back of 2024. Many Altcoins bottomed in August and started to grow, but it took until November for the strong bullish jump. This time around it can be the same. Strong growth, but it takes time for bullish momentum to accumulate.
It is easy to wait with such a pair. The market can take as long as it needs because 500% profits is simply great. Imagine, or focus, or calculate based on 1-2 months of slow and steady growth, and then a strong bullish jump. Of course, there can be variations to this projection, but this is only the map, the map is not the territory.
Conclusion: Crypto is set to grow.
It doesn't matter if the next bullish wave shows up within weeks or days. The time to buy is now. Buy forever more and then just wait. Wait patiently. Books, read books and prepare. Be ready because this opportunity only presents itself every four years. We have to make the maximum of it. We have to accept what the market has to give. We have to secure profits at the right time. We have to extract some savings, pay our debts or do whatever it is we want to do once we achieve financial success.
When everything is green, do not fall sleep.
When everything is up, do not become complacent and continue to hold.
We hold now, when prices are low. When prices are high, that's the time to secure profits.
Thanks a lot for your support.
Namaste.

SushiSwap: Your Altcoin ChoiceAnother great chart. In December 2024 SushiSwap hit its highest price since December 2020 on a bullish move. In general, December 2024 produced the highest level since April 2022. Really something, a multiple years long high.
How are you doing today my friend in the law?
I hope you are having a wonderful day and weekend.
This is another classic chart setup and price action dynamic that I am about to show and analyze. SUSHIUSDT produced a triple-bottom on a wide, long-term consolidation (sideways) channel.
It is interesting to notice that shy higher highs have been present since October 2022. The bottom portion is mixed. Last week produced the lowest price ever based on candle close. On candle wick, this week is a higher low vs early August 2024. This is pretty much irrelevant.
Seeing a lower low, higher low, perfect double-bottom, etc., wouldn't change the bigger picture.
There is a strong correction after a descent but minor bullish wave. This correction ends at support and once the low is in a new bullish impulse will develop. Now, the preceding years the action was not really strong because these are transition years. A transition from bearish to bullish.
This year, everything changes. Instead of a small "descent" bullish wave, we will have a major bullish cycle, that is what comes next. The price now is absolutely awesome, the best possible, true All-Time Low. Once we are in with great timing and pricing, a bull market becomes really fun. When you manage to catch the bottom, all that follows is to see how your capital/profits grow.
Enjoy your life! And thank you for your continued support.
This is a great Top Altcoin Choice.
Namaste.

FLUX About to Explode or Break Your Portfolio? Yello Paradisers — are you ready for the next breakout play, or are you blindly walking into a trap? FLUXUSDT is showing signs of a major decision point, and it could catch most traders off guard if they're not prepared. Here's exactly how we're planning it.
💎#FLUXUSD is currently trading within a wedge formation, and we're seeing a high probability of an upside breakout, especially if price is able to surpass the key resistance at $0.2291. In such a case, the next magnet is the internal supply zone at $0.2650 this is where we’ll start monitoring for potential trade setups.
💎This internal supply is a critical reaction zone. If price respects it and starts pulling back, we expect a retracement toward the support level at $0.1646. The high time frame structure remains bearish, which adds more weight to this retracement scenario being likely after tagging the internal supply.
💎Also, Flux is trading below both the 50 EMA and 200 EMA, confirming broader weakness in trend structure and making any short-term breakout more of a reactive move inside the macro bearish bias.If price doesn’t reject at the internal supply zone and breaks through it cleanly, we’ll be looking for a strong reversal from the Ultra TF supply zone at $0.3115. That’s the higher level of confluence we trust more in the bigger picture.
💎At this level, we’ll wait patiently as always and look for clear bearish reversal patterns like an Evening Star or a Shooting Star. Only a confirmed breakout above $0.3115 would change the game entirely by shifting the overall market structure and invalidating this current bearish setup.
Stay focused, Paradisers. Be the hunter, not the hunted.
MyCryptoParadise
iFeel the success🌴

ELASTOS #ELA Could be a nice leverage play on BTCAs more and more things are being built on and around the big chain
It's a solid way to invest
riding it's coattails
as Bitcoin continues on it's path to 100k plus
Elastos is a sidechain of BTC --- apparently
lets dig around and see what else we can find

Trading opportunity for ADAUSDTBased on technical factors there is a Sell position in :
📊 ADAUSDT
🔴 Sell Now
🪫Stop loss 0.7200
🔋Target 0.5000
📏 R/R 1,5
💸RISK : 1%
We hope it is profitable for you ❤️
Please support our activity with your likes👍 and comments📝

Ethereum H4 | Pullback resistance at 50% Fibonacci retracementEthereum (ETH/USD) is rising towards a pullback resistance and could potentially reverse off this level to drop lower.
Sell entry is at 1,746.35 which is a pullback resistance that aligns with the 50.0% Fibonacci retracement.
Stop loss is at 1,980.00 which is a level that sits above the 78.6% Fibonacci retracement and an overlap resistance.
Take profit is at 1,436.95 which is a swing-low support.
High Risk Investment Warning
Trading Forex/CFDs on margin carries a high level of risk and may not be suitable for all investors. Leverage can work against you.
Stratos Markets Limited (tradu.com):
CFDs are complex instruments and come with a high risk of losing money rapidly due to leverage. 63% of retail investor accounts lose money when trading CFDs with this provider. You should consider whether you understand how CFDs work and whether you can afford to take the high risk of losing your money.
Stratos Europe Ltd (tradu.com):
CFDs are complex instruments and come with a high risk of losing money rapidly due to leverage. 63% of retail investor accounts lose money when trading CFDs with this provider. You should consider whether you understand how CFDs work and whether you can afford to take the high risk of losing your money.
Stratos Global LLC (tradu.com):
Losses can exceed deposits.
Please be advised that the information presented on TradingView is provided to Tradu (‘Company’, ‘we’) by a third-party provider (‘TFA Global Pte Ltd’). Please be reminded that you are solely responsible for the trading decisions on your account. There is a very high degree of risk involved in trading. Any information and/or content is intended entirely for research, educational and informational purposes only and does not constitute investment or consultation advice or investment strategy. The information is not tailored to the investment needs of any specific person and therefore does not involve a consideration of any of the investment objectives, financial situation or needs of any viewer that may receive it. Kindly also note that past performance is not a reliable indicator of future results. Actual results may differ materially from those anticipated in forward-looking or past performance statements. We assume no liability as to the accuracy or completeness of any of the information and/or content provided herein and the Company cannot be held responsible for any omission, mistake nor for any loss or damage including without limitation to any loss of profit which may arise from reliance on any information supplied by TFA Global Pte Ltd.
The speaker(s) is neither an employee, agent nor representative of Tradu and is therefore acting independently. The opinions given are their own, constitute general market commentary, and do not constitute the opinion or advice of Tradu or any form of personal or investment advice. Tradu neither endorses nor guarantees offerings of third-party speakers, nor is Tradu responsible for the content, veracity or opinions of third-party speakers, presenters or participants.

Can we test that bottom, please ?ANY Bottom wont the "The Bottom" until it is tested.
from my previous observations it seems to me that it would be very good idea to help crypto with re-testing major bottom.
but be aware of manipulated liquidity grabs on the way. after all it is crypto. they will try to take your position before you profit.
dont trust your exchange, no gentlemans here. just thiefs and greedy centralised exchanges.

CADJPY WILL BULLISH OR BEARISH ?? DETAILED ANALYSISCADJPY is currently forming a clear descending wedge pattern on the 12H chart, which historically signals a high-probability bullish reversal. The price has respected both the upper descending trendline and the lower support line with precision over the past few months, but the recent reaction near the wedge support is showing signs of buying interest. With the current price trading at 103.10, we are at a critical juncture where a breakout to the upside could initiate a strong momentum rally toward the 109.00 target.
Technically, this setup is supported by multiple touchpoints on both trendlines, suggesting a mature wedge structure ready to break. The risk-reward ratio is extremely favorable here, with clear invalidation below 100.90 and upside potential aligned with the upper structure of the broader consolidation zone. A confirmed breakout and candle close above the 104.00 resistance area would likely signal the start of a bullish impulse wave targeting 109.00 in the medium term.
On the fundamental side, CAD is supported by firm oil prices, which have remained elevated due to ongoing geopolitical risks and OPEC+ production cuts. Meanwhile, the JPY continues to weaken as the Bank of Japan remains firmly committed to ultra-loose monetary policy, even as inflation expectations globally stay elevated. This divergence in monetary policy between the BoC and BoJ is fueling carry trade flows, further boosting CADJPY's bullish outlook.
Looking ahead, any signs of risk-on sentiment in global markets, combined with resilient Canadian data, could act as a catalyst for the breakout. With the market positioning leaning heavily on JPY shorts and crude oil demand remaining strong, CADJPY is technically and fundamentally poised for a breakout rally. I'm watching the 104.00 zone closely—once cleared, I anticipate a swift move toward 109.00 with momentum on our side.

Swell: Your Altcoin ChoiceThis is a good choice. If you are already in and waiting for a recovery, the wait is almost over. If you are out and looking to buy, then timing is great. SWELLUSDT is trading at a new All-Time Low with early reversal signals.
We have a reversal signal coming from the candles as well as a rounded bottom still in the making.
The initial drop, is a full down-move, a down-wave or bearish impulse. The last and second drop is very small. It is more likely a flush, rejection or stop-loss hunt. The second drop from late March indicates that there is no longer a bearish wave. This is the last bearish action before the market produces a change of trend.
"The bottom is in" is not necessarily a sure thing. Always be prepared for some more shaking before prices grow, just as a precaution. What is certain, is that the next major phase is a bullish cycle, anything lower would be short-lived and a manufactured market move. The downtrend is over. After going down, the market tends to grow.
I am mapping some targets for you. These are not necessarily the All-Time High, there can be more growth by the end of the 2025 bullish cycle. These can happen in the mid-term. Within 3 months. When considering the long-term, prices can go off the chart.
This is a good pair.
Thanks a lot for this Altcoin Choice.
Namaste.
