BTC/USDT – Weekly Chart Analysis (Long-Term View)BTC/USDT Chart Pattern: Multi-Year Cup and Handle Formation
The chart shows a textbook “cup and handle” formation, a highly reliable bullish continuation pattern. This pattern has played out over several years (2021-2025), indicating long-term accumulation and a breakout attempt.
Cup Phase:
Extended from mid-2021 to early 2024.
Formed a deep and rounded base, often indicating institutional accumulation.
The rounded lows reflect a gradual sentiment recovery from the 2022-2023 bear market.
Handle Phase:
A short-term consolidation after moving above the $70,000-$74,000 resistance area.
Price action pulled back marginally after hitting $110,000, forming higher lows near $85,000.
The structure resembles a bull flag or pennant, which is usually seen before the next upward move.
Key Support and Resistance Areas:
Key Support $70,000–$74,000. Previous resistance turned into support
Psychological Support $85,000 Local Retracement Low
Immediate Resistance $100,000–$110,000 Near ATH, selling pressure area
Long-term Target $130,000+ Measured move from cup pattern
Volume: Volume was high during the breakout from late 2024 to early 2025, which validates the breakout from the cup resistance area.
If BTC breaks above $100,000–$110,000 with strong volumes, we can expect continuation towards:
$130,000 (short-term target)
$150,000–$180,000 (extension based on pattern symmetry)
Bearish Risks:
Failure to hold $85,000 could lead to a retest of the $70K support area.
Sustained breakdown below $70K would invalidate the bullish pattern, but this seems unlikely given the strong fundamentals and macro structure.
If you found this analysis helpful, hit the Like button and share your thoughts or questions in the comments below. Your feedback matters!
Thanks for your support!
DYOR. NFA
Crypto

Alpaca Finance Bullish Cycle Not Over: New ATH $6.99 (PP: 3395%)Alpaca Finance (ALPACAUSDT) already grew a nice 4,367% in April 2025. The market bottom was hit 17-April and really high volume came a day before. Then more volume and strong growth started to happen on a daily basis. Total growth from bottom to the 30-April peak amounts to the number listed above, but it is likely this isn't the end.
This wave of bullish action was just a recovery from a break of a long-term consolidation channel structure. After this wave of growth, the action is "back to baseline." Alpaca Finance is now back to zero based on TA.
You can see clearly the sideways channel on the chart as well as the two rounded bottom pattern.
You can find a new All-Time High projection sitting at $6.99 with a massive 3,395% potential but wait, more targets are also available. There is one at $2.74 for 1,270% and two other targets with one that sits within the previous wick high.
These long wicks tend to remove resistance, and this becomes a bullish situation. All the sell orders that were present all the way to $1.28 were filled when the late April wick high showed up. Now, after some consolidation, the market can resume with additional growth.
In this case you can use a stop-loss, the 11-September 2023 low.
This pair should not be traded by beginners. Beginners should focus on the charts with a bottom entry and price, the ones that I share daily. This is for advanced traders only.
Thanks a lot for your support.
Namaste.

Solana Daily Outlook | Key Levels & Market Momentum👀 Welcome to my Trading View Analysis and Trading Channel Here , we share the latest market analysis, trading signals, and key insights together .
Ready for smarter trades ? ⭐️
⚡️Today , we're going to analyze the SOL( Solana ) coin together on the daily timeframe and find triggers for our positions .
💠 🔍Daily Technical Overview
Solana (SOL) recently broke out of its descending trendline on the daily chart, leading to an impressive 30% price surge. This breakout marked a key shift in market sentiment and highlighted a fresh wave of buyer interest.
Currently, SOL is moving through a distribution phase, where price consolidates and profit-taking occurs. All eyes are on the $152.55 resistance level – a breakout above this zone, backed by solid volume, would present a strong long entry opportunity.
📊 🧠 Fundamental Insights
Solana isn’t just showing strength technically – the fundamentals are also aligning for a bullish outlook:
✅ After a 65% correction, buyers are returning to accumulate at discounted levels.
✅ Ecosystem growth continues, with strong developer activity and use case expansion.
✅ Trading volume is on the rise, supporting the price recovery.
📰 🔥 This Week’s Positive Solana News
Here are the major developments from the past week that are giving Solana a strong boost:
📈 Price Forecast: Analysts now project that SOL could reach $155–$160 by the end of May, with potential upside toward $180 in the near term.
🏦 Institutional Investment: Upexi Inc. has announced plans to allocate $100 million toward purchasing Solana tokens — a major show of confidence.
📊 ETF Filing: Franklin Templeton has filed for a Solana-based ETF to track SOL’s price, which could open the door for more mainstream investment.
🇺🇸 US Government Involvement: Reports suggest the U.S. government is considering Solana as part of its strategic digital asset reserve, highlighting its growing legitimacy.
📝 Conclusion
🚀 Trendline breakout = bullish confirmation
📌 Consolidation = distribution zone
📊 Break above $152.55 = long setup
📉 Previous 65% correction = attractive accumulation zone
📰 Positive news flow = fundamental support for continued growth
I love you all so much . 👀
don't forget about capital management and risk management .
Be careful with your positions . 🥇

Bitcoin MAsAfter a good rally bitcoin had 2 weeks age, now still managing and staying above 20MA for weekly, which is really bullish to me

BTCUSD/BITCOIN | M30 | SELL LIMIT ORDERHey There,
I'm currently waiting for the level I've targeted to enter a sell position on Bitcoin.
I've shared the exact entry level with you below.
Just a heads-up:
This trade carries high risk due to potential market manipulation.
Please trade cautiously and avoid taking on too much risk.
SIGNAL ALERT
SELL LIMIT ORDER (BTCUSD/BITCOIN) 97,000/97,500
🟢TP1:96,850
🟢TP2:96,654
🟢TP3:96,100
🔴SL: 98,390
Traders, your likes are always my biggest source of motivation for me to share analysis. For this reason, I would like to ask each and every one of my followers; please do not miss your likes.
I sincerely thank everyone who supports me with their likes.

OG Strong Chart Will Yield 888% Profits Within 6 MonthsI had to choose between this one and Milan's fan token. I went with this one because the chart is different. Milan (ACMUSDT) has the same chart as Atlético de Madrid (ATMUSDT). So you know what to look for there and you can also know now that ACMUSDT too is also bullish and coming out of major market bottom and low.
OG's chart is much more different though, the bottom was hit in May 2022 with a long-term higher low in August 2024 and another higher low on the 3rd of February 2025. This is a strong pair based on TA and guess what? It is ready now for a new wave of growth.
"Higher lows lead to higher highs," is a saying that I like to repeat over and over because it sounds nice. It doesn't necessarily have to be true but it will be true this time.
Most of the Altcoins produced a lower low in April compared to February or March, the fact that OGUSDT produced a higher low in April is a signal strength. This is enough to support a bullish wave.
The four weeks of bullish consolidation (prices moving slowly higher and the sessions closing green) supports the higher low signal.
Low volume in this instance —context is always needed for a signal to be interpreted correctly—means that the real action is yet to start. Not that the "growth is weak" but rather that there is no growth yet. So this is a positive signal. The fact that the market isn't dropping and is slowly growing and consolidating will lead to a strong bullish jump.
Ok. The technical analysis and signals are in place.
Now that we are done with the technological jargon we can move to the part we like most, take profits targets (TP for short).
Spoiler alert! I use the fibonacci tool to extract my targets against all other methods because this has been proven the most accurate over the years. Period.
» The purple target at ~$43 can yield 888% profits.
» The red target at $32 can yield 634% profits.
» The blue target at $21 can give an easy 380% profits if you were to buy at the current price and sell when this target hits.
Will these target hit or will they miss?
Just wait and see.
I can assure you that the market will turn green. That's all that matters to me.
It matters to me to give you a great entry price and great timing.
You are the one that should focus on securing your profits, it is a win-win-win.
Abundance, love, wealth, health and peace.
Thanks for being with me.
When I am gone, you will miss me.
Namaste.

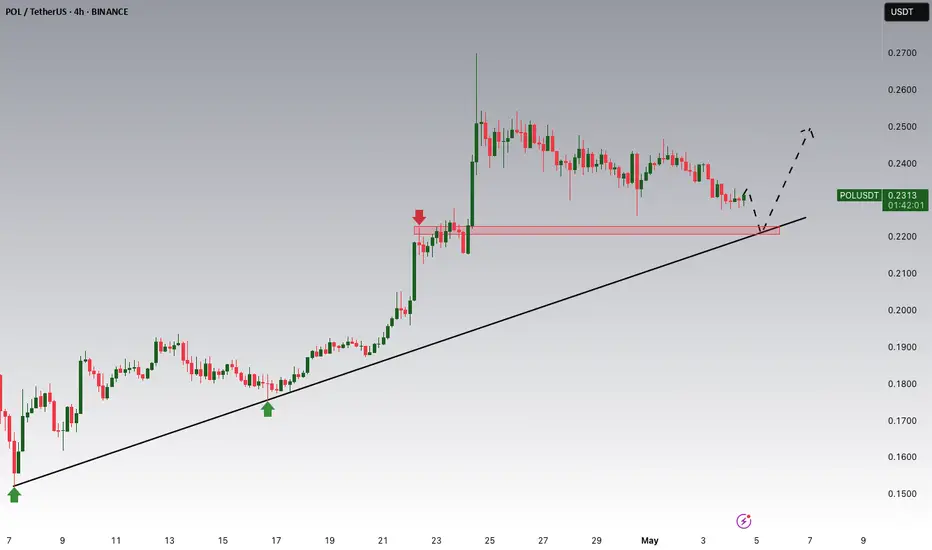
POLUSDT Potential UpsidesHey Traders, in today's trading session we are monitoring POLUSDT for a buying opportunity around 0.2220 zone, POLUSDT is trading in an uptrend and currently is in a correction phase in which it is approaching the trend at 0.2220 support and resistance area.
Trade safe, Joe.
BTC breaks out - Can it sustain the bullish momentum?Over the past week, Bitcoin (BTC) has shown notable strength, forming an ascending triangle pattern, a typically bullish structure that often resolves to the upside. True to form, BTC has now broken out above the triangle's resistance, pushing higher with strong momentum.
-------------------------------
Price target ascending triangle
This breakout sets a technical price target above $98,000, suggesting there’s still significant upside potential if the pattern plays out fully. However, the rally is now approaching a critical test.
-------------------------------
Golden Pocket + POC
BTC is currently moving into a zone of strong resistance, both the Golden Pocket Fibonacci retracement level and the Point of Control (POC) from recent months converge in this area. These technical levels often act as magnets for price and can serve as significant barriers, potentially leading to a pullback or consolidation.
-------------------------------
Stochastic RSI
Adding to the caution, the daily Stochastic RSI remains in overbought territory, where it has lingered for an extended period. While this doesn’t guarantee an immediate reversal, it does suggest that a corrective move could be on the horizon.
-------------------------------
Conclusion
Still, there's a chance BTC could first push toward the psychologically significant $100K level before any major retracement occurs. Traders should keep a close eye on how BTC behaves around this key resistance area, confirmation or rejection here will likely shape the next major move.
-------------------------------
Thanks for your support.
- Make sure to follow me so you don't miss out on the next analysis!
- Drop a like and leave a comment!

XAUUSD Bullish or bearish Detailed AnalysisXAUUSD is currently trading around 3380, continuing its bullish momentum as previously anticipated. The price action has followed the projected path, delivering substantial profits for those positioned early. The next key resistance level is at 3450, aligning with the upper boundary of the ascending channel.
Fundamentally, gold's rally is supported by heightened safe-haven demand amid ongoing geopolitical tensions and a weakening U.S. dollar. Investors are closely watching the upcoming Federal Reserve meeting, with expectations leaning toward a dovish stance, which could further bolster gold prices .
Technical indicators suggest that the bullish trend remains intact, with the price maintaining its position above key moving averages. However, traders should be cautious of potential pullbacks as the market approaches overbought conditions.
In summary, XAUUSD is on track toward the 3450 target, supported by both technical and fundamental factors. Traders should monitor key resistance levels and macroeconomic developments to manage their positions effectively.

Ethereum H4 | Potential bullish bounceEthereum (ETH/USD) is falling towards a multi-swing-low support and could potentially bounce off this level to climb higher.
Buy entry is at 1,732.25 which is a multi-swing-low support that aligns close to the 23.6% Fibonacci retracement.
Stop loss is at 1,650.00 which is a level that lies underneath a pullback support and the 38.2% Fibonacci retracement.
Take profit is at 1,938.37 which is an overlap resistance that aligns with the 78.6% Fibonacci retracement.
High Risk Investment Warning
Trading Forex/CFDs on margin carries a high level of risk and may not be suitable for all investors. Leverage can work against you.
Stratos Markets Limited (tradu.com):
CFDs are complex instruments and come with a high risk of losing money rapidly due to leverage. 63% of retail investor accounts lose money when trading CFDs with this provider. You should consider whether you understand how CFDs work and whether you can afford to take the high risk of losing your money.
Stratos Europe Ltd (tradu.com):
CFDs are complex instruments and come with a high risk of losing money rapidly due to leverage. 63% of retail investor accounts lose money when trading CFDs with this provider. You should consider whether you understand how CFDs work and whether you can afford to take the high risk of losing your money.
Stratos Global LLC (tradu.com):
Losses can exceed deposits.
Please be advised that the information presented on TradingView is provided to Tradu (‘Company’, ‘we’) by a third-party provider (‘TFA Global Pte Ltd’). Please be reminded that you are solely responsible for the trading decisions on your account. There is a very high degree of risk involved in trading. Any information and/or content is intended entirely for research, educational and informational purposes only and does not constitute investment or consultation advice or investment strategy. The information is not tailored to the investment needs of any specific person and therefore does not involve a consideration of any of the investment objectives, financial situation or needs of any viewer that may receive it. Kindly also note that past performance is not a reliable indicator of future results. Actual results may differ materially from those anticipated in forward-looking or past performance statements. We assume no liability as to the accuracy or completeness of any of the information and/or content provided herein and the Company cannot be held responsible for any omission, mistake nor for any loss or damage including without limitation to any loss of profit which may arise from reliance on any information supplied by TFA Global Pte Ltd.
The speaker(s) is neither an employee, agent nor representative of Tradu and is therefore acting independently. The opinions given are their own, constitute general market commentary, and do not constitute the opinion or advice of Tradu or any form of personal or investment advice. Tradu neither endorses nor guarantees offerings of third-party speakers, nor is Tradu responsible for the content, veracity or opinions of third-party speakers, presenters or participants.

KASPER - THE GHOAST OF KASPA (TA + TRADE PLAN) BY BLAŽ FABJANTechnical Analysis for KASPER (KASPER/USDT) by Blaž Fabjan
Trend Analysis:
The chart indicates a rising wedge pattern on the horizon, a bearish reversal signal, which suggests a potential downward price movement after the completion of the pattern.
The price is currently in a consolidation phase, with a series of lower highs and higher lows within the wedge structure.
Support and Resistance Levels:
Resistance: The price has approached a resistance zone around the Wick High level, which indicates selling pressure in this area. A breakout above this resistance level could lead to a continuation of the upward trend.
Support: The Strong Low zone is acting as the lower support for the current price action, with buyers attempting to defend this level.
Indicators:
RSI (Relative Strength Index): Currently at 82.43, which is in the overbought territory, indicating that the asset may be overextended and susceptible to a pullback or correction.
MFI (Money Flow Index): The current MFI reading suggests an inflow of capital into the asset, indicating that the buying pressure is strong. However, if the price hits the overbought region, it could signal a reversal.
Stochastic: The stochastic oscillator is at 96.19, indicating that the price is in an overbought condition and might be due for a pullback or consolidation in the short term.
VMC Cipher B Divergences: The indicator is showing bullish divergence at the recent lows, suggesting that buying pressure could continue, but it needs to be validated by a breakout above resistance.
Volume:
The volume is gradually increasing, which is a positive sign for the continuation of the trend. However, volume spikes during a breakout are crucial to confirm the trend's strength.
Trading Plan for KASPER (KASPER/USDT)
Key Entry Levels:
Breakout Entry: If the price breaks above the resistance zone near 0.00001000, consider entering a long position. Set the take profit target at around 0.00001500 (strong bullish continuation level) for a potential 50% price increase.
Reversal Entry: If the price fails to break the resistance and starts falling towards the Strong Low support level near 0.00000500, consider entering a short position. A move below the Strong Low could signal a reversal of the current uptrend.
Stop-Loss and Risk Management:
Long Position Stop-Loss: Set a stop-loss just below the Strong Low (around 0.00000450) to protect from a sudden price drop. The stop should be tight as this asset is volatile.
Short Position Stop-Loss: If entering a short position, place the stop-loss above the resistance level at 0.00001050 to minimize losses in case of a breakout.
Target Levels:
Short-Term Target (Bullish): If the breakout occurs, consider targeting a price of 0.00001500 based on the rising wedge pattern's projected price target.
Short-Term Target (Bearish): If the asset fails to hold above the support zone and breaks lower, target the 0.00000350 level as the next potential support area.
Trading Psychology:
Patience: This is a volatile asset, and it's important to wait for clear confirmation of a breakout or breakdown before entering the trade.
Risk-Reward Ratio: Aim for a 1:3 risk-reward ratio, which ensures you are risking less compared to the potential reward on each trade.
Monitor Indicators: Regularly monitor the RSI, Stochastic, and MFI for overbought or oversold signals. Additionally, follow volume patterns closely to gauge market momentum.
Exit Strategy:
Exit the position once price targets are reached or if indicators show signs of an exhaustion or trend reversal (e.g., RSI turning downward from overbought levels, stochastic crossing down).
Given the current chart formation and technical indicators, KASPER could be poised for a breakout to the upside, but there is a high risk of a correction given the overbought conditions.
Caution is recommended: monitor price action closely and adjust your strategy accordingly to avoid entering too early in a rising wedge or an overbought market.

KASPY COULD BE THE NEXT BIG THING (TA+TRADE PLAN)Technical Analysis of KASPY (KASPY/USD) BY BLAŽ FABJAN
1. Price Action & Trend Structure:
Falling Wedge (Red Zone): The chart shows a classic falling wedge pattern, a bullish reversal formation. This indicates that the downtrend has slowed down, and a breakout could be imminent.
Descending Triangle (Top Right Zone): This descending triangle formation suggests consolidation near resistance. If KASPY breaks out above the horizontal line of the triangle, a move towards higher targets can be expected.
2. Key Support and Resistance Levels:
Bottom 1 (Green Box): A significant support zone that previously bounced the price upwards. This zone should hold if the price tests it again.
Bottom 2 (Green Box): Another crucial support level showing a potential buying area. This could act as a safety net in case the market dips.
Resistance Levels (Red and Blue Targets): The upper red zone represents significant resistance, where the price might face selling pressure. The chart shows targets aligned with these resistance zones.
3. Technical Indicators:
VMC Clipser (B Divergences): The indicator shows mixed signals with a divergence in the upward movement, suggesting potential reversal or continuation. The positive divergence is noted with green arrows indicating buying opportunities.
RSI (Relative Strength Index): RSI is at 50.97, indicating neutral market conditions. It is not overbought or oversold, which suggests that there is room for price action in either direction.
Money Flow Index (MFI): The MFI value is 54.13, which confirms that there is moderate buying interest. MFI values above 50 suggest positive money flow, supporting potential upside movement.
Stochastic Oscillator: The stochastic oscillator shows a level of 21.93, indicating an oversold condition. This could signal an upward bounce as the market may be ready to reverse.
4. Market Sentiment & Time to Bounce:
The chart annotation “Time to Bounce” suggests a potential upward price movement after consolidating within the rectangle and descending triangle formation. The market sentiment appears to favor a bullish breakout.
Trading Plan
Entry Points:
Primary Entry: If KASPY breaks above the upper boundary of the descending triangle, targeting the breakout point at around 0.0000020 (upper resistance zone), this could be the ideal entry point for a bullish trade.
Secondary Entry (Bounce Play): If the price approaches the support areas (Bottom 1 or Bottom 2), consider entering long positions as the price bounces upward off these zones. The oversold conditions in the stochastic oscillator provide confidence for a potential bounce.
Target Levels:
Target 1: Around the upper red zone resistance (0.0000020), which has already been marked as a target in the chart.
Target 2: The second resistance zone at 0.0000025, aligning with the overall market conditions.
Long-term Target: A breakout could send the price higher to 0.0000035 (or higher), depending on the strength of the breakout.
Stop Loss & Risk Management:
Stop Loss: Place stop loss orders below the support level (around 0.0000015) to minimize losses if the price fails to hold at support. A tighter stop loss could be placed just below the bottom of the falling wedge.
Risk-to-Reward Ratio: Aim for at least a 3:1 risk-to-reward ratio for this trade, ensuring that the potential profit justifies the risk taken.
The KASPY chart shows a favorable setup for a potential bullish move, with a falling wedge pattern and a descending triangle indicating a possible breakout. Key indicators support this outlook, with neutral RSI and a favorable stochastic reading. The trading plan includes strategic entry points, realistic target levels, and prudent risk management.

ETHEREUM: Will Go Up! Long!
My dear friends,
Today we will analyse ETHEREUM together☺️
The price is near a wide key level
and the pair is approaching a significant decision level of 1801$ Therefore, a strong bullish reaction here could determine the next move up.We will watch for a confirmation candle, and then target the next key level of 1810$ Recommend Stop-loss is beyond the current level.
❤️Sending you lots of Love and Hugs❤️

AI Prediction ETH/USD for 24 hour! Intraday trading!May 5, 2025 6:36 pm. ETH/USD. ETH/USD Trading Plan
Long Scenario
- Entry: $1,815 (confirmed by Supertrend long + RSI rising above 40).
- Stop-Loss (SL): $1,790 (below $1,800 support).
- Take-Profit (TP): $1,840 (below $1,850 resistance).
- Trailing Stop: 13 points (2x ATR).
Short Scenario
- Entry: $1,795 (confirmed by breakdown below $1,800 + MACD bearish crossover).
- Stop-Loss (SL): $1,820 (above $1,810–$1,820 resistance).
- Take-Profit (TP): $1,750 (above $1,780 support).
- Trailing Stop: 13 points (2x ATR).

Market Overview (May 5, 2025)
📊 Key Metrics
1. Funding Rate: -0.0024% (on Binance)
— traders are paying to hold short positions, signaling bearish pressure
2. Open Interest (OI): $27.5B, down –3.13% in 24h
— positions are closing, possibly due to liquidations or profit-taking
3. ETF Inflows: +$674.9M (on May 2)
— strong institutional demand, especially into BlackRock’s IBIT
4. Fear & Greed Index: 52 (Neutral)
— sentiment has stabilized after a period of greed
⸻
📈 Market Movement Probability
• Upward: 55%
(potential short squeeze fueled by ETF inflows)
• Downward: 45%
(OI is dropping, market losing momentum)
⸻
Disclaimer: This information is not financial advice and should not be used as the sole basis for investment decisions.

WBETHUSDT D1 | RANK #8👀 Welcome to my Trading View Analysis and Trading Channel Here , we share the latest market analysis, trading signals, and key insights together .
Ready for smarter trades ? ⭐️
⚡️Today , we're going to analyze the WBETH ( Wrapped Beacon ETH
) coin together on the daily timeframe and find triggers for our positions .
The breakout of the descending channel has already been confirmed, as expected. This is a very positive sign for investors! 🚀
1. With this confirmation of the breakout, we can anticipate a solid bullish wave in the coming days. 📈 The market seems to be gaining momentum, indicating the potential for significant price growth.
2. These conditions give us the opportunity to remain optimistic about the increase in asset values and explore exciting opportunities ahead. 💡 It's crucial to stay alert during these thrilling times.
3. Analyzing market trends and staying informed can help us make the most of this favorable situation. 📊 We should leverage this positive momentum to enhance our investment strategies.
4. I hope that with this new trend, we witness even more successes and growth! 🎉 Let's embrace this wave of optimism together and make the best out of the upcoming potential!
I researched this coin on CoinMarketCap on your behalf , and I'm sharing a summary of the information I gathered .
Read carefully , as you need to have this information . 🌈
The WBETH (Wrapped Beacon ETH) token is a protocol token designed to facilitate the use of Ethereum 2.0 on the Ethereum 1.0 blockchain. 🌟 Its primary goal is to enable access to staked Ethereum within the Proof of Stake protocol in the Ethereum 1.0 ecosystem and other decentralized finance (DeFi) protocols. 💼
### Features of WBETH:
1. Usability: WBETH allows users to utilize their staked Ethereum in the ETH 2.0 protocol without actually withdrawing it from its staked status. 🔄
2. Trading and Exchange: Users can trade WBETH just like other tokens on exchanges and decentralized finance platforms. 📈
3. Reward Generation: By holding WBETH, users can benefit from the staking rewards of Ethereum 2.0. 🎉
4. ERC-20 Architecture: WBETH is typically issued as an ERC-20 token, making it suitable for use within the Ethereum ecosystem. 🛠️
### Important Notes:
- While WBETH allows users to have liquidity from their Ethereum assets, they should remain aware of the associated risks and complexities related to regulations and technology. ⚠️
- The conversion rate between ETH and WBETH may vary and be influenced by supply and demand. 💱
Overall, WBETH is an innovative way for users to take advantage of Ethereum 2.0 benefits while still participating in the Ethereum 1.0 ecosystem. 🚀
I love you all so much . 👀
don't forget about capital management and risk management .
Be careful with your positions . 🥇

LAZIOUSDT D1 | RANK #1017👀 Welcome to my Trading View Analysis and Trading Channel Here , we share the latest market analysis, trading signals, and key insights together .
Ready for smarter trades ? ⭐️
⚡️Today , we're going to analyze the LAZIO (S.S. Lazio Fan Token
) coin together on the daily timeframe and find triggers for our positions .
1. LAZIO appears to be primed for a robust bullish rally! 🚀 This is an exciting time for investors as the momentum seems to be building, indicating the potential for significant price growth.
2. The breakout and subsequent retest have already been confirmed, which is an encouraging sign for investors. 📈 Confirmation of these patterns typically leads to increased confidence in the market and attracts more buyers.
3. I’m expecting a potential doubling of value in the coming days! 💰 This positive outlook presents a fantastic opportunity for those looking to maximize their investments.
4. If you’re looking for promising opportunities, this might be the one to keep an eye on! 🌊 Let’s ride this wave together and make the most of the upcoming potential!
I researched this coin on CoinMarketCap on your behalf , and I'm sharing a summary of the information I gathered .
Read carefully , as you need to have this information . 🌈
The S.S. Lazio Fan Token is a type of digital token designed for the fans of the Lazio football club. These tokens allow fans to participate in club activities and decisions. Here are some key pieces of information about this token:
1. Participation in Polls: Token holders can take part in various polls conducted by the club. These polls may include choosing new jersey designs, slogans, and even naming certain areas of the stadium. 🗳️
2. Rewards and Perks: Holders of the S.S. Lazio Fan Token may gain access to special rewards and perks, such as discounts on match tickets, meet-and-greet opportunities with players, and participation in exclusive events. 🎟️
3. Socios Platform: This token operates on the Socios .com platform, which allows football fans to engage with their favorite clubs using blockchain technology. 🌐
4. Trading and Volatility: Like other cryptocurrencies, the value of the S.S. Lazio Fan Token can experience fluctuations and change based on market demand and supply. 📉
These tokens provide a fantastic opportunity for fans to establish a closer connection with their club and participate in important decision-making processes. 🤝
I love you all so much . 👀
don't forget about capital management and risk management .
Be careful with your positions . 🥇

SANTOSUSDT D1 | RANK #759👀 Welcome to my Trading View Analysis and Trading Channel Here , we share the latest market analysis, trading signals, and key insights together .
Ready for smarter trades ? ⭐️
⚡️Today , we're going to analyze the SANTOS(Santos FC Fan Token
) coin together on the daily timeframe and find triggers for our positions .
🚀 With the breakdown of the symmetrical triangle range and horizontal resistance, and once both of these barriers are successfully cleared, Santos is poised to make a strong upward move towards $4. 💵
✨ This potential movement presents an excellent opportunity for investors, allowing them to capitalize on significant price action. 📈 The anticipated rise towards $4 may stem from increasing demand and positive signals in the market, indicating a favorable trend. 📊
👀 Therefore, it is essential to closely monitor these key levels and utilize technical analyses to make informed decisions. 🔍 With the right strategy and timely execution, investors could potentially enjoy substantial gains as the market unfolds. 💪💰
I researched this coin on CoinMarketCap on your behalf , and I'm sharing a summary of the information I gathered .
Read carefully , as you need to have this information . 🌈
The Santos FC Fan Token is a digital token dedicated to the fans of Santos Futebol Clube. This token is part of a new trend that allows fans to participate in decisions and activities of the club, as well as enjoy exclusive benefits. ⚽️
Features and Benefits of the Santos FC Fan Token:
1. Participation in Decision-Making: Token holders can participate in polls and voting regarding club decisions. For example, they may have a say in choosing the color of the team’s jerseys or naming certain activities related to the team. 🗳️
2. Exclusive Benefits: Token holders may enjoy specific advantages such as discounts on match tickets, access to special events, or meet-and-greet opportunities with the players. 🎟️
3. Socios .com Platform: The Santos fan tokens are typically offered on the Socios .com platform, which is a digital marketplace for fan tokens. Fans can buy, sell, or even trade these tokens. 💻
4. Increased Interaction with the Team: These tokens enable fans to have a more direct connection with the team, fostering a greater sense of closeness to their favorite club. 🤝
Fan tokens can be an excellent way for fans to show their support for the team and actively participate in the life of the club. For more precise information, it is advisable to visit the official websites of the club or Socios .com. 📲
I love you all so much . 👀
don't forget about capital management and risk management .
Be careful with your positions . 🥇

LISTAUSDT | Rank : 1009👀 Welcome to my Trading View Analysis and Trading Channel Here , we share the latest market analysis, trading signals, and key insights together .
Ready for smarter trades ? ⭐️
⚡️Today , we're going to analyze the ALPINE (Alpine F1 Team Fan Token
) coin together on the daily timeframe and find triggers for our positions .
✨The outlook for the coming days looks very promising . We are witnessing a breakout from the descending trendline , which typically indicates positive changes in price . Additionally , a retest of this trendline has been performed and confirmed that the breakout is genuine and can be trusted .
🚀Moreover , the horizontal resistances that usually hinder price increases have now been cleared , and this is a sign of the strength of the upcoming bullish trend . In lower time frames , a bullish flag pattern has also formed , which generally indicates the potential for further price increases .
📊Given these conditions and the patterns observed in the market , we expect the price to double in the coming days , creating great investment opportunities . Therefore , we can confidently look forward to the bullish trend ahead and be prepared to enter the market! "
I researched this coin on CoinMarketCap on your behalf , and I'm sharing a summary of the information I gathered .
Read carefully , as you need to have this information . 🌈
The Alpine F1 Team Fan Token, also known by the symbol "ALPINE," is a type of non-fungible token (NFT) and fan token associated with the Alpine Formula One team. These tokens allow fans to participate in decisions related to the team and enjoy specific benefits.
### Key Features of the Alpine F1 Team Fan Token:
1. Fan Participation: By holding this token, fans can take part in polls and decisions concerning the team. These decisions may include choosing the color and design of the team's outfits or even naming certain elements of the team.
2. Benefits and Rewards: Holders of fan tokens typically receive special advantages such as ticket discounts, access to exclusive events, or closer interaction with the team.
3. Socio s.com Platform: The Alpine F1 Team fan tokens are usually offered on the Socios .com platform, allowing fans to buy and sell their tokens.
4. Exclusive Experiences: Token holders can gain access to unique and exclusive experiences, such as meeting drivers, attending special events, and more.
These tokens enable fans not only to show their support for the team but also to play a part in the team's management and decision-making processes. For more precise information, it's always recommended to refer to official resources and the team's website.
I love you all so much . 👀
don't forget about capital management and risk management .
Be careful with your positions . 🥇

Strategy $MSTR hits resistance, what will it do?
NASDAQ:MSTR has rebounded from the bottom fairly fast compared to other stocks and indexes. It's even performed better than Bitcoin itself. It is up about 65% from the low we set a few months ago. However it should be hitting heavy resistance now near 395-400 and above is only heavier resistance. It's time for a pullback and a breather for MSTR. Target is the Point of Control near $350, before going higher. However we could turn bullish again before reaching $350.
I personally know someone who played with fire by buying NASDAQ:MSTR options calls while it was dropping before, meaning he was trying to catch a falling knife and got burnt finally. He lost nearly $500,000 because of it. So I don't mess with options personally, however I will margin trade with stocks and trade futures, forex and leverage trade cryptocurrencies.

MSTR (Strategy) coming up to $395, the smaller resistance levelNASDAQ:MSTR has rebounded from the bottom fairly fast compared to other stocks and indexes. It's even performed better than Bitcoin itself. However it should be hitting heavy resistance now near 395-400 and above is only heavier resistance. It's time for a pullback and a breather for MSTR. Target is the Point of Control near $350, before going higher. However we could turn bullish again before reaching $350
I personally know someone who played with fire by buying MSTR options calls while it was dropping before, meaning he was trying to catch a falling knife and got burnt finally. He lost nearly $500,000 because of it. So I don't mess with options personally, however I will margin trade with stocks and trade futures, forex and leverage trade cryptocurrencies.


Kadena: Your Altcoin ChoiceThis is a fractal. The same pattern that was present in 2024 is also developing in 2025.
A bullish wave that is corrected into a long-term accumulation zone. Then sideways and consolidation leads to a bullish breakout with a major high. Kadena can easily move back to $2 in the mid-term. 1-3 months.
This wouldn't be the end of the bullish action, there is more for 2025 as Kadena (KDAUSDT) has potential to grow much higher, but this is a start.
Technical analysis: There is a really high volume day in early February. Then we have a shy lower low in in April, two days ago. This tells us that the bearish wave is over.
When Kadena was crashing, the decline was very steep. The lower lows are easy to appreciate; see the 1,2,3 on the chart. Now, after #3 it goes sideways and then the shy lower low. This means that the bearish momentum died down, it is over. After bearish momentum wanes it is only a matter of time before the market turns.
The bars pattern is for illustration only. It can start growing higher and faster than shown on the chart. Like stronger swings and the first up-move strong and also higher volatility. So don't be guided by the drawing. We focus on resistance and support.
The support we use to map our entry price. The resistance to take profits, to sell. To take money home. Both are really important. It is not only the right timing and price, but also the right time to exit.
No leverage = no risk. Buy and hold long-term.
Only consider leverage/margin when you've been successful for 2-3 years straight trading spot.
No need to gamble, Cryptocurrency is here to stay.
If you can't make money slow, you wont be able to make it fast.
If you can't appreciate small amounts, you won't be able to accept and appreciate big amounts.
So first we need to learn to take profits. Make a habit of withdrawing even if small portions.
Be grateful for your wins. Win, win, win. Buy... wait... sell. That's a win. Check!
Then again. Buy... wait... sell. Another win. Check!
When in the green, consider trimming out some positions. If it keeps rising, that's great. Your profits are secured. If the pair drops, good, you already sold and secured some profits.
Do not become greedy. Focus on the long-term.
Cryptocurrency is a new market but it is here to stay.
Trade spot. Focus on the basics. Make a plan, it is a mental exercise. This will create a vision where you win in the end. It will also prepare you for all possible scenarios, this is what leads to success. With a plan, there is no stress when the market shakes. Without a plan, you can close a good position due to a small drop. Look at Bitcoin, it dropped but only to recover in a matter of days. Those without a plan freaked out, panicked and sold everything at a loss. The greedy ones and gamblers got liquidated because of wrong timing and bad choices. Wouldn't it be better to earn a sure 200%, than to lose everything trying to make a risky 1,000%?
The sure 200% is better because the risky 1,000% never comes. It turns into a race, a gamble; trying to catch the market at every turn. Like this it will never work.
Go out, detach. Engage nature and have some fun.
Comeback with a clean mind, build a plan and the next time you decide to trade, you will see how fast and easy your money grows.
Thanks a lot for your support.
...
By the way, you have to trust me.
What's the point of reading from the most advanced Cryptocurrency analyst in the world if you don't trust what I have to say?
Namaste.
