BTC 4H – Weak Bulls, Range Breakdown Ahead?Trading gets much easier when you understand the strength and weakness of trends and the market cycle. Right now, BTC is showing us clear signs of bull exhaustion.
🔍 Technical Breakdown:
Price has been trapped between FWB:88K resistance and GETTEX:82K support, forming a visible trading range.
Recently, BTC failed to even reach the middle zone of the range, which reflects weak buying momentum.
With multiple rejections and bearish pressure building, the GETTEX:82K support is likely to be broken soon.
🧭 Next Target: If the breakdown occurs, expect price to fall below $80K, targeting the liquidation zones highlighted on the chart.
💡 The structure is shifting bearish—prepare accordingly.
📊 Stay sharp and follow for more accurate market insights! 🔔
Crypto

BRIEFING Week #14 : What a Mess !Here's your weekly update ! Brought to you each weekend with years of track-record history..
Don't forget to hit the like/follow button if you feel like this post deserves it ;)
That's the best way to support me and help pushing this content to other users.
Kindly,
Phil

Trading opportunity for OMUSDTBased on technical factors there is a Sell position in :
📊 OMUSDT
🔴 Sell Now or by Breakout
🪫Stop loss 6.7000
🔋Target 5.0000
📏 R/R 2,2
💸RISK : 1%
We hope it is profitable for you ❤️
Please support our activity with your likes👍 and comments📝

$ETC on bottom"Ethereum Classic is currently in a range box on the weekly timeframe and is now at the bottom of the channel. It has the potential to move up to the top of the box. After confirmation, you can consider entering a long position."

BTCUSD - Messy range, upside more probableBitcoin continues to navigate a messy consolidation range between $80,000 and $89,000, with the current price hovering around $84,002. This choppy price action reflects market indecision following the significant decline from the $100,000 area in late January. Despite the lack of clear direction in the short term, the higher probability move appears to be to the upside, with potential targets near the orange resistance level at $88,786. Supporting this bullish bias is the strong bounce from the March lows around $76,500 (highlighted by the blue support zone), suggesting buyers remain active at lower levels. The recent series of higher lows also indicates strengthening bullish momentum within the range. Traders should watch for a decisive break above the current congestion area, which could accelerate the move toward the upper resistance and potentially open the path for a retest of the psychological $90,000 level.
Disclosure: I am part of Trade Nation's Influencer program and receive a monthly fee for using their TradingView charts in my analysis.

ICPUSDT READY TO FLY AGAIN ?? ICPUSDT is currently forming a classic falling wedge pattern on the chart, which is widely recognized as a bullish reversal signal. The price has been compressing within this narrowing range and is now approaching a key point where a breakout is highly likely. With strong support being respected and buyers gradually stepping in, the setup is aligning well for a potential upside move.
Volume levels have been steadily increasing, confirming growing investor interest in Internet Computer (ICP). This increasing participation from traders and investors alike can often serve as a reliable indicator that a breakout may occur soon. Technical indicators such as RSI and MACD are also hinting at a momentum shift that aligns with a bullish scenario.
Given the strength of this chart formation and the positive volume dynamics, ICPUSDT could potentially see a price gain in the range of 90% to 100%+ from current levels. The risk-to-reward ratio is favorable, especially for those who are entering early before the breakout confirms with stronger candles above resistance. A retest of the wedge breakout, if it happens, could also provide a second opportunity to enter.
ICP is also gaining traction among long-term investors due to its unique blockchain technology aimed at decentralizing the internet. The ongoing development and community support around the project adds more fundamental strength to this setup. Keep an eye on it for confirmation of the breakout!
✅ Show your support by hitting the like button and
✅ Leaving a comment below! (What is You opinion about this Coin)
Your feedback and engagement keep me inspired to share more insightful market analysis with you!

XRP Weekly-Monthly Analysis / Retracement Levels for BuyTHEN - NOW@ XRP Weekly-Monthly Analysis / Retracement Levels for Buy (...and we keep going)
Weekly - Monthly trend: Bearish
Chart Pattern: Head & Shoulders (H&S) - Bearish Continuation Pattern
Bearish Candlesticks signals:
HANGING MAN (Bearish, Single Candlestick pattern) / Weekly Timeframe / 09 DEC 2024
BEARISH ENGULFING (Bearish, Double Candlestick pattern)/ weekly Timeframe / 27 JAN 2025
TWEEZER TOP (Bearish, Double Candlestick pattern) / 1 Day timeframe / 20 FEB 2025
FALLING THREE METHODS (Bearish, five-fold Candlestick pattern) / 1 Day timeframe / 07 MAR 2025
BEARISH ENGULFING (Bearish, Double Candlestick pattern)/ weekly Timeframe / 24 MARCH 2025
Retracement Fib Price Levels:
0.00% (3.4000)
23.60% (2.6879)
38.20% (2.2474)
50.00% (1.8914)
61.80% (1.5353)
78.60% (1.0284)
100.00% (0.3827)
Good prices for buy (the lower the better):
61.80% (1.5353) – Golden Zone / Golden Pocket
78.60% (1.0284) – Entry Zone
Between 78.60% (1.0284) and 100.00% (0.3827) is the Risk Zone, which we have the Neckline of the ‘’ Quadruple Bottom Pattern ‘’ at the price range ‘’ 0.6291 – 0.7850 ‘’

LTC ANALYSIS (support & resistance)🔮 #LTC Analysis 🚀🚀
💲💲 #LTC is trading between support and resistance area. There is a potential rejection again from its resistance zone and pullback from its major support area. If #LTC sustains above major support area then we will a bullish move till its major resistance area
💸Current Price -- $82.20
⁉️ What to do?
- We have marked crucial levels in the chart . We can trade according to the chart and make some profits. 🚀💸
#LTC #Cryptocurrency #DYOR

IP ANALYSIS🔮 #IP Analysis 💰💰
🌟🚀 As we can see that #IP is trading in a symmetrical triangle and there was a breakdown of the pattern. Last time there was a bullish move from the same support level. We can expect again a bullish momentum from its major support level🚀🚀
🔖 Current Price: $4.190
⏳ Target Price: $5.500
#IP #Cryptocurrency #DYOR

TONUSDT BuyTON Buy signal on H4 chart. Daily trend is strong enough to push price higher. Risk reward 1/5

ETHUSDT - Bearish Continuation Within a Descending StructureMarket Overview:
Ethereum (ETH) remains in a well-defined downtrend, consistently forming lower highs and lower lows. The market structure remains bearish, with price respecting the descending trendline. Currently, ETH is showing signs of a corrective move within this broader downtrend, approaching a key Fair Value Gap (FVG) region that could act as a supply zone before a potential continuation to the downside.
Technical Insights:
- The long-term downtrend is intact, as demonstrated by the trendline resistance capping any bullish attempts at recovery. Until price successfully breaks above this trendline with strong momentum, the bearish outlook remains dominant.
- A major support level has been tested multiple times, indicating strong demand in this area. However, repeated retests of support without significant bullish follow-through increase the likelihood of a breakdown.
- The price is currently retracing into an FVG region, which aligns with previous structural resistance. This could serve as an ideal area for sellers to re-enter the market, pushing price lower towards new lows.
Potential Scenario:
If price rejects the FVG zone and fails to break above the descending trendline, the bearish trend is expected to resume. A strong rejection here could lead to increased selling pressure, targeting the key support zone below. If this support breaks, ETH could see a continuation of its larger downtrend, potentially reaching lower price levels.
Risk Considerations:
While the overall trend remains bearish, traders should be cautious of any sudden shifts in momentum that could invalidate the bearish thesis. A strong bullish breakout above the descending trendline would suggest a change in market structure, requiring a reassessment of the outlook. Additionally, macroeconomic factors and broader market sentiment, including Bitcoin’s movement, could influence Ethereum’s price action.
Conclusion:
ETH remains in a clear downtrend, with price currently testing a critical FVG zone within a bearish structure. Unless a significant breakout occurs, the market is likely to continue its descent, with sellers targeting the major support area. Traders should closely monitor price action in the FVG zone for confirmation of the next move.

SOLUSDT - Wave 5 Completion into resistance zoneThis 1-hour chart of SOLUSDT (Solana Perpetual Contract) showcases a potential 5-wave Elliott impulse structure forming within a larger resistance zone.
- After breaking down from the highlighted resistance range (roughly $122–$129), SOL is currently retracing upward in what appears to be an impulsive 5-wave correction.
- Waves (1) through (4) seem to be in place, with Wave (5) projected to complete just below or near the resistance zone again.
- A potential bearish reversal is anticipated upon the completion of Wave (5), likely targeting support around the $120–$121 level.
Traders should monitor the price reaction near the $126–$128 region for rejection signals. A failure to break and hold above resistance could validate the short scenario, while a clean breakout could invalidate the bearish outlook and signal continuation.
Tight stop-loss management and confirmation through volume or momentum indicators are recommended before entering a trade.

levels to watch I had previously highlighted a potential top around the 100-108k range, with a measured target of around the 75k level. The market did, in fact, drop to around 76k. For now, it's respecting the uptrend channel, and we can expect the market to target 90,000. If those levels are breached, it could push the market above 100,000, with new highs potentially reaching around 125,000, as I mentioned in my earlier article.
ETH might be about to melt facesSentiment as negative as it could be, no real inflows for weeks - bottom sentiment? Check.
Sudden massive inflows? Check!
This is not a trade idea. If you trade this, be careful - who knows right now.

SOLUSDT | Elliott Wave Projection – Next big Move Incoming 50%+BINANCE:SOLUSDT
The chart is probably currently developing a five-wave impulsive structure (1)-(2)-(3)-(4)-(5), suggesting a potential bullish movement towards the 174-175 USD resistance zone before a larger correction unfolds.
📈 Bullish Setup:
- A corrective A-B-C structure seems complete, with a potential impulsive wave (1)-(5) forming.
- Price is reacting at a strong demand zone, initiating Wave (1) upwards.
- Possible target for Wave (5) lies near **174-175 USD**.
📉 Bearish Continuation Afterwards
- After reaching the projected high, expect a sharp rejection and reversal.
- The final bearish target lies within the "End of Bear" zone (~108-109 USD).
---
### 🔹 Key Levels to Watch:
✅ First Bullish Target: ~174-175 USD
⚠️ Critical Support Zone: 108-109 USD
---
### 📌 **Trading Plan:**
1️⃣ Long Opportunity: If price respects the current support, target Wave (3)-(5) completion near 174 USD.
2️⃣ Short Confirmation: If price rejects at resistance, a larger bearish wave is expected.
3️⃣ Final Bear Target: 108-109 USD zone for possible long-term support.
🚨 Risk Management:
- Stop-loss below 111 USD for longs.
- Wait for confirmation before shorting after rejection.
💬 What do you think? Will SOL hit 175 USD before the final drop? Comment below!

Bitcoin's Buy Zone Revealed: The R/Evolution Of FinanceFor this bull-market, the buy-zone can extend as high as $100,000. This is because Bitcoin is set to grow above $160,000 to reach $180,000 and even up to $200,000 in the latter part of 2025. So even $100,000 can be a good entry for total profits of 100% when we reach 200K... If it goes higher, better!
Let's try again.
How are you feeling today?
A new day, a new chart; a great market.
While Bitcoin is solid right now, price-wise, it is still trading within our buy-zone.
Below $90,000 Bitcoin is an awesome buy. Have people been telling you this lately?
Yes? No!
No??? I am shocked. This is pure evil.
Bitcoin is now a great opportunity, a great buy when you consider that it will be trading 50% higher in a matter of months. Even better when you consider that everything that is Crypto related is set to grow.
Well, it is no problem, I am here to show my support.
Bitcoin is set to rise and it will rise really strong.
The last chance to buy at low prices is present and available now.
Bitcoin is an awesome buy below $90K.
Anything below 90,000 is great.
Below 80,000 is awesome but a rare opportunity and likely gone. This kind of price was only available for a few hours in 2025. Bitcoin has never closed below 80K weekly in its history. Were you aware of this fact?
The saying normally goes, "Sell in May and go away."
In 2025, this won't be the case.
The saying now is, "Buy everything now and become rich."
"Buy everything and hold strong."
Cryptocurrency is set to rise. Bitcoin is still trading at a nice price within our long-term accumulation-entry (buy) zone. The time is now.
Regardless of your strategy, your system, your method or your plan; accumulation is great.
You can accumulate now. If prices drop, buy more. If prices rise, buy more. When the rise becomes strong, hold. When the top is in or close, start to take profits because after a strong bullish phase comes a correction. You don't want to be caught holding during the correction. You can buy when prices are low. Hold as the market grows. Sell when the market peaks. If you sell when the market peaks, you can buy back-in when the next low is in. There is plenty of time to decide and take action. There is no way to miss a good entry.
Consider the chart and market now. Bitcoin has been sideways for months. Many months we have time to plan and buy. It will be the same after the end of the bullish cycle, so it will be wise to take profits when prices are up.
Buy and hold now. Sell later when everything grows.
I will be here to alert you of great timing to sell at the top.
Right now we are at the bottom. Nothing more needs to be said.
Bitcoin is trading within our long-term buy-zone.
You know what to do.
Take action.
Thanks a lot for your continued support.
Cryptocurrency was invented to usher a financial revolution. A revolution that is beneficial for all those involved. Everybody can win with Crypto, even the banks, if they adapt to the evolution of finance.
Imagine going against email and the Internet because it is new and you are the owner of the mailbox.
In retrospect, we know this to be simply unreasonable, we can only adapt and change because reality is always changing, no matter what our beliefs are or preferences. Today it is the same.
We have new money and humanity will never look back again.
We are in the early days of the Internet. The early days of Crypto. Those taking action now, will be looking like geniuses 10-20 years ahead. It is not too late. It is pretty early. Really early. Crypto is less than 20 years old. There are Bitcoins to be mined until 2140.
Join the revolution now, become the evolution of finance you yourself and get rich in the process.
Thank you for reading.
Namaste.

Solana - The Bullrun Is Not Over Yet!Solana ( CRYPTO:SOLUSD ) might create another move higher:
Click chart above to see the detailed analysis👆🏻
As we are speaking Solana is sitting at the exact same level as it was about 3.5 years ago in the end of 2021. In the meantime we saw a lot of volatility and Solana is now once again retesting a major previous support level. Despite the harsh recent drop, the bullrun remains valid to this day.
Levels to watch: $120, $250
Keep your long term vision,
Philip (BasicTrading)

BTCUSD: Conservative September Target $150kBitcoin remains neutral on its 1W technical outlook (RSI = 46.307, MACD = 1999.100, ADX = 44.501), firmly supported on top of the 1W MA50. On this analysis you see the Channel Up that dictated the price action of the last three Cycles. Since December 2023 BTC has traded solely inside the 0.382 - 0.618 Fibonacci Zone, the median zone of the Channel Up. The Theory of pre-Halving / post-Halving symmetry implies that the time range from the Cycle Bottom to the Halving is almost the same as the time from the Halving to the Cycle Top. Since on the current Cycle, the time from the Bottom to the Halving has been 76 weeks, in theory the Top should be another 76 weeks from the Halving. We take the worst case estimate of 74 weeks like the 2017 Top. That's the end of September. And with regards to the target, a conservative estimate is just over the 0.5 Fib at 150k, like the highs of December 2024 and March 2024.
## If you like our free content follow our profile to get more daily ideas. ##
## Comments and likes are greatly appreciated. ##

ADA Spot Trade Setup – Support Level OpportunityCardano (ADA) is currently sitting at a key support zone, presenting a solid risk-to-reward long opportunity if bulls can hold the level.
🛠 Trade Plan:
Entry: $0.63 – $0.70
Take Profit Targets:
$0.78 – $0.84 (First Target)
$0.96 – $1.02 (Extended Target)
Stop Loss: Just below $0.58

ATOMUSD: Channel Down bottomed. Strong buy signal.Cosmos turned bullish on its 1D technical outlook (RSI = 60.498, MACD = 0.008, ADX = 27.015), which raised 1W to a neutral state. This is perfectly aligned with the market structure at the moment, which is a technical rebound at the bottom of the 3 year Channel Down. The 1W RSI is on a HL trendline, which is a bullish divergence as far as the Channel's LL are concerned. This means that there is potential to break this Channel to the upside, but until this happens, we will be targeting the 0.786 Fibonacci retracement level (TP = 9.500), like the previous bullish wave did.
## If you like our free content follow our profile to get more daily ideas. ##
## Comments and likes are greatly appreciated. ##

XRP/USD LONG/SHORT PLAYOUTSXRP/USD long
Entry Price 1: $2.10
Entry Price 2: $1.70
Stop Loss: $1.20
Take Profit 1: $2.50
Take Profit 2: $2.80
Take Profit 3: $3.20
Take Profit 4: $3.50

Ethereum Analysis - Bull Trap - Don't Buy!COINBASE:ETHUSD recently tapped into the 1,800$ order block, but rather than signaling a bullish reversal, this level appears to be pure inducement. There is no fair value gap above this zone, meaning there’s no true imbalance that price needs to mitigate. This suggests that smart money is not positioning for higher prices here, but instead using this level to lure in retail longs before engineering a deeper move to the downside.
The broader market structure remains bearish, with price continuously making lower highs and lower lows. While many traders may see the 1,800 order block as a support level, the absence of a fair value gap indicates that this area lacks real institutional interest. Instead, it serves as a liquidity pool where market makers can absorb buy orders before driving price lower. The true liquidity targets lie below, particularly around the 600$ levels, where a significant number of stop losses and liquidation points are resting. These levels act as magnets, and until they are taken, the probability of a sustained bullish move remains low.
Additionally, the inefficiencies left in the previous sharp upward move suggest that price still has unfinished business to the downside. Smart money thrives on liquidity, and the clean lows below 600$ offer an attractive area for a deeper sweep before any meaningful bullish expansion can take place. This is a classic case of market manipulation, where early longs are baited into the market just before a significant downside move clears out weaker hands.
Once liquidity has been swept from the 600$ regions, the probability of a true reversal increases. At that point, institutional players will have accumulated enough liquidity to justify a move higher. The most logical upside target following this sweep is the 2,700 order block, which aligns with a previous imbalance and a major area of institutional interest. However, until the sell-side liquidity is fully taken out, any attempt at longs is premature and likely to result in being used as exit liquidity for smart money.
In conclusion, the current price action is a textbook example of liquidity engineering. The move down into 1,800$ was a carefully orchestrated inducement to trap buyers before a deeper price correction. The most probable scenario is a continued decline to sweep liquidity below 600$, at which point smart money will begin repositioning for a true bullish move toward 2,700. Until then, every attempt to push higher is likely just part of a larger manipulation cycle designed to fuel the next major market move.

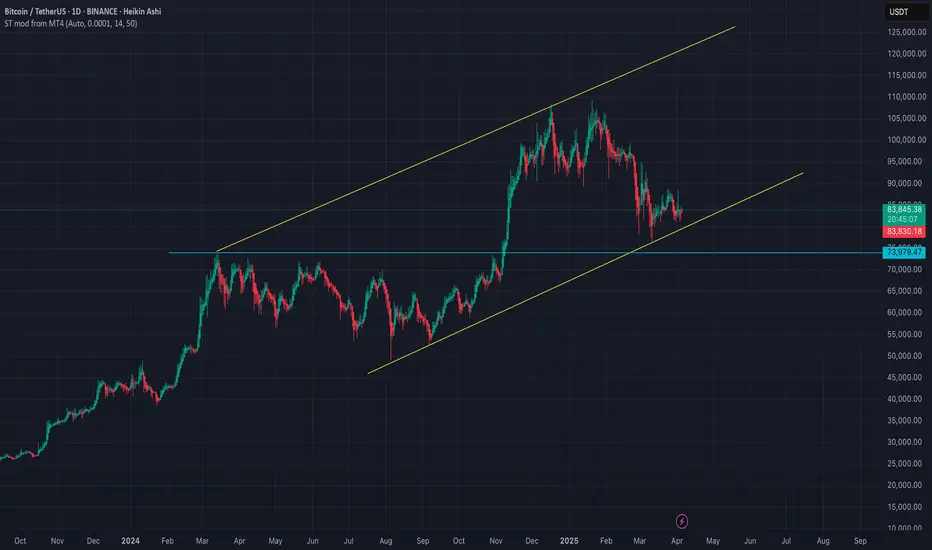
Bitcoin may continue grow inside upward channel to seller zoneHello traders, I want share with you my opinion about Bitcoin. Looking at the chart, we can observe how Bitcoin corrected down to the support level, which also aligned with the buyer zone. From there, the price started to rise. It didn’t take long for BTC to reach the resistance level, which matched up with the seller zone. After breaking through that level, the price began consolidating within a range. Throughout this range, Bitcoin tested the upper boundary several times, but on the last attempt, it reversed and began to decline. The drop continued until it broke through the 86500 level, effectively exiting the range and pushing lower toward the next support. Once the price reached that area, it broke below the level and even dipped under the buyer zone, but quickly reversed and started climbing within an ascending channel. Inside this channel, BTC pushed up to the 83500 level, broke through it again, and maintained bullish momentum. At the moment, Bitcoin is trading within the channel, and I anticipate a potential correction back to the lower boundary of the channel, followed by continued growth toward the seller zone and a break of the resistance. For this scenario, my target is set at 87000 points. Please share this idea with your friends and click Boost 🚀
