what do you think about Bitcoin's performance todayHey friends 👋, what do you think about Bitcoin's performance today and what's happening in the crypto market? 🤔
From my point of view, and as we've explained before, there's a minor correction during the uptrend, especially since Bitcoin's dominance showed a noticeable rise after breaking the uptrend line two days ago on March 24th 📈 and is now climbing again. This is actually very healthy and normal 🧘♂️, and on the contrary, I see the market behaving in a balanced and logical way.
The rule says in all markets, before any rise, there must be a drop to attract liquidity and new buyers 💸. All these are temptations to enter, so I'm very, very optimistic about what's coming next 🚀.
Bitcoin faced fierce resistance around the 88,000 - 88,500 levels and couldn't close positively and fully on the daily timeframe 🛑, so expect it to move in accumulation zones for a period of time, maybe a week or two ⏳. After that, we'll see a good correction scenario, and then let's head to the moon 🌙 at 114,000 - 120,000.
What do you think of this detailed analysis, friends? I'm waiting for your opinions to share our experiences with everyone in this wonderful market 💬.
Crypto

BITCOIN on a Bull Flag that targets $94000.Bitcoin is trading inside a Channel Up since the March 11th market bottom.
The recent 2day pull back is a Bull Flag that just hit the 0.5 Fibonacci retracement level.
Ahead of an emerging Golden Cross (4h), this is a triple buy signal.
Trading Plan:
1. Buy on the current market price.
Targets:
1. 94000 (the 2.0 Fibonacci extension).
Tips:
1. The RSI (4h) is also rebounding on its 2 week Rising Support. An additional strong buy signal.
Please like, follow and comment!!

ETHEREUM Is $14000 even possible??Short answer? Yes it is.
Ethereum / ETHUSD is trading inside a 7 year Channel Up and lately has found itself under the 0.618 Fibonacci retracement level for the first time since November 2020.
This is technically a temporary overreaction like the bullish breakout over the 0.382 Fib in March 2024.
Based on the final year rallies inside this Channel Up, we can clearly see that, though very optimistic, $14000 is within reach and won't even be at the top of the Channel Up.
Follow us, like the idea and leave a comment below!!

DOGEUSD: This is the rally that will deliver $1.00Doge is neutral on its 1D technical outlook (RSI = 52.126, MACD = -0.009, ADX = 40.011), recovering from its prior oversold state and testing the 1W MA50 for the first time in 3 weeks. The current rebound is being made after touching the 1W MA200, which is technically the new long term bottom, similar with August 5th 2024 and October 9th 2023. As shown, this is a once in a year buy opportunity that aims for the 1.618 Fibonacci extension on the HH trendline. The trade is long, TP = 1.000.
## If you like our free content follow our profile to get more daily ideas. ##
## Comments and likes are greatly appreciated. ##

AVAX triangleAfter a heavy correction halfway through the bullrun, avax pulled back to a bullish trendline.

BTCUSD: Can $160k be a very 'pessimistic' target estimate?Bitcoin is neutral on its 1W technical outlook (RSI = 50.359, MACD = 2868.500, ADX = 51.194) and having rebounded almost on its 1W MA50, there couldn't be a better buy opportunity for the rest of the year. Basically the price is now ranged inside the 1W MA50 and top trendline of the Pi Cycle, while the 1W CCI hit the -100.00 oversold limit. This has been the most efficient buy entry in August 2024 August 2023 even on the Cycle before in June 2021.
Even if the market doesn't make an 'excessive top' above the Channel Up, like the last two Cycles, hitting $160,000 would still be under the top of the Channel Up and the top of the Pi Cycle. No matter how high this target seems now, it will still be a pessimistic, 'bad case' scenario.
## If you like our free content follow our profile to get more daily ideas. ##
## Comments and likes are greatly appreciated. ##

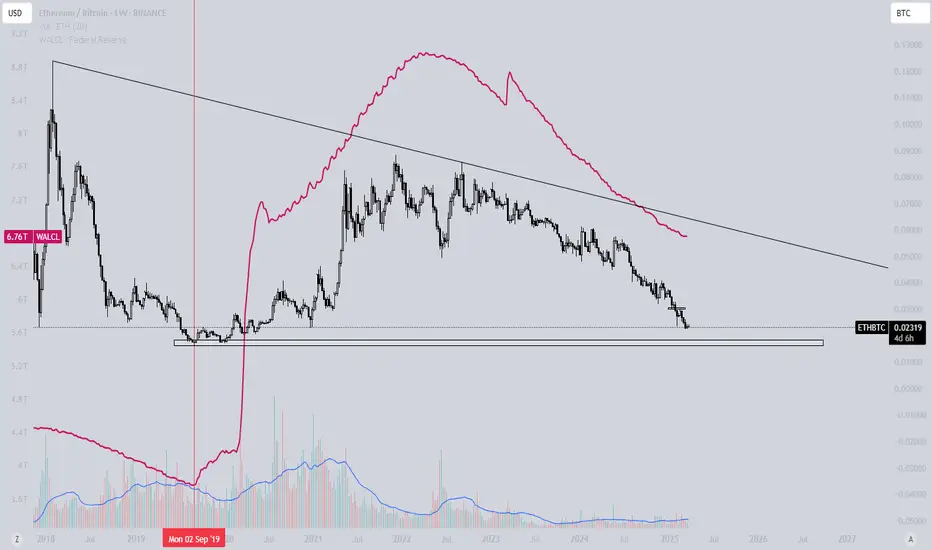
ETH/BTC - When will it finds it bottom?ETH/BTC is still in search of its bottom, likely only finding solid ground once the Federal Reserve fully halts quantitative tightening (QT). However, for now, the Fed has merely slowed QT rather than stopping it entirely. This means liquidity remains constrained, putting continued pressure on risk assets like Ethereum relative to Bitcoin.
Historically, ETH/BTC has thrived in periods of expanding liquidity, and notably, the last time ETH/BTC found its bottom was when QT ended. This suggests that macro liquidity conditions play a crucial role in determining ETH/BTC’s trajectory. However, the Fed remains firm on its stance—only fully reversing QT when interest rates drop below 1 basis point.
Until then, ETH/BTC may remain under pressure, with Bitcoin holding a relative advantage due to its status as a liquidity flight asset. The pair is likely to see a true bottom when the macro environment shifts decisively toward easing, just as it did in previous cycle.
So is it possible that ETH/BTC could decrease to the supportzone at 0.017.
Thanks for your support.
- Make sure to follow me so you don't miss out on the next analysis!
- Drop a like and leave a comment!
BITCOIN Wait For Breakout! Sell!
Hello,Traders!
BITCOIN is trading below
The horizontal resistance
Of 92,000$ and has formed
A bearish wedge pattern so
We are bearish biased and
IF we see a bearish breakout
From the wedge we can
Be expecting a further move down
Sell!
Comment and subscribe to help us grow!
Check out other forecasts below too!
Disclosure: I am part of Trade Nation's Influencer program and receive a monthly fee for using their TradingView charts in my analysis.

HelenP. I Bitcoin can little grow and then drop to support levelHi folks today I'm prepared for you Bitcoin analytics. Some time ago price started to decline and when it fell to 93500 points, it rebounded up to the trend line. Then BTC started to fall inside the wedge, where it soon broke the 91200 level and then in a short time declined to the support zone. After which it turned around and rose to the trend line, which is the support line of the wedge as well. Then Bitcoin fell to the support level again, breaking the resistance level again, but later it tried to back up and failed. Price dropped to the support zone and even a little lower, after which it turned around and in a short time rose to the trend line, breaking the support level one more time. A few moments ago price exited from the wedge and some time traded near the trend line. After this, it started to grow, so, in my opinion, I expect that BTCUSDT will almost rise to the resistance level and then it drop to the 81200 support level, which is my goal. If you like my analytics you may support me with your like/comment ❤️

Why XAUUSD is Bullish ?? Detailed analysis XAU/USD currently trading at approximately $3,030, forming a bullish pennant pattern—a continuation signal that typically precedes further upward movement. This pattern emerges after a strong price surge, followed by consolidation marked by converging trendlines. A breakout above the pennant's upper boundary could propel gold prices toward the target of $3,100, aligning with the prevailing bullish trend
Fundamental factors support this optimistic outlook. Recent geopolitical tensions and concerns over escalating inflation have heightened demand for gold as a safe-haven asset. Additionally, the Federal Reserve's dovish stance, including potential interest rate cuts, has weakened the U.S. dollar, making gold more attractive to investors. These elements collectively contribute to the bullish sentiment surrounding gold.
Technical indicators further reinforce this perspective. Gold has recently surpassed the significant $3,000 threshold, reaching new all-time highs. The formation of the bullish pennant suggests a continuation of this upward momentum. Key support levels to monitor include $2,961 to $2,965, while resistance is anticipated around $3,021 to $3,030. A decisive break above these resistance levels could confirm the pennant breakout, paving the way toward the $3,100 target.
Traders should exercise prudent risk management strategies, such as setting appropriate stop-loss orders, to navigate potential market volatility. Staying informed about upcoming economic data releases and central bank communications will also be crucial in effectively capitalizing on this trading opportunity.

Warning: BCHUSDT Is Approaching a Dangerous Trap ZoneYello, Paradisers! Are you ready for what could be the next classic fakeout setup? BCHUSDT is heading straight into a high-probability reversal zone, and if you’re not paying attention, this could turn into another painful reminder of how quickly things change in crypto…
💎BCHUSDT is currently showing signs of weakness as it moves toward a major resistance zone. This area is reinforced by a 4H Fair Value Gap (FVG) and the critical 0.618 Fibonacci retracement level — both of which have historically acted as strong reversal points.
💎Adding to the confluence, we’re spotting clear bearish divergence on the chart, which further increases the likelihood of a downward move from this level.
💎If BCHUSDT taps into our resistance zone, we’ll be monitoring for bearish price action confirmation.
💎Ideal patterns to validate the setup include: M-formation, Head & Shoulders, Inverse Cup & Handle.
💎These patterns can help us reduce our stop-loss exposure and improve the overall risk-to-reward ratio — patience will be key here.
💎On the flip side, if price breaks out and closes above our invalidation level, the bearish setup will be completely invalidated. In that scenario, it’s smarter to wait for new, more favorable price action before making any trading decisions.
🎖This is the kind of moment that separates disciplined traders from the emotional ones. Don’t rush in blindly — timing, confirmation, and strategic entries are everything if you want to win consistently in this game.
MyCryptoParadise
iFeel the success🌴

LINK/USDT: Strong Momentum Points to Higher TargetsThe LINK/USDT pair has shown strong bullish momentum on the 1-hour timeframe, breaking above both the 15.00 level and a downward trendline. On the daily chart, four consecutive bullish candles reflect persistent buying pressure.
Recent movements suggest an ABC pattern is unfolding, hinting at a potential push toward the 17.00 resistance level. With momentum building, the market may soon test this zone, barring any negative news that could prompt a sell-off. A pullback may occur short term, but the overall outlook remains bullish, with a mid-term target at the resistance zone around 16.45

BitcoinBitcoin now above both MA200&20 , and the trendline ( yellow )
even $84800 is a strong support now

The Power of Commitment in Trading Psychology: A Key to Success
The Power of Commitment in Trading Psychology: A Key to Success 📈💡
Hey TradingView community! I’ve been diving into some trading books lately, and one chapter really hit home: it’s all about commitment. Turns out, it’s the key to making it as a trader—especially in the crypto space where volatility can test your emotions. Here’s what I learned and how I’m applying it to my trading mindset.
Commitment isn’t just about showing up—it’s about promising yourself to be the best trader you can be. I read about a guy who made a ton of money but lost it all because he wasn’t fully in. It made me realize: you can’t just dabble in this game. You gotta go all in. For me, this means sticking to my trading plan, even when the market (or my emotions) tempts me to stray. In crypto, where prices can swing wildly, this is crucial.
One big thing that messes with commitment is the battle between wanting quick wins and sticking to a plan. I’ve caught myself following random advice without thinking—anyone else been there? It’s a trap. Commitment means getting your mind, emotions, and actions on the same page. I’m working on staying disciplined by focusing on my system, even during losing streaks. For example, I use stop-losses and take-profits to keep my emotions in check when trading BTC or ETH.
Here’s a 3-step process I picked up to build commitment:
1️⃣ Figure out what you really want from trading (e.g., steady growth, not just mooning coins).
2️⃣ Spot what’s getting in your way (like fear of losses or FOMO).
3️⃣ Make a plan to push through—like setting clear risk management rules.
For me, this has been a game-changer in staying consistent, especially in volatile markets like crypto.
Psychology matters so much! A lot of traders fail not because their system sucks, but because they can’t stick with it. I’m starting to see how knowing myself better helps me stay committed. Some practical stuff I’m trying: starting small to build confidence, sticking to my system no matter what, learning from experienced traders, and not letting fear of losses throw me off. My current focus is on keeping my position sizes small (1-2% risk per trade) and reviewing my equity curve weekly to ensure I’m on track.
Biggest takeaway: commitment is what makes or breaks you as a trader. It’s about knowing yourself, staying disciplined, and pushing through the tough times. I’m ready to step up—how about you?
What’s your biggest challenge with staying committed in trading?
Let’s discuss in the comments! 👇

levels to watch out The bulls will claim it's on an upward trajectory, while the bears will argue it's heading south. As I see it, we're in a tricky spot, with the markets currently in a no-man's land.
It's respecting the channel, but it lacks clear direction, which means it could swing either way—ultimately pleasing one side while bruising the ego of the other.
If the neckline at 91,000 breaks, we could see the market push towards 108,000 potentially even reaching 125,000. On the flip side, as long as 91,000 holds, we might still see a move towards 71,000 and if that breaks, there's a possibility of the market heading down to 40,000.

BITCOIN Correction in Play - Can Bulls Regain Control?COINBASE:BTCUSD is experiencing a corrective move after forming a double top near the upper boundary of the channel. The rejection from this level has led to increased selling pressure, with price steadily approaching a significant support zone around $73,000. The confluence of the trendline support and the horizontal demand zone increases the probability of a bullish reaction.
If buyers step in at this level, we could see a rebound, with a potential move toward the $90,000 resistance zone. This level could act as a short-term target within the current market structure.
However, failure to hold this support could signal further downside, potentially extending the retracement toward lower levels. Traders should monitor bullish confirmation signals, such as rejection wicks, increasing volume, or bullish engulfing patterns, before anticipating a continuation to the upside.
If you agree with this analysis or have additional insights, feel free to share your thoughts here! 🚀

$AVAX: Avalanche – Snowballing Gains or Melting Away?(1/9)
Good evening, everyone! 🌙 CRYPTOCAP:AVAX : Avalanche – Snowballing Gains or Melting Away?
With AVAX at $23.07, is this blockchain beast a sleeper hit or a slippery slope? Let’s avalanche into it! 🔍
(2/9) – PRICE PERFORMANCE 📊
• Current Price: $ 23.07 as of Mar 25, 2025 💰
• Recent Move: Up from $18, below $40 highs, per data 📏
• Sector Trend: Crypto volatile, AVAX rides the waves 🌟
It’s a rollercoaster—hold tight for the drop! ⚙️
(3/9) – MARKET POSITION 📈
• Market Cap: Approx $9.56B (414.78M tokens) 🏆
• Operations: Scalable L1 for DeFi, dApps, subnets ⏰
• Trend: $1.121B DeFi TVL, whale buys, per posts on X 🎯
Firm in L1 race, but market’s a blizzard! 🚀
(4/9) – KEY DEVELOPMENTS 🔑
• Whale Action: 500K tokens moved, per posts on X 🌍
• DeFi Strength: $1.121B TVL holds firm, per data 📋
• Market Vibe: Bearish Fear Index (34), yet resilient 💡
Snowballing quietly amid crypto storms! ❄️
(5/9) – RISKS IN FOCUS ⚡
• Market Correction: Bearish pressure could sink it 🔍
• Competition: Solana, Ethereum vie for dApps 📉
• Macro Woes: Trade tensions, rates shake things ❄️
It’s a chilly slope—brace for ice! 🛑
(6/9) – SWOT: STRENGTHS 💪
• Scalability: 4,500 TPS, beats rivals 🥇
• DeFi Base: $1.121B TVL, solid ecosystem 📊
• Adoption: Enterprise use grows, per data 🔧
Got a snowy peak of potential! 🏔️
(7/9) – SWOT: WEAKNESSES & OPPORTUNITIES ⚖️
• Weaknesses: Volatility, high off $59 peak 📉
• Opportunities: Whale buys, subnet growth 📈
Can it snowball or melt under pressure? 🤔
(8/9) – POLL TIME! 📢
AVAX at $23.07—your take? 🗳️
• Bullish: $30+ soon, whales fuel it 🐂
• Neutral: Steady, risks balance out ⚖️
• Bearish: $18 looms, correction hits 🐻
Chime in below! 👇
(9/9) – FINAL TAKEAWAY 🎯
AVAX’s $23.07 price tags a volatile gem 📈, with DeFi strength but market risks 🌿. Dips are our DCA jackpot 💰—buy low, ride high! Gem or bust?

UNI Trade Setup - Strength After Liquidity SweepUNI has swept underside liquidity and is now holding strong. If price consolidates above $7, we’ll be looking for local lows to form, setting up a medium-term move higher as broader markets push into resistance.
🛠 Trade Details:
Entry: Around $7 zone
Take Profit Targets:
$10.50 – $11.00 (First Target)
$14.50 – $15.00 (Extended Target)
Stop Loss: Daily close below $5.5
Waiting for market confirmation before positioning for the next leg up! 📈🚀

Trading opportunity for MOVEUSDTBased on technical factors there is a Buy position in :
📊 MOVEUSDT
🔵 Buy Now or by Breakout
🪫Stop loss 0.3680
🔋Target 0.5500
📏 R/R 2
💸RISK : 1%
We hope it is profitable for you ❤️
Please support our activity with your likes👍 and comments📝

TRX/USDT: Consolidation Holds with Upside PotentialThe TRX/USDT market recently saw a false breakout below a key support level, followed by a rebound toward the upper boundary of the channel. On the broader timeframe, the price has been in a two-month consolidation, forming a range near the 0.2200 support, which has held firm through multiple tests.
This consistent rebound highlights the significance of the 0.2200 level, suggesting it may continue to act as a launch point for upward movement. A retest of the trendline is possible, with potential for the price to approach the channel's upper boundary. The next target is the resistance zone at 0.2370

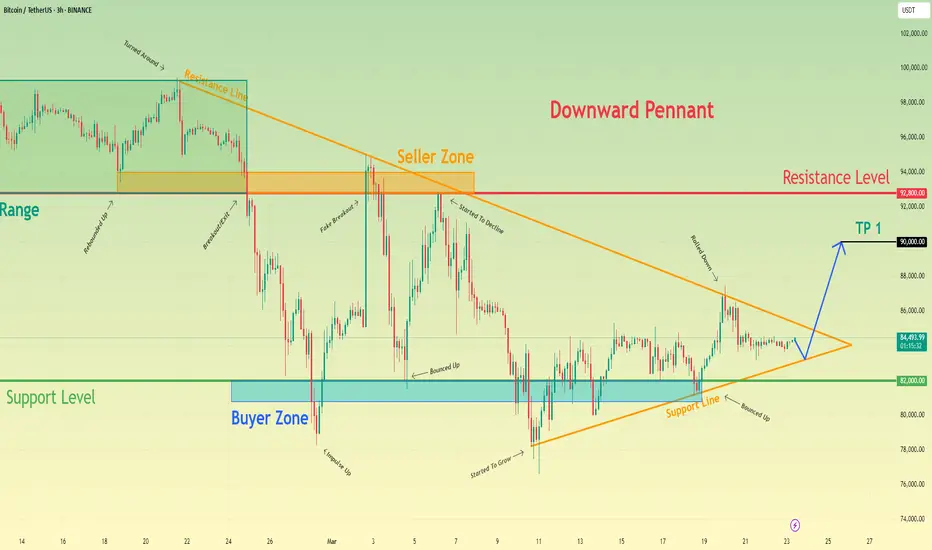
Bitcoin may rebound up from pennant to 90K pointsHello traders, I want share with you my opinion about Bitcoin. Not long ago, BTC was trading inside a wide range, where the price moved sideways and eventually touched the resistance line, from which it turned around and began to fall. After the decline, BTC exited the range, breaking through the lower boundary and sharply dropping to the support level, which aligned with the buyer zone. From there, we saw a quick impulse up, but this movement faced strong resistance inside the seller zone, where a fake breakout occurred — price briefly moved above but then sharply reversed and began another decline. As BTC continued to decline, it formed a downward pennant pattern. Within this structure, we can clearly see how the price respected both the resistance line and the support line of the pennant, bouncing up from the lower boundary several times. The most recent bounce came again from the buyer zone, indicating that bulls are still defending this area. At the moment, BTC is consolidating near the tip of the pennant, and I believe there’s a high probability of an upcoming breakout. My base scenario assumes that we could see one more minor pullback toward the support line, followed by an upward breakout from the pennant. If that happens, the price may reach the 90000 points, which I consider as TP1. Please share this idea with your friends and click Boost 🚀
COMP - Shift in Momentum in Action!Hello TradingView Family / Fellow Traders. This is Richard, also known as theSignalyst.
🔹 COMP has been overall bearish trading within the falling channel in red.
However , it is currently rejecting a strong weekly support at $35 - $40.
Moreover, it is clear that the bears are exhausted as the bearish impulse phases are getting more flat.
📈 For the bulls to take over, and shift the momentum in their favor, a break above both trendlines and $50 round number is needed.
📚 Always follow your trading plan regarding entry, risk management, and trade management.
Good luck!
All Strategies Are Good; If Managed Properly!
~Rich

DOT & LTC TRADE SET UPDOT LONG
Entry Price 1: $4.60
Entry Price 2: $4.40
Stop Loss: $4.10
Take Profit 1: $4.80
Take Profit 2: $5.00
Take Profit 3: $5.20
Take Profit 4: $5.50
Status: ACTIVE
LTC NEUTRAL WAITING FFOR BREAK OUT
