BTC ANALYSIS🚀#BTC Analysis :
🔮As we can see in the chart of #BTC that there is a crucial support and resistance zone. Now trading at a crucial resistance zone. We could expect a bullish move from this level
⚡️What to do ?
👀Keep an eye on #BTC price action. We can trade according to the chart and make some profits⚡️⚡️
#BTC #Cryptocurrency #TechnicalAnalysis #DYOR
Crypto

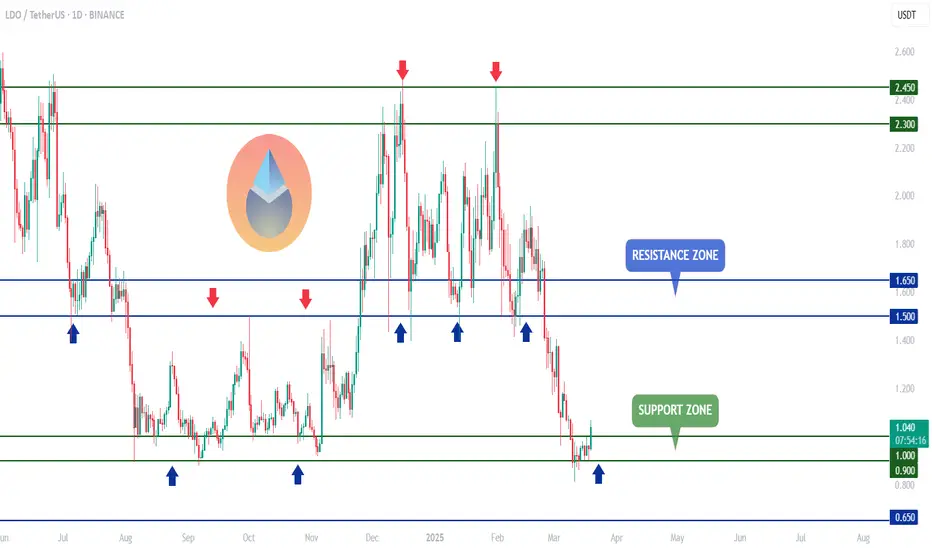
LDO - the only way is up from here!MIL:LDO -@LidoFinance
Ethereum staking at its best!🥇
#LDO has been rejecting the $0.9 – $1 zone like a charm.
As long as this support holds, further upside toward the $1.5 round number and resistance is expected.🚀
Bitcoin's Wild Ride: Will It Moon or Crash and Burn?Ah, Bitcoin—the digital rollercoaster we all love to hate. Currently lounging around $84,000 , but what's next? Let's dive into the crystal ball of crypto predictions, shall we? 🔮
The Bullish Dreamers:
Derivatives Delight: Some analysts are giddy over derivatives metrics, suggesting Bitcoin is "poised" to reclaim the $90,000 level in the coming weeks. Because who doesn't love a good gamble?
The Bearish Realists:
Death Cross Drama: Hold onto your hats! Bitcoin is flirting with a "death cross," where the 50-day moving average dips below the 200-day. Historically, this is like the crypto version of a horror movie—cue the dramatic music.
Support Level Shenanigans: If Bitcoin can't muster the strength to stay above $81,000, we might be sliding down to $76,000 faster than you can say "HODL."
The Fence-Sitters:
FOMC Follies: All eyes are on the upcoming Federal Open Market Committee meeting. Will they hike rates? Will they cut? Will they order pizza for lunch? Their decisions could send Bitcoin on a joyride or a nosedive.
So, what's the takeaway? Is Bitcoin gearing up for a moon mission, or are we strapping in for a freefall? As always, keep your wits about you, and maybe a parachute handy. 🎢🪂
If you want the deeper breakdown (the one nobody’s telling you), drop a comment or DM me. Maybe I’ll let you in on the real insights. 👀🔥
Disclaimer: This is not financial advice. Always do your own research before diving into the crypto abyss.

DOT/USDT: Consolidation Expected After Recent Bounce The DOT/USThe DOT/USDT market has recently rebounded from a previously tested level from November. Following this bounce, the price appears to be forming an ABC pullback, moving towards the channel boundary.
Historical price action shows that the market has consistently respected the resistance zone, reinforcing the prevailing bearish trend. Given this setup, the market is likely to enter a consolidation phase, with price stabilizing within the 4.88 to 4.00 range. The next key target lies at the support zone around 4.100

Bitcoin weekly RSI levelthe bitcoin price & RSI level is so get involved together.
the RSI weekly level at 44 & weekly candles at 80k seems a very strong support now.

BITCOIN BULLISH TO $116?! (UPDATE)BTC buyers are holding up nicely so far. We have even seen a BOS to the upside, indicating further upside will follow.
Now that Wave 4 has taken out all late buyers, we can see smart money come back in now from these lower prices and push BTC back up!

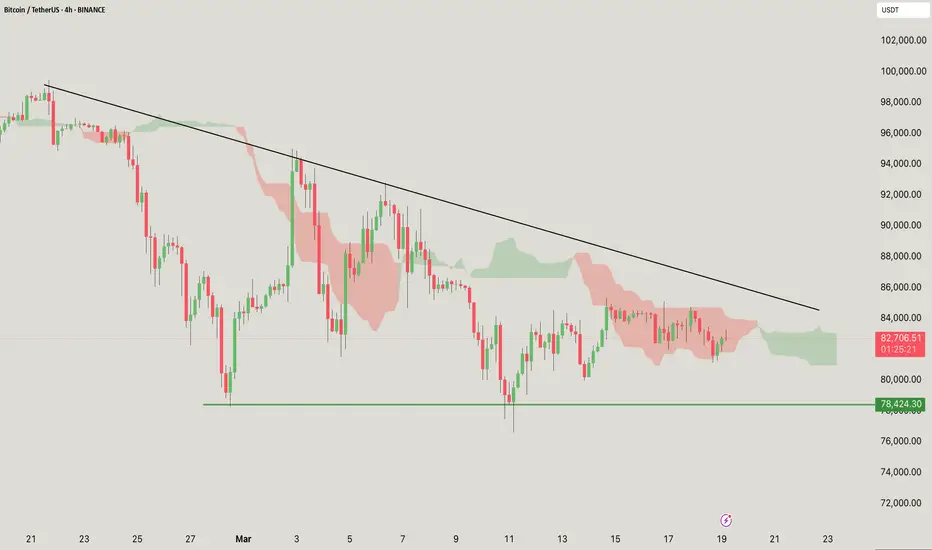
Bitcoin (BTC/USDT) 4-hour chart.
Price: Currently around $82,753.16, showing a slight increase of +0.05%.
Trend line: A descending trend line is visible, indicating potential resistance. If the price breaks above this line, it could signal a bullish reversal.
Support level: There is a strong support level at $78,424.30, which has been tested multiple times.
Indicators: The price is currently in the cloud, indicating a state of indecision. The green cloud above indicates potential resistance, while the red cloud below indicates previous bearish momentum.
Resistance: Keep an eye on the descending trend line and the upper edge of the cloud.
Support: The $78,424 level acts as a crucial support area.
Monitor breakouts: A breakout above the trend line may indicate an uptrend, while a breakdown below the support level may signal a further decline.
Volume analysis: Monitor trading volume to confirm breakouts.
If you found this analysis helpful, hit the Like button and share your thoughts or questions in the comments below. Your feedback matters!
Thanks for your support!
DYOR. NFA
BTCUSD 8H: Trendline Pressure and Key Support Test🔥 BTCUSD 8H Deep Dive
1️⃣ Trendline Pressure: Bears controlling the market with a strong descending trendline.
2️⃣ Support Zone Strength: $77,500-$80,000 is a key demand area. Previous bounce shows buyers stepping in.
3️⃣ Liquidity Hunt? Price might sweep the support zone before reversal.
4️⃣ Volume Check Needed: Low volume = fakeout risk. High volume = potential breakout.
🎯 Targets
Bullish Breakout: $85,000-$87,500
Bearish Breakdown: $77,500-$75,000
📍 Eyes on next 8H close.

BTC overview - Will we make another huge bounce from here?In this analysis, we discuss BTC on the weekly timeframe in correlation with the RSI and the Stochastic RSI. Is BTC able to bounce from these levels, or are we heading to lower levels before the next bounce? I will explore this in the following analysis.
After a long consolidation in 2024, BTC reached a new all-time high (ATH) at the end of 2024/beginning of 2025. However, by making a new ATH, BTC formed a bearish divergence with the RSI—similar to what happened in 2021 when BTC reached a new ATH.
At the moment, BTC's price action looks very healthy. It is making new highs and higher lows. During the recent correction from nearly 110K, the RSI dropped to around 44, a strong support zone for the RSI in this bull market. The last two times the RSI bounced from the 44 level, BTC saw an increase of approximately 180% and 100%. In both instances, the Stochastic RSI was also oversold and bounced back to the overbought zone.
Currently, BTC is heading toward the support level at 73K, which aligns with the Golden Pocket, while the RSI holds support at 44 and the Stochastic RSI remains oversold.
It is crucial that BTC maintains support at 73K and the RSI at 44. If either one breaks, lower levels are highly likely.
If BTC finds strength at these support levels, we need to see the RSI break above 79. This would indicate the end of the bearish divergence and open the door for higher prices. However, if BTC reaches a new ATH and the RSI fails to break 79, we must watch for a continuation of the bearish divergence.
Can Bitcoin hold this level and make a significant bounce, as it did the last two times, with BTC at support, RSI at support, and the Stochastic RSI in the oversold area? The coming weeks may provide a signal on the direction BTC will take—bullish or bearish. For now, it could go either way, and we must wait for a clear market direction.
Thanks for your support!
Drop a like and leave a comment to have a conversation about this topic. Make sure to follow me so you don’t miss out on the next analysis.

BTCUSD: This isn't the Top by any meansBitcoin remains slightly bearish on its 1D technical outlook (RSI = 41.137, MACD = -3097.700, ADX = 33.471) as even though it appears its trading on a macro bottom, just over the 1W MA50 (1W RSI = 45.068), it hasn't broken out yet. The market undoubtedly took a psychological hit with February's drop but despite the voices calling for a new bear market, we are here to show you why this Cycle hasn't topped yet and is still far from doing so.
This metric measures BTC's temporary stops/ tops during a Bull Cycle. It is a Halving-to-Halving method, starting on the most recent Halving and ending on the next one. Stop 1 is where the starting Halving takes place and the market pulls back. Stop 2 is the next pullback on the 0.236 Time Fibonacci level. The 0.382 Fib prices Stop 3 and basically the Cycle Top. This has been happening on both previous Cycles exactly as described and on the 2012-14 Cycle it just had to be adjusted a little before the 1st Halving due to the Cycle being much shorter since it was the earliest. Nevertheless, it fits the Stop points perfectly.
Note also that distance from the Halving (Stop 1) to Stop 3 has always been 76/78 weeks. This suggests the we can have a new Cycle Top by October 20th 2025 the latest.
## If you like our free content follow our profile to get more daily ideas. ##
## Comments and likes are greatly appreciated. ##

Why GBPJPY is Bullish?? Detailed technical and fundamentalsThe GBP/JPY pair has recently confirmed a bullish reversal by breaking out of a falling wedge pattern, aligning with our earlier analysis. Currently trading at 194.000, the pair is on track toward our target of 199.000.
Technically, the breakout from the falling wedge—a pattern typically indicative of bullish reversals—suggests increased buying momentum. This is further supported by the pair's ability to maintain levels above key resistance points, now acting as support. The next significant resistance is anticipated around the 195.000 level, a psychological barrier that, if surpassed, could pave the way toward our 199.000 target.
Fundamentally, the British pound has been bolstered by positive economic indicators, including robust GDP growth and a resilient labor market, enhancing investor confidence. Conversely, the Japanese yen has experienced depreciation due to the Bank of Japan's commitment to ultra-loose monetary policies, aiming to stimulate inflation and economic growth. This monetary policy divergence has contributed to the upward trajectory of GBP/JPY.
In conclusion, the confluence of technical and fundamental factors supports a bullish outlook for GBP/JPY. Traders should monitor upcoming economic releases and central bank communications, as these could impact market sentiment and price action. Maintaining a disciplined approach with appropriate risk management strategies is essential as the pair approaches the 199.000 target.

FIL/USDT Breakdown – Is a Major Drop Coming? Yello, Paradisers! FIL/USDT has just broken below the EMA 50, and that’s a big red flag for bulls. This level had been acting as strong dynamic support, and now that it’s lost, the bearish momentum is strengthening. If buyers can’t reclaim it soon, the market could be gearing up for a deeper move to the downside.
💎The price is struggling around the major Supply Zone at $2.90 - $3.00, and the failure to hold above this level combined with the EMA 50 breakdown increases the likelihood of a drop toward the next Support Area at $2.467 - $2.209. With the EMA 50 now acting as resistance, any retest is likely to face heavy selling pressure.
💎The EMA 200 remains a key dynamic resistance, reinforcing the bearish bias. Unless FIL/USDT reclaims the EMA 50 and breaks convincingly above $3.306 with strong volume, the downward trend remains intact.
💎If the decline continues with increasing volume, sellers are firmly in control, making a deeper drop more likely. On the other hand, a weak move lower with low volume could indicate exhaustion, potentially leading to a short-term bounce or consolidation.
This is not the time to chase trades blindly. Patience and discipline always win in the long run, Paradisers. Stick to your levels and execute only high-probability setups. Stay sharp.
MyCryptoParadise
iFeel the success🌴

ARB/USDT – The zone is interesting for starting accumulation.Arbitrum - is an Ethereum layer-two (L2) scaling solution. It uses optimistic rollups to achieve its goal of improving speed, scalability and cost-efficiency on Ethereum. Arbitrum benefits from the security and compatibility of Ethereum. Another benefit is the higher throughput and lower fees compared to Ethereum. That is made possible thanks to moving most of the computation and storage load off-chain.
Arbitrum’s native token is called ARB and is used for governance. Offchain Labs, the developers behind Arbitrum, announced the shift to a decentralized autonomous organization (DAO) structure — the Arbitrum DAO. ARB holders can vote on proposals that affect the features, protocol upgrades, funds allocation and election of a Security Council.
CoinMarketCap : #51
The hyped-up Arbitrum! 😂
📉 January - February - March 2024: Bloggers trapped a huge number of people, and now we’re seeing a massive -87% decline!
Looking at the main trend, a large descending channel is forming. The price is currently at the support of the inner channel, and if the market makes a final liquidity grab with a downward wick, the price could head toward the support of the outer channel, targeting a -30% drop.
In my previous trading idea, I marked the 1.1552 zone, which is exactly where the price reversed. Everything is marked on the chart—the potential profit is very solid, especially for spot trading. The price will react strongly to the resistance zones of both the inner and outer channels.
🚀 These are the moments to watch for position accumulation—when no one is interested and belief in growth is dead, not when everyone is screaming "BUY NOW!" at local tops!
*I will update the trading idea as the trend develops.

ETH/USDT: Testing Key Support with Potential for ReboundThe ETH/USDT pair continues to decline, approaching a key support level last tested in October 2023. Historically, similar price movements were observed in 2021, when the price dropped from the 4,300 level before rebounding from the 1,700 support zone, ultimately leading to new all-time highs.
Currently, the price has broken above a downward trendline that had served as a resistance throughout the month. Looking ahead, the market may remain in a sideways phase over the coming weeks, with a potential upward push if buying pressure emerges from the support level. The next key target is the resistance zone around 2,190

PIUSDT : Head & Shoulders Signals a Major Drop Incoming!Yello, Paradisers! PIUSDT is flashing strong bearish signals! The price has formed a Head & Shoulders pattern right on the resistance trendline of a descending channel—this combination significantly increases the probability of a sharp move to the downside.
💎PIUSDT breaks below the neckline and closed a candle which validates the bearish setup, increasing the likelihood of further downside.
💎However, We have to wait for the proper retest of the neckline, patience is key for the right entry.
💎On the flip side, if PIUSDT breaks above the resistance zone and closes candle above it, the bearish setup will be invalidated.
Stay disciplined and wait for confirmation, Paradisers. A fakeout could trap impatient traders—don’t be one of them! 🎖
MyCryptoParadise
iFeel the success 🌴

BTC - Bullish SOON!Hello TradingView Family / Fellow Traders. This is Richard, also known as theSignalyst.
BTC has been in a correction phase, and it feels like it's taking forever! ⏳
As long as the blue trendline holds, the overall bias remains bullish. 📈
As BTC approaches the blue trendline—perfectly aligning with a demand zone and support—we'll be watching for trend-following longs to catch the next big impulse move upward. 🚀
For now, we wait! ⏳
📚 Always follow your trading plan regarding entry, risk management, and trade management.
Good luck!
All Strategies Are Good; If Managed Properly!
~Rich
